- Dogecoin price is on the verge of a 68% breakout from a falling wedge.
- Investors can expect DOGE to trigger an exponential growth to $0.23.
- A weekly candlestick close below $0.078 will invalidate the bullish outlook.
Dogecoin price has been consolidating inside a massive falling wedge pattern, that is edging closer to a breakout. A decisive move above the upper trend line could be the key to triggering an uptrend for DOGE.
Moreover, 4/20 is celebrated as a meme day, the chances of the original meme coin aka Dogecoin pumping are high. Therefore, investors need to keep a close eye on dog-themed coins that have the support of Tesla CEO, Elon Musk aka the Dogefather.
Dogecoin price to retrace its steps back higher
Dogecoin price crashed roughly 85% from its peak at $0.740 to $0.109 in roughly 308 days, This downswing has produced three distinctive lower highs and lower lows, which when connected using trend lines reveal a falling wedge pattern.
The said technical formation forecasts a 68% upswing, obtained by adding the distance between the first swing high and swing low to the breakout point. Since last week, Dogecoin price has edged closer to the upper trend line in an attempt to break higher.
Interestingly, DOGE is already hovering above the upper trend line but a confirmation of the breakout is not here yet. Assuming a breakout occurs around $0.140, extrapolating shows that the target after a 68% upswing will be $0.233.
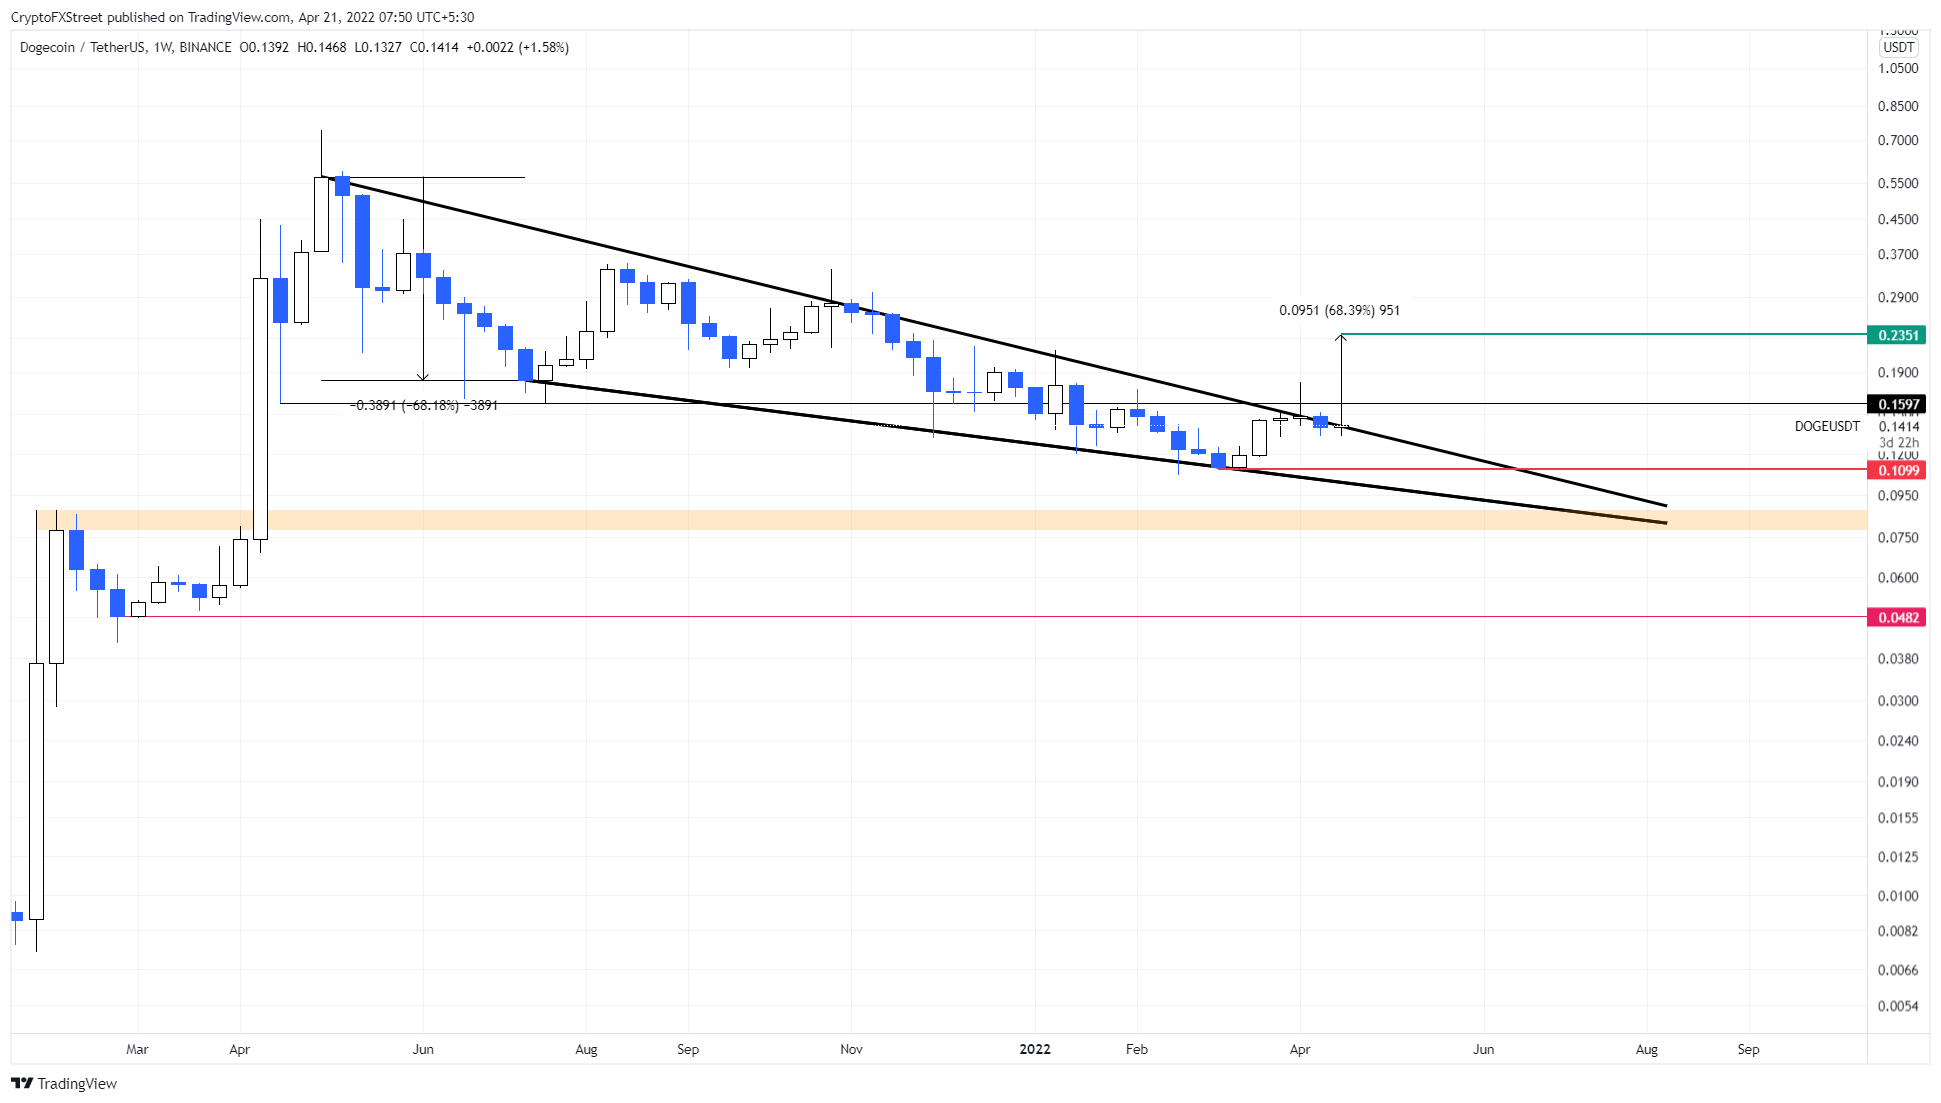
DOGE/USDT 1-week chart
Perhaps the most important on-chain metric that aptly reveals the bullish outlook for Dogecoin price is the 365-day Market Value to Realized Value (MVRV)
This on-chain metric is used to determine the average profit/loss of investors that purchased DOGE over the past year. Based on Santiment’s research, a value below -10% indicates that short-term holders are at a loss and are less likely to sell. More often than not, this is where long-term holders accumulate. Hence, any move below -10% is termed an “opportunity zone.”
For DOGE, the 365-day MVRV has been hovering below zero line since October 2021 and has been stuck below -30% since December 2021, indicating the wildly oversold nature of the altcoin and why it is bound to rally sooner rather than later.
DOGE 365-day MVRV
Regardless of the bullish narratives, a weekly candlestick close below $0.078 will invalidate the bullish outlook. In this situation, investors need to prepare for a potential crash to $0.048.
Information on these pages contains forward-looking statements that involve risks and uncertainties. Markets and instruments profiled on this page are for informational purposes only and should not in any way come across as a recommendation to buy or sell in these assets. You should do your own thorough research before making any investment decisions. FXStreet does not in any way guarantee that this information is free from mistakes, errors, or material misstatements. It also does not guarantee that this information is of a timely nature. Investing in Open Markets involves a great deal of risk, including the loss of all or a portion of your investment, as well as emotional distress. All risks, losses and costs associated with investing, including total loss of principal, are your responsibility. The views and opinions expressed in this article are those of the authors and do not necessarily reflect the official policy or position of FXStreet nor its advertisers. The author will not be held responsible for information that is found at the end of links posted on this page.
If not otherwise explicitly mentioned in the body of the article, at the time of writing, the author has no position in any stock mentioned in this article and no business relationship with any company mentioned. The author has not received compensation for writing this article, other than from FXStreet.
FXStreet and the author do not provide personalized recommendations. The author makes no representations as to the accuracy, completeness, or suitability of this information. FXStreet and the author will not be liable for any errors, omissions or any losses, injuries or damages arising from this information and its display or use. Errors and omissions excepted.
The author and FXStreet are not registered investment advisors and nothing in this article is intended to be investment advice.
Recommended Content
Editors’ Picks
Kyber exploiter asks for complete control of all assets after nearly $50 million exploit

Kyber network exploiter drained the protocol’s liquidity pools of nearly $50 million on November 22. The team behind Kyber managed to recover $4.67 million and communicated with the exploiter for the remainder of assets.
Chainlink supply on exchanges hits lowest point since 2020, with LINK staking v0.2 launch

Chainlink supply on exchanges declined to a level previously seen in February 2020. LINK staking v0.2 went live on November 28, attracting 68% of staked tokens from v0.1.
Bitcoin Spot ETF applications see amendments, holders await January batch approval

Bitcoin Spot ETF race has late entrants and updates from BlackRock, according to James Seyffart. BTC Spot ETF approval anticipation has fueled a rally in both spot and futures markets.
Ethereum Price Prediction: ETH top-down analysis hints upside is capped at $2,500

Ethereum price trades in a clear consolidative trend on the weekly time frame between $1,933 and $2,141 barriers. The daily chart for ETH shows a sweep of Monday’s high is likely to be followed by a sweep of Monday’s low at $1,985.
Three key BTC accumulation levels before ETF approval in January 2024

Bitcoin, from a high time-frame perspective, has been in an up-only trend since the start of 2023. BTC has ignored many sell signals due to the likelihood of an Exchange-Traded Fund approval. With the holidays around the corner, falling liquidity could see BTC discounted from its current level, hovering around the $37,000 region.