Why Tezos’s XTZ price is nowhere near to a market bottom
- Tezos price is set to continue its bear trend this week.
- XTZ price needs to break above three key chart elements before an uptrend recovery can take place.
- A drop of a further 85% is possible if the trading environment deteriorates.

Tezos (XTZ) price is still very much stuck in an overall downtrend since November. A clearly defined trend channel can be derived from a daily chart, which spells roughly another 80% downturn. Once the current plateau breaks, another leg lower is likely to get underway, and $1.00 could be at risk of breaking.
XTZ price set to tank 80% in the current downtrend
Tezos price looks to be in trouble as three bearish elements are weighing on price action, and all three need to be broken before traders can even consider going long the altcoin. The first two are the 55-day Simple Moving Average (SMA) and the 200-day SMA, which are both descending alongside each other, and providing a double bandwidth of bearish pressure on XTZ price, that is likely to keep the downtrend in play. The final element is the bearish trend channel, which helps contain price action from any outbursts to the upside, by helping bears pinpoint the right moment to engage and then take profit in case price action makes new lows.
XTZ price is currently supported by a floor, with the S2 from May and the S1 from June near $1.35. As bearish pressure persists, expect to see a break below $1.35, and the current monthly S1 support below $1.00 at $0.96. Indeed, in case of dollar strength remaining at current elevated levels, expect to see $0.50 provide support backed up by the monthly S2 pivot level.
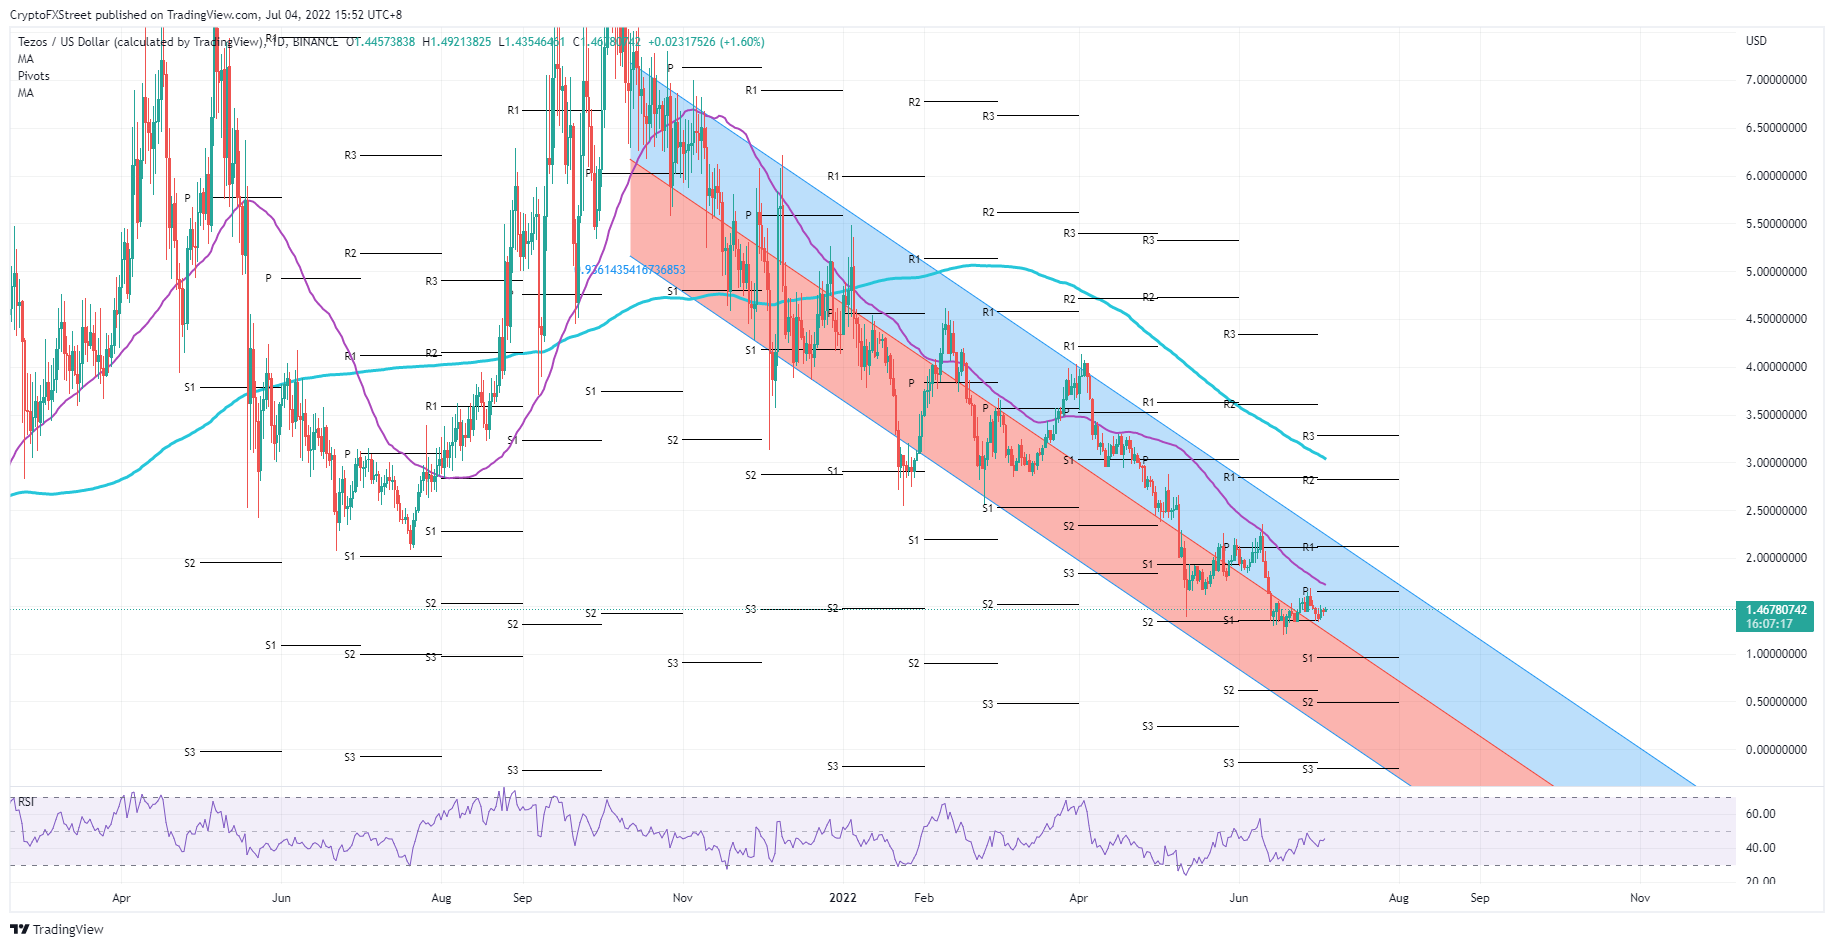
XTZ/USD daily chart
XTZ price could see a small window of relief should it pop successfully above $1.73 and break the 55-day SMA. This would open up some room for gains between the 55-day SMA and the top of the upper blue line of the trend channel. A solid 43% return could be up for grabs if traders and bulls can pump the price to the monthly R1 near $2.12.
Author

Filip Lagaart
FXStreet
Filip Lagaart is a former sales/trader with over 15 years of financial markets expertise under its belt.



