Why Polygon’s MATIC may have seen a bottom amid underperformance
- MATIC is down over 70% from its yearly high of $1.29.
- The token is trading around its highest demand zone of $0.36 - $0.39; its 365-day MVRV indicates price bottom.
- MATIC could confirm a bottom with a bounce off its two-year low at $0.3578.

Polygon MATIC, now known as POL, has been one of the most underperforming cryptocurrencies in the top 100 since the beginning of the year, declining more than 62% year-to-date. However, several key metrics on Wednesday show that its price may have seen a bottom.
MATIC is at a critical juncture that represents potential price bottom
After reaching a yearly high of $1.29 on March 13, MATIC has plunged by over 70%. While several cryptocurrencies still have a positive yearly return despite the recent market downturn, MATIC is down by 26% in the past year. The weak performance has seen 96% of its investors holding its token at a loss.
MATIC is trading around a critical price range of $0.36 - $0.39, where investors purchased over 7 billion MATIC tokens, per IntoTheBlock's data. Due to the large demand around this price, investors may defend it critically, causing a potential price bottom. However, a further decline below $0.36 could give room for more downsides.
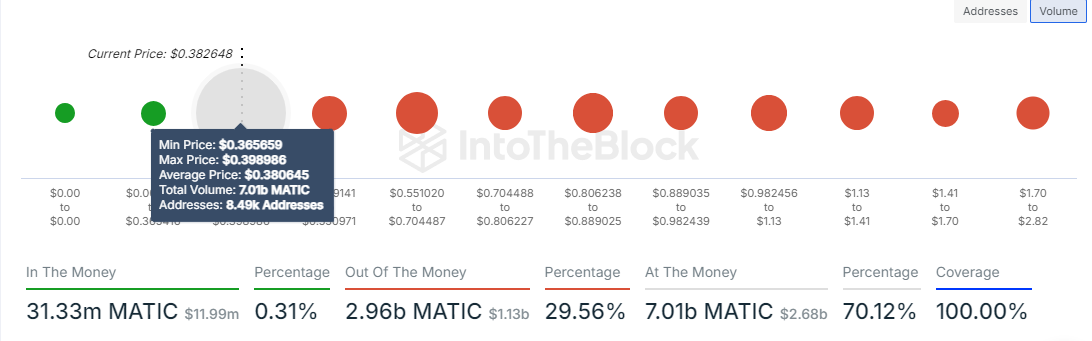
MATIC Global In/Out of the Money
MATIC's Market Value to Realized Value (MVRV) ratio, which measures the average profit or loss of addresses that bought the token within a specific time frame, shows a similar picture. The 30-day, 60-day, 90-day, 180-day and 365-day MVRV ratios are all below the zero level, indicating investors who bought MATIC within the respective time ranges are all experiencing a loss, per Santiment data. Notably, the 365-day MVRV, at 96.9%, indicates a potential price bottom.
 [03.16.59, 18 Sep, 2024]-638622251532043341.png)
MATIC MVRV Ratios
Another key metric is Polygon's total value locked (TVL), which has remained relatively flat, hovering around $800 million to $900 million in the past year, per DefiLlama data. This shows a lack of new DeFi interest in its blockchain network.
MATIC could rally to $0.5812 if it crosses above 50- and 200-day SMAs
MATIC (POL) open interest is at a three-year low of $27 million, declining 93% from an all-time high of $438.8 million in February, per Coinglass data. Open interest is the total number of unsettled contracts in a derivatives market. The low OI shows investors are still displaying a risk-averse attitude toward MATIC. Its OI needs to grow to support any potential move for a rally.
On the daily chart, MATIC is trading around the $0.3773 price level — a two-year low — within a key rectangle. Prior to the low in early September, this level was last seen in June 2022, following the bearish trend after the LUNA/UST implosion.
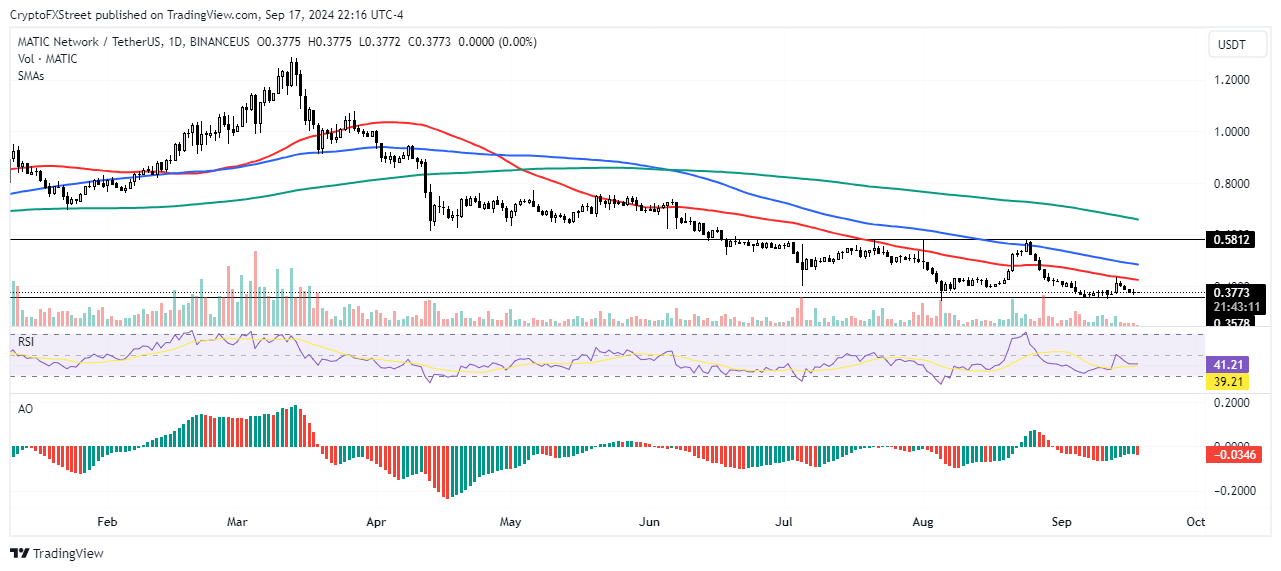
MATIC/USDT Daily chart
On the downside, MATIC could find support around the $0.3578 level. On the upside, MATIC could rally toward the rectangle's resistance of $0.5812 if its price crosses above the 50-day and 200-day simple moving averages (SMA). A further move above the upper rectangle resistance around $0.5812 could trigger a significant rally.
The Relative Strength Index (RSI) and Awesome Oscillator (AO) momentum indicators are just below their neutral levels of 50 and 0, respectively, indicating a slightly bearish bias.
A daily candlestick close below $0.3578 will invalidate the thesis, triggering heightened bearish pressure.
Author

Michael Ebiekutan
FXStreet
With a deep passion for web3 technology, he's collaborated with industry-leading brands like Mara, ITAK, and FXStreet in delivering groundbreaking reports on web3's transformative potential across diverse sectors. In addition to


