Why investors are rushing to add XRP to their portfolios
- XRP price coils up in a symmetrical triangle, hinting at an explosive 70% breakout.
- On-chain metrics support a bullish move but only after a well-planned fakeout.
- A three-day candlestick close below the July 18 swing low at $0.515 will invalidate the bullish thesis for Ripple.

XRP price is at a position that has historically returned massive gains for patient buyers. Therefore, investors need to keep a close eye on this remittance token as an explosive move is around the corner.
XRP price at inflection point
XRP price consolidation over the past year, extending from April 2021 to April 2022 produced a symmetrical triangle. This setup consists of a series of lower highs and higher lows which are connected using trend lines.
Unlike other patterns, this one does not have a directional bias and forecasts a 70% price swing upon breakout. The target is obtained by adding the distance between the first swing high and swing low to the breakout point.
At the time of writing, XRP price is hovering around the lower trend line of the triangle. The last two times, the remittance token tagged this barrier a massive upswing emerged. So, if history repeats itself, Ripple stands to trigger another run-up.
Assuming, XRP price produces a daily candlestick close above the upper trend line at $0.926, it will signal a liquidity run above the equal highs and also trigger a new uptrend to the forecasted target at $1.575.
Supporting this bounce from the symmetrical triangle’s lower trend line is the Relative Strength Index (RSI). This indicator tracks momentum and oscillates between 0 to 100. Generally accepted ranges include an oversold level below 30 and an overbought condition above 80.
As seen in the chart below, XRP price has a history of bouncing off the yellow range, extending from 30 to 36. The last two retests of the symmetrical triangle’s lower trend lines coincided with the RSI hitting this range and bouncing back.
Interestingly, the recent downtrend has also pushed RSI extremely close to RSI’s local bottom, which indicates the possibility of an upswing. Therefore, one of two things could happen here
XRP price slips below the symmetrical triangle and triggers a fakeout and bounce as RSI hits the local bottom, trapping sellers.
A consolidation along the lower trend line that pushes RSI to retest the yellow box, creating a bullish divergence. This development will likely result in a price move to the upside.
Regardless of what scenario takes place, investors can stand to gain a minimum of 70% if they accumulate after the breakout or roughly 140% from the current position - $0.648.
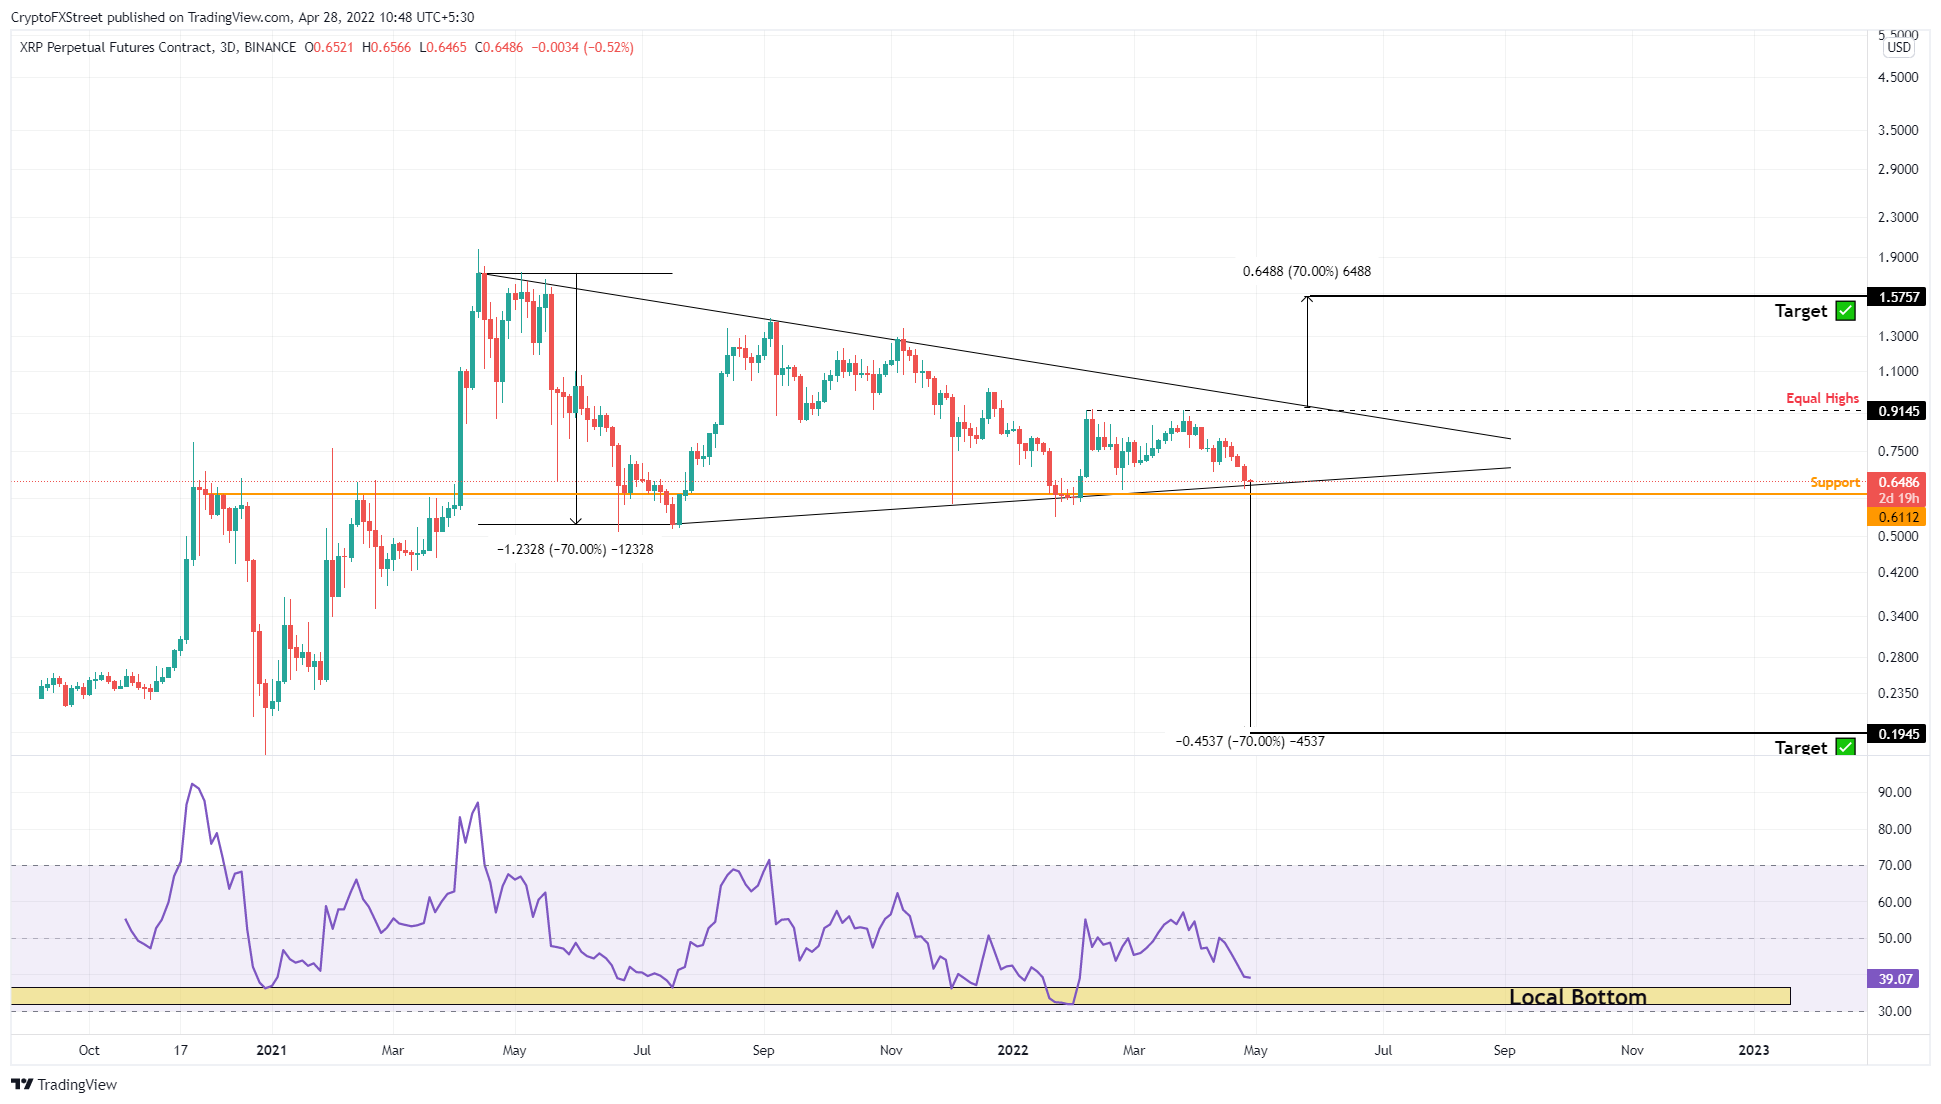
XRP/USDT 3-day chart
Adding credence to XRP’s bullish outlook is the 365-day Market Value to Realized Value (MVRV) model. This index is used to measure the average profit/loss of investors that purchased XRP tokens over the past year.
Based on multiple backtests, Santiment states that a value between -10% to -15% is where long-term holders accumulate since short-term holders are at a loss. As a result, this range is termed an “opportunity zone.”
For XRP, the 365-day MVRV is hovering around –27% and the data for the last two years shows that a local bottom formed at around -30%, indicating that a trend reversal could be around the corner, which also backs up the bullish technical forecast.
 [10.42.26, 28 Apr, 2022]-637867317197672828.png)
XRP 365-day MVRV
While things are looking massively bullish for XRP price, there could be a scenario where a fakeout could cause retail holders to capitulate, leading to a deeper correction. In such a case, a three-day candlestick close below the July 18 swing low at $0.515 will invalidate the bullish thesis for XRP price. In such a case, Ripple could continue sliding lower until it tags the $0.444 stable support level.
Author

Akash Girimath
FXStreet
Akash Girimath is a Mechanical Engineer interested in the chaos of the financial markets. Trying to make sense of this convoluted yet fascinating space, he switched his engineering job to become a crypto reporter and analyst.


