Where XRP price could bottom and how to reenter the market
- XRP price is hovering around the $0.395 weekly support level, trying to discern the directional bias.
- A breakdown of this barrier could knock Ripple by 50% to the volume point of control at $0.186.
- If buyers manage to recover above the $0.621 barrier, it will invalidate the bearish thesis.
XRP price shows an interesting outlook as it crashes below multiple support levels on a weekly time frame. This bearish outlook is inescapable as the LUNA-UST kingdom collapses. The domino effect is not just felt by BTC but also by the entire ecosystem.
Despite the brutality witnessed over the past week, more could be around the corner, which could drive Ripple further down.
XRP price at make or break levels
XRP price has been producing lower highs since April 12 swing high at $1.96, with the swing lows forming a base around the $0.621 support level. This consolidation was seen for over a year before a decisive breakdown was seen in the second week of May.
Since then, XRP price has crashed 32% to where it currently trades at $0.382. The massive downturn comes as the entire crypto market is in a selling frenzy after the 98% crash in LUNA price due to the instability of the UST peg.
While the $0.395 weekly support level seems to have it under control, things are not as simple as they seem from the outside. As Bitcoin hovers around $28,200, the chances of a relief rally are high, especially since it has dipped into most of the 2021 liquidity pools.
However, a further descent in the big crypto’s market value will cause XRP price to shatter the aforementioned support level. The remittance token could then crash by 53% to retest the volume point of control at $0.186 for the price action since 2017.
This point is where the highest volume for XRP price was traded since 2017, making it a critical inflection point. Thus, the $0.186 level will likely serve as stable support and see accumulation come into the picture.
Regardless, the point still stands – a 50% crash is on the cards for XRP price if it fails to hold above the $0.395 foothold.
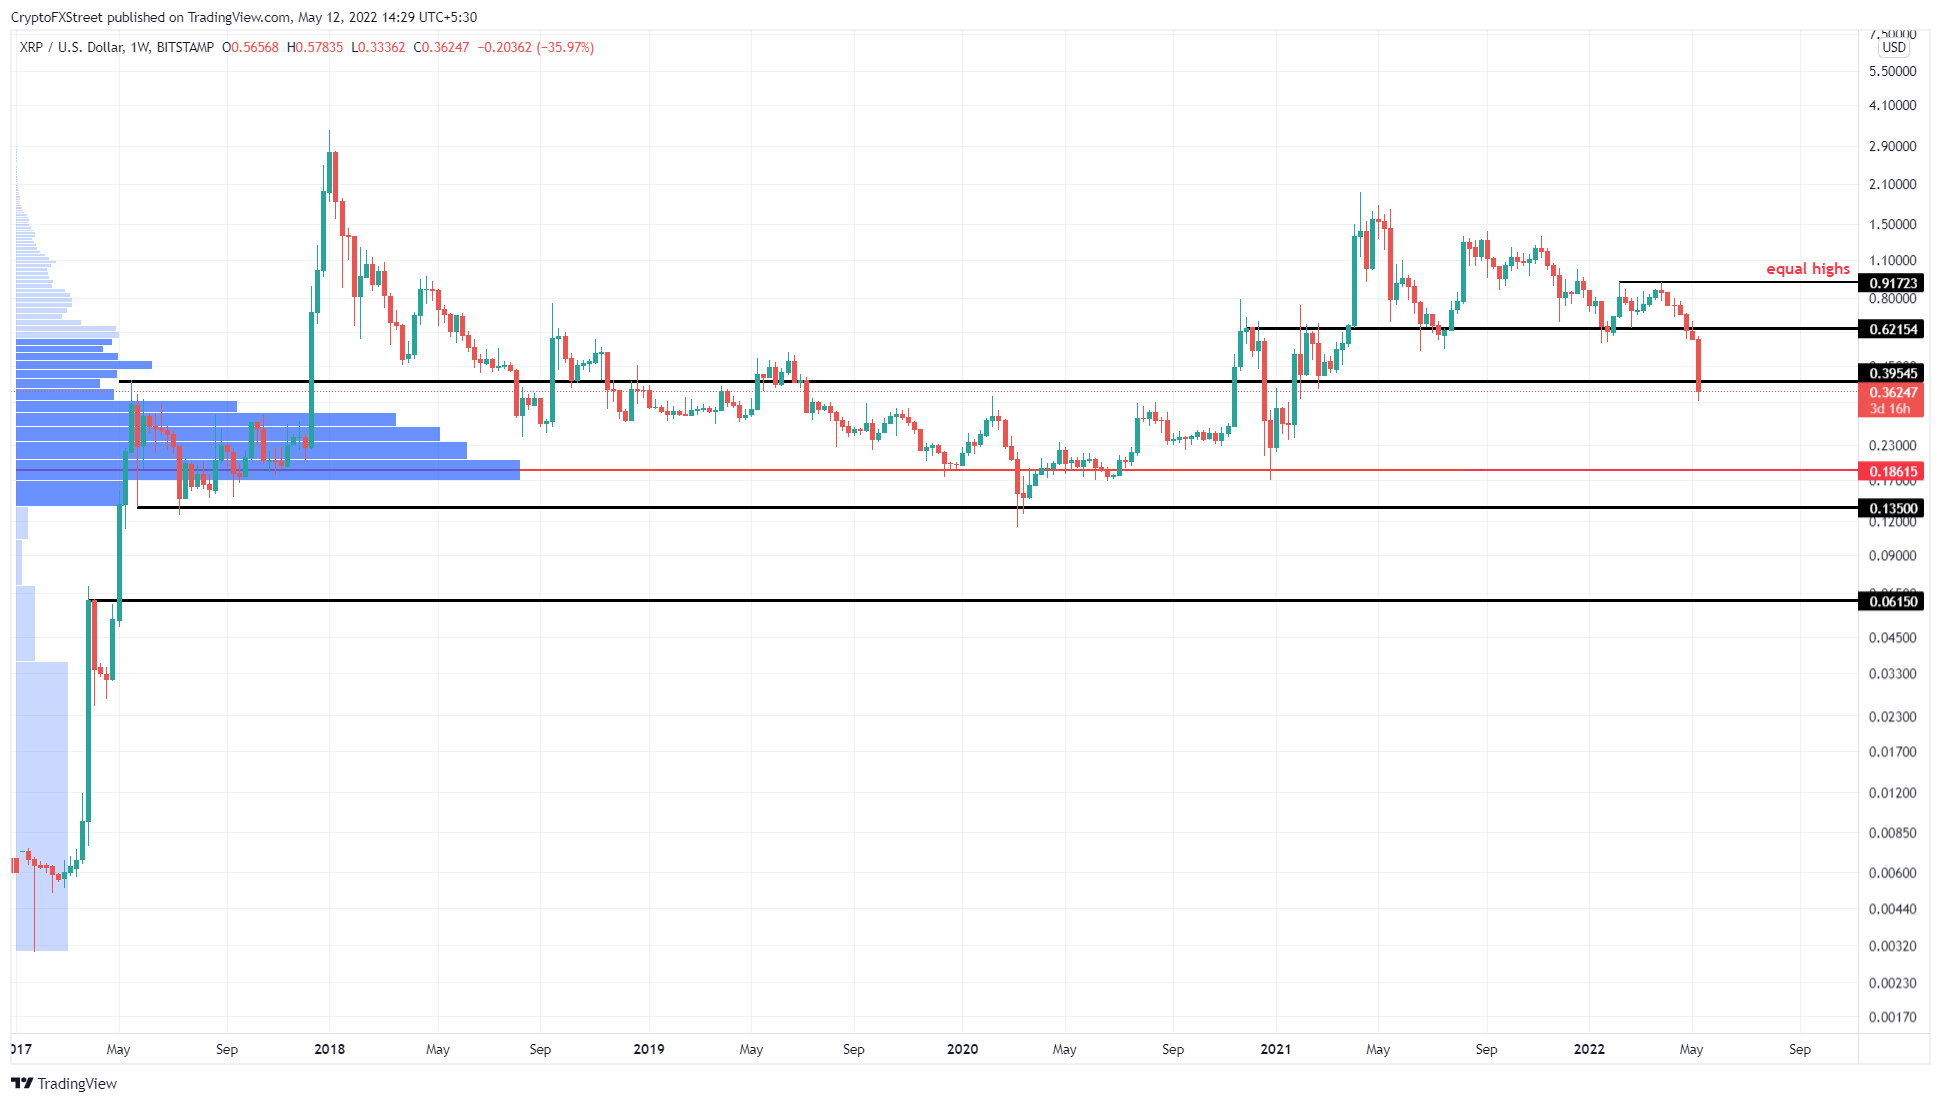
XRP/USD 1-week chart
Further representing the grim and oversold nature of XRP price is the 365-day Market Value to Realized Value (MVRV). This on-chain metric determines the average profit/loss of investors that purchased XRP over the past year. A negative value indicates that the market participants are at a loss and are less likely to sell, representing an opportunity to accumulate for long-term holders.
Historical data notes that the recent sell-off for XRP price puts the 365-day MVRV at -53%. These levels were last seen in October 2015, when Ripple was hovering around $0.0046.
This outlook represents the massively unprecedented sell-off and, from a long-term perspective, could be a good place to accumulate. Still, a further crash in Bitcoin price could completely annihilate the current support level and knock the remittance token down by 50%
 [09.17.05, 12 May, 2022]-637879429038260807.png)
XRP 365-day MVRV
It is worth noting that if the bulls manage to kick-start a recovery at $0.395, pushing Ripple toward $0.621, it may encourage sidelined investors to reenter the market. Under these conditions, buyers would have to push XRP price above the $0.621 barrier on a weekly chart to invalidate the bearish thesis. This development could propel the remittance token to sweep the $0.917 equal highs formed on February 7 and March 28.
Author

Akash Girimath
FXStreet
Akash Girimath is a Mechanical Engineer interested in the chaos of the financial markets. Trying to make sense of this convoluted yet fascinating space, he switched his engineering job to become a crypto reporter and analyst.


