- Uniswap has launched a $2.35 million prize pool for researchers to audit its upcoming v4 codebase.
- Uniswap v4 will introduce several new features, including on-chain limit orders and flash accounting.
- UNI's price may have bottomed, with 77% of coins held at a loss.
Uniswap (UNI) is down more than 4% on Thursday following the launch of a $2.35 million prize pool for researchers to audit its latest v4 codebase.
Uniswap launches prize pool for v4 audit
Uniswap Labs announced that it is launching a $2.35 million prize pool to fund independent reviews for its upcoming Uniswap v4 upgrade. In what it called "the largest security competition in DeFi history," Uniswap Labs said it aims to make "v4 the most audited code ever deployed on-chain."
The event, supported by non-profit Uniswap Labs and security firm Cantina, will run from September 4 - 30.
The pioneering AMM decentralized exchange will see new features in the upcoming v4, including:
- Customizable hooks that allow on-chain limit orders, custom oracles and dynamic automated-market maker (AMM).
- Gas fee reduction through the singleton contract that consolidates all liquidity pools into a single smart contract.
- Flash accounting for combining multiple actions within a single transaction.
- Native ETH support as opposed to WETH
Despite the newer features in v4, Uniswap has faced criticism due to its plans to release the upgrade under the Business Source License 1.1, which restricts its codebase from being used for commercial purposes for up to four years. Many see this as a deviation from the open-source ethos of web3.
IntoTheBlock's Global In/Out of the Money, which measures the percentage of coins or addresses in profits, shows that only 22% of UNI coins are profitable. 77% of coins are out of the money, with the highest accumulation zone being around the $9 to $15.7 range.
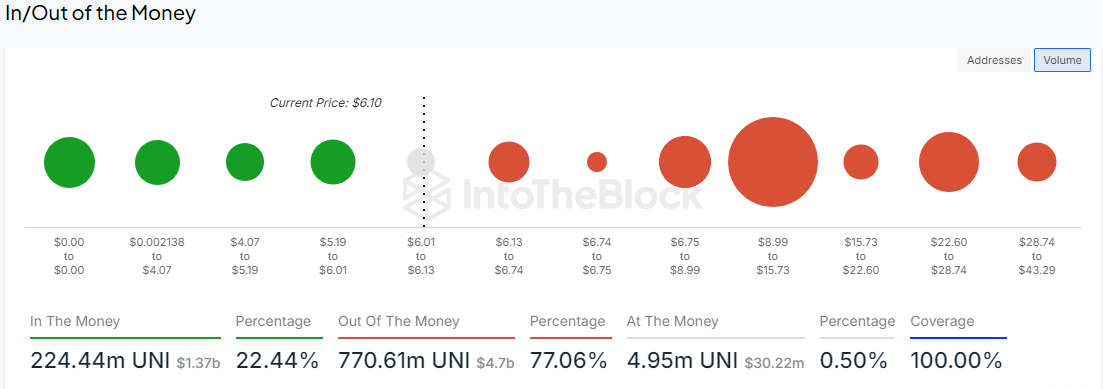
UNI Global In/Out of the Money
When a large percentage of coins are held at a loss, it often indicates that prices may have bottomed and could see a reversal.
Meanwhile, UNI is in a downtrend on the 4-hour chart after the market crash on August 5, which saw its price record lows last seen in November 2023. The 200-day moving average has served as resistance since July and could resist a further attempt to rise.
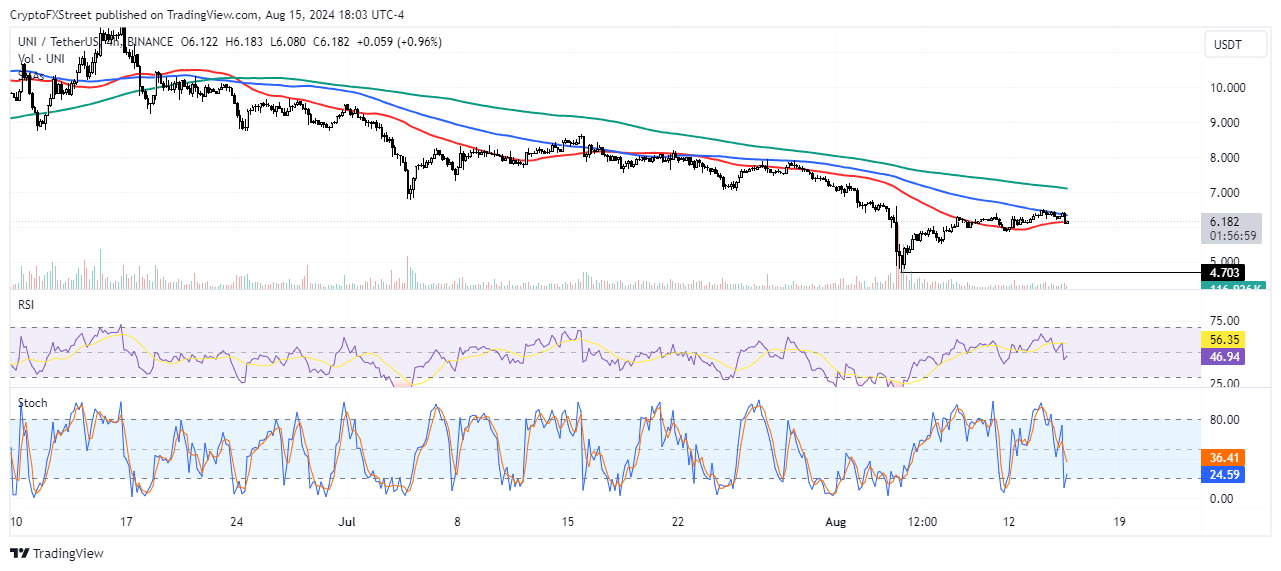
UNI/USDT 4-hour chart
On the downside, UNI could see a massive correction if it breaches the $4.703 support formed on August 5.
Information on these pages contains forward-looking statements that involve risks and uncertainties. Markets and instruments profiled on this page are for informational purposes only and should not in any way come across as a recommendation to buy or sell in these assets. You should do your own thorough research before making any investment decisions. FXStreet does not in any way guarantee that this information is free from mistakes, errors, or material misstatements. It also does not guarantee that this information is of a timely nature. Investing in Open Markets involves a great deal of risk, including the loss of all or a portion of your investment, as well as emotional distress. All risks, losses and costs associated with investing, including total loss of principal, are your responsibility. The views and opinions expressed in this article are those of the authors and do not necessarily reflect the official policy or position of FXStreet nor its advertisers. The author will not be held responsible for information that is found at the end of links posted on this page.
If not otherwise explicitly mentioned in the body of the article, at the time of writing, the author has no position in any stock mentioned in this article and no business relationship with any company mentioned. The author has not received compensation for writing this article, other than from FXStreet.
FXStreet and the author do not provide personalized recommendations. The author makes no representations as to the accuracy, completeness, or suitability of this information. FXStreet and the author will not be liable for any errors, omissions or any losses, injuries or damages arising from this information and its display or use. Errors and omissions excepted.
The author and FXStreet are not registered investment advisors and nothing in this article is intended to be investment advice.
Recommended Content
Editors’ Picks

Solana plunges as ETF speculators bet billions on XRP and DOGE
Solana (SOL) price tumbles as low as $180 on Monday, down over 9% in three consecutive days of losses. Bearish dominance in the SOL derivatives markets suggests the downtrend could extend in the week ahead.

Shiba Inu Price Analysis: SHIB whale demand declines 88% amid two-week consolidation phase
Shiba Inu (SHIB) price opened trading around the $0.000016 mark on Monday, having consolidated within a 5% tight range over the last two weeks.

Solana-based meme coin LIBRA controversy heats up, Argentina President hit by lawsuit
Argentina’s President Javier Milei faces charges of fraud for the promotion of LIBRA meme coin on the Solana blockchain. An on-chain intelligence tracker links LIBRA meme coin to MELANIA and claims that the creator extracted $100 million from the former.

Bitcoin Price Forecast: BTC stalemate soon coming to an end
Bitcoin price has been consolidating between $94,000 and $100,000 for almost two weeks. US Bitcoin spot ETF data recorded a total net outflow of $580.2 million last week.

Bitcoin: BTC consolidates before a big move
Bitcoin price has been consolidating between $94,000 and $100,000 for the last ten days. US Bitcoin spot ETF data recorded a total net outflow of $650.80 million until Thursday.

The Best Brokers of the Year
SPONSORED Explore top-quality choices worldwide and locally. Compare key features like spreads, leverage, and platforms. Find the right broker for your needs, whether trading CFDs, Forex pairs like EUR/USD, or commodities like Gold.