Uniswap Price Prediction: UNI seems to be on the verge of a 20% breakout
- Uniswap's price is bounded inside a symmetrical triangle on the hourly chart.
- The digital asset is facing a potential breakout or breakdown of 20%.

Uniswap is down 11% in the past 24 hours, currently trading at $2.61, right above the lower trendline of the symmetrical triangle formed on the hourly chart. A breakout or breakdown will likely represent a 20% move in either direction.
Uniswap bulls need to defend critical support level to avoid a 20% pullback
The lower trendline of the symmetrical triangle at $2.6 is the most crucial support level in the short-term. A breakdown below this point can easily drive the price of Uniswap towards $2.13. The 200-SMA could act as a support level in-between at $2.36.
-637405318034687828.png)
UNI/USD 1-hour chart
The In/Out of the Money Around Price (IOMAP) chart paints a similar picture as it shows a strong support level at $2.59 and a significant resistance area between $2.83 and $2.90. If bulls can defend the lower trendline at $2.6, the price of UNI could easily jump towards the upper trendline at $2.8.
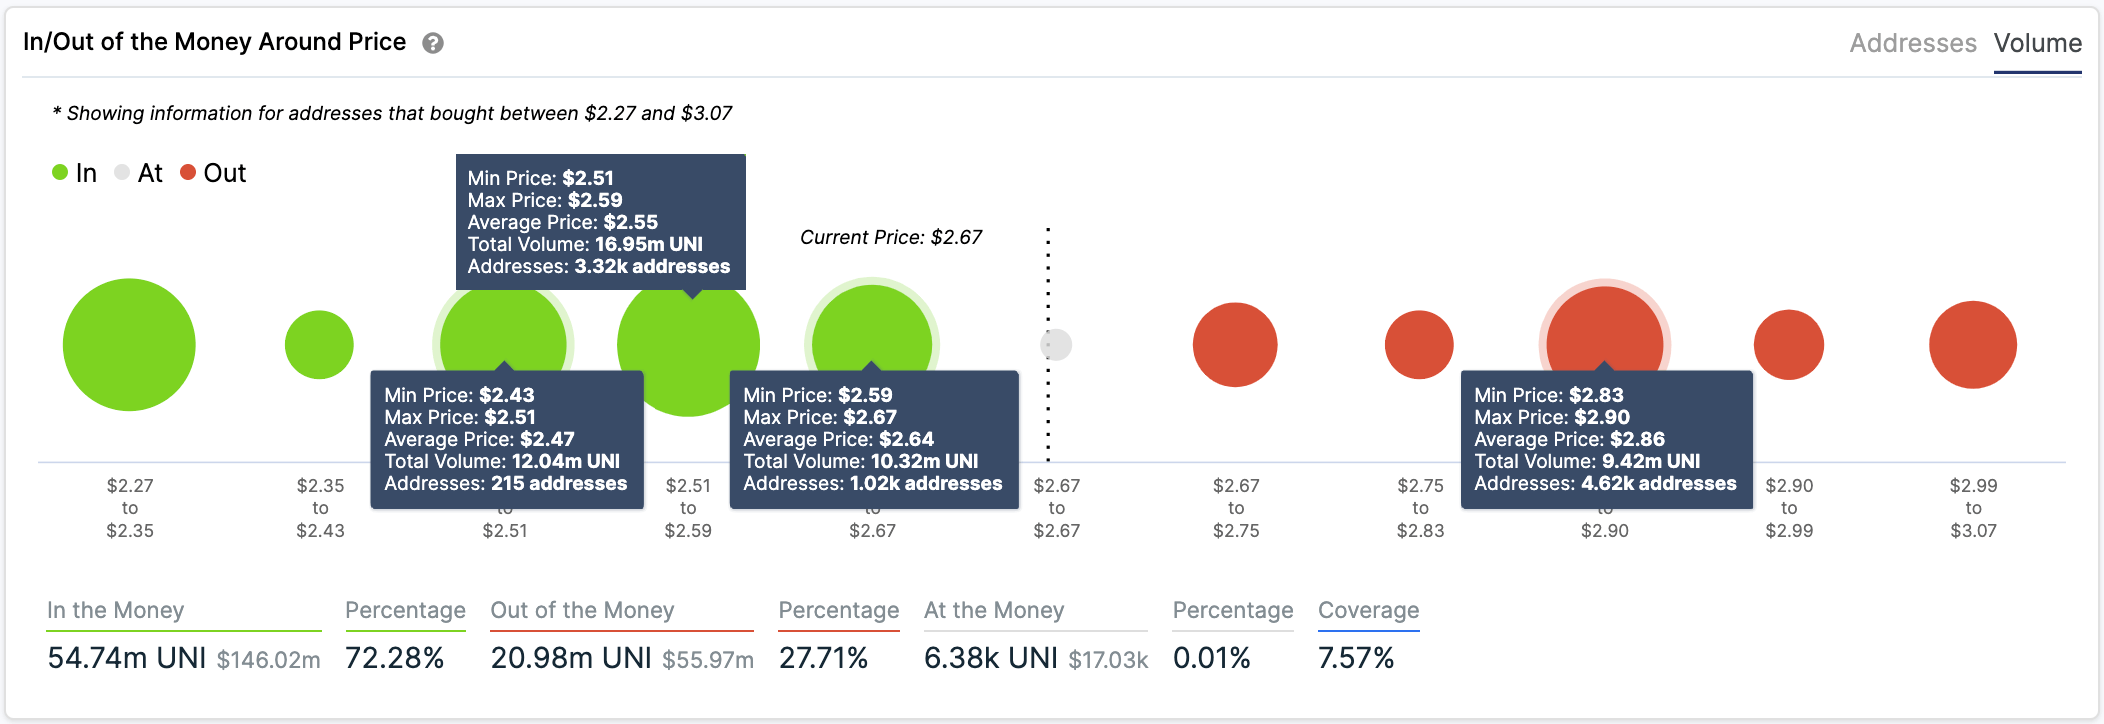
UNI IOMAP chart
Considering the bullish momentum of the market, UNI could crack the $2.8 resistance level and see a notable 20% breakout towards $3.4 as the IOMAP shows very little resistance above the $2.83 - $2.9 area.
Author

Lorenzo Stroe
Independent Analyst
Lorenzo is an experienced Technical Analyst and Content Writer who has been working in the cryptocurrency industry since 2012. He also has a passion for trading.


