|

Tron price must defend this critical support level to avoid a 26% fall

  • Tron price is bounded inside a descending triangle pattern on the 4-hour chart.
  • Trading volume has declined and indicates a potential price move is underway.

TRX is trading inside a descending triangle pattern at $0.0277 at the time of writing. The price is just above the lower trendline support level on the verge of a potential breakdown. Bulls need to make sure this level is defended to avoid a major pullback.

Tron price faces a potential breakdown towards $0.02

On the 4-hour chart, TRX has established a descending triangle pattern, which is close to a breakout or breakdown. Currently, the Tron price is only slightly above the lower support trendline at $0.0274. 

trx price

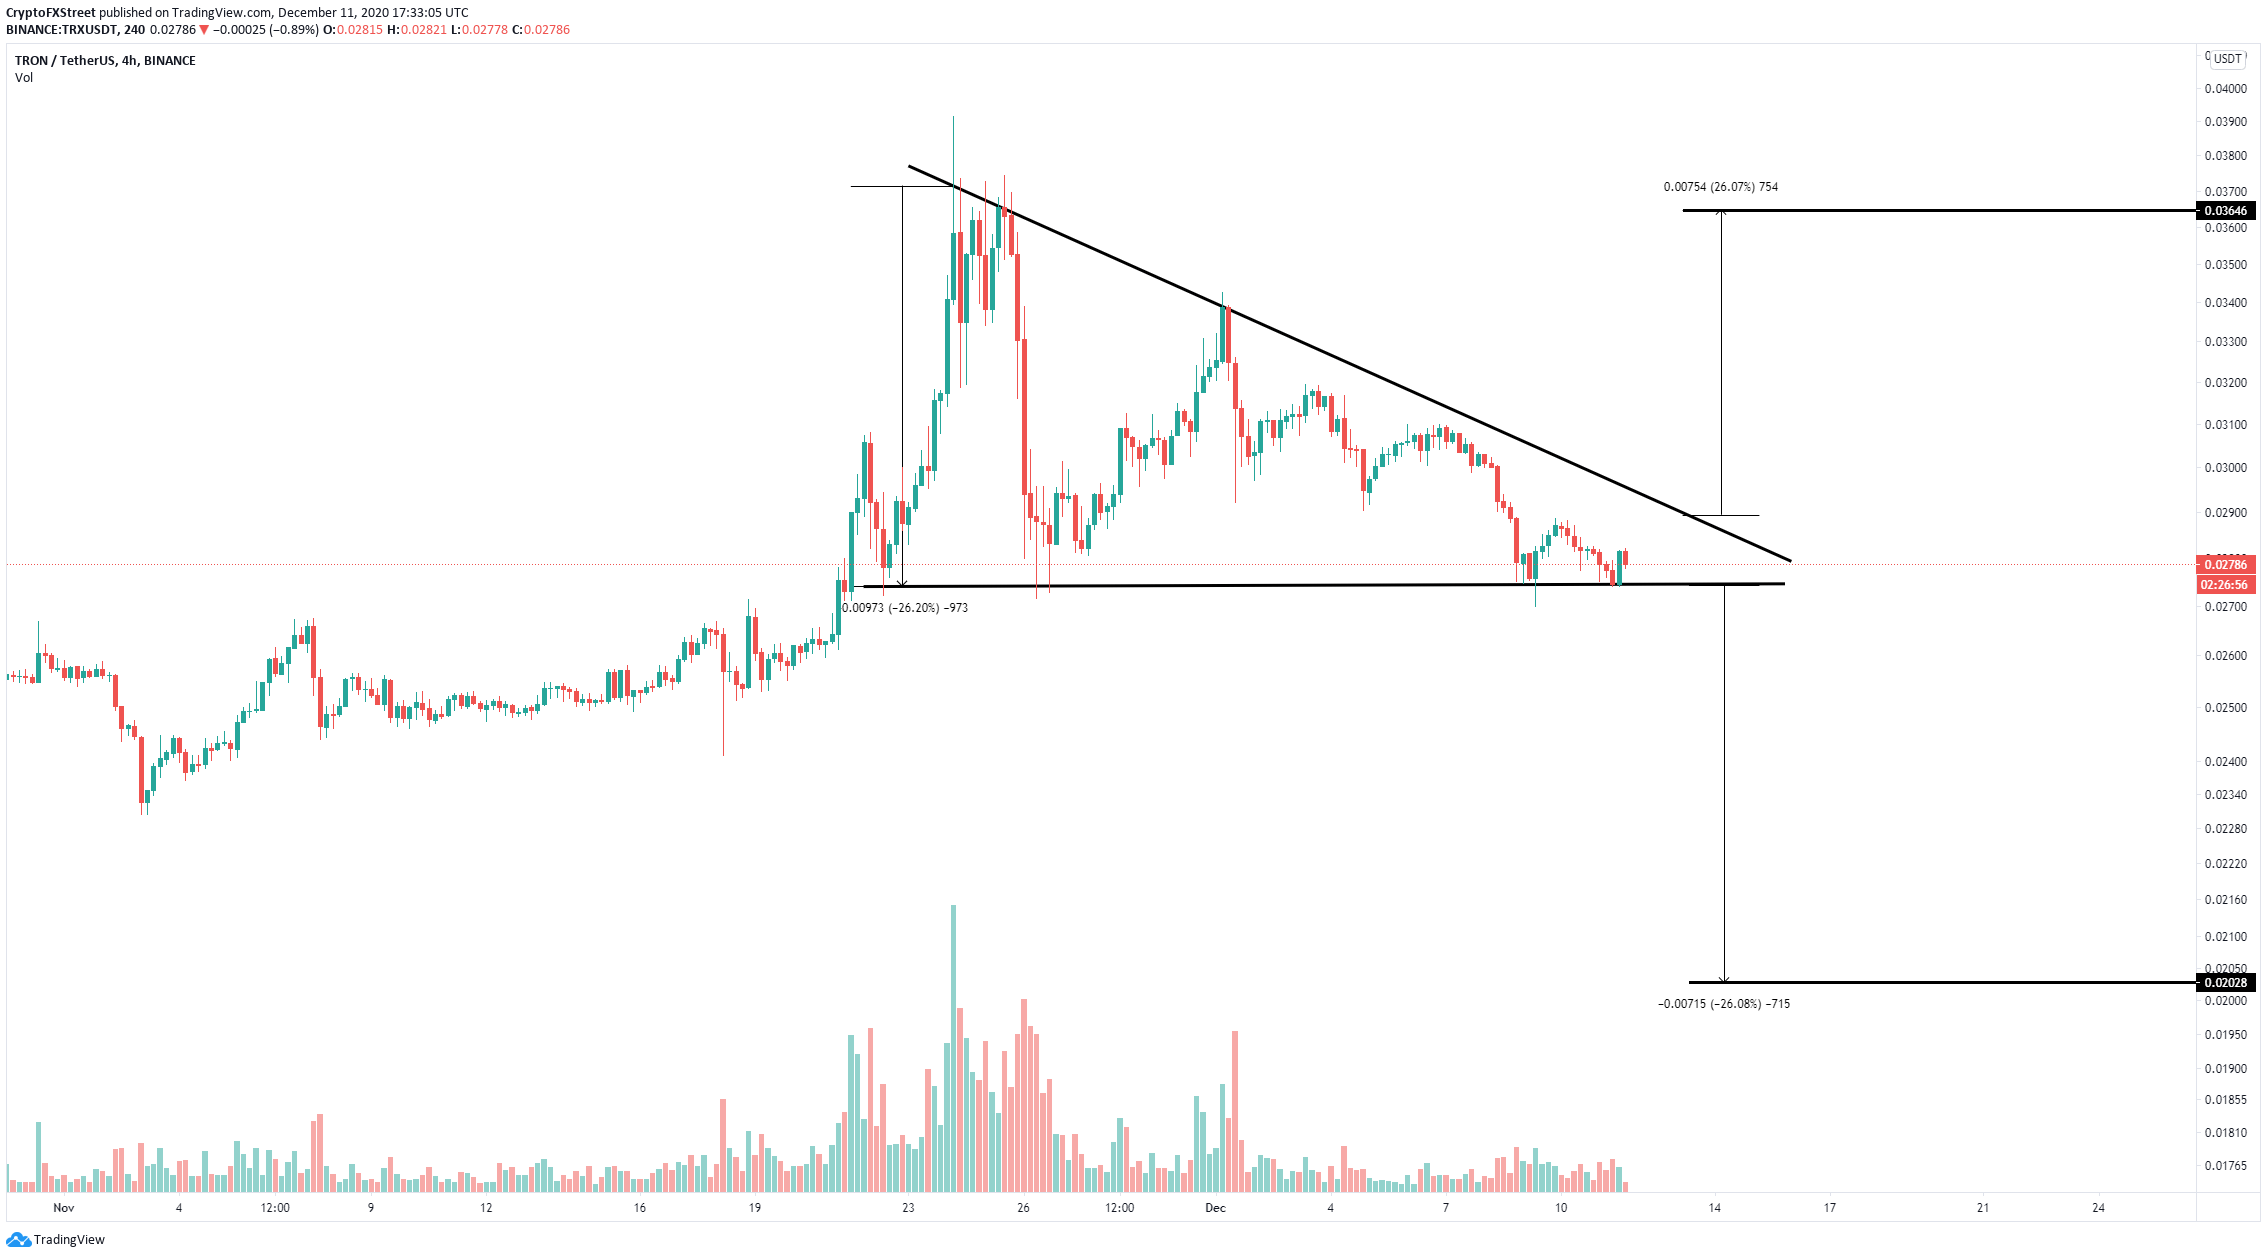
TRX/USD 4-hour chart

Failure to hold TRX above this critical support level could push the digital asset towards a price target of $0.02, a 26% move that can be calculated using the height of the pattern as a reference point. 

trx price

TRX Volume chart

At the same time, it seems that the trading volume of TRX has declined significantly since a massive spike on September 4. The digital asset had another jump on November 24, which only lasted 24 hours. The current volume is at its lowest point since August 25 and indicates Tron price is on the verge of a breakout or breakdown.

Of course, if the bulls can successfully defend the support level at $0.0274 and push the Tron price above the upper trendline resistance of the pattern at $0.029, the digital asset might quickly jump towards $0.036.

Author

Lorenzo Stroe

Lorenzo Stroe

Independent Analyst

Lorenzo is an experienced Technical Analyst and Content Writer who has been working in the cryptocurrency industry since 2012. He also has a passion for trading.

More from Lorenzo Stroe
Share:

Markets move fast. We move first.

Orange Juice Newsletter brings you expert driven insights - not headlines. Every day on your inbox.

By subscribing you agree to our Terms and conditions.

Editor's Picks

Crypto Today: Bitcoin, Ethereum, XRP slide further as risk-off sentiment deepens

Bitcoin faces extended pressure as institutional investors reduce their risk exposure. Ethereum’s upside capped at $3,000, weighed down by ETF outflows and bearish signals. XRP slides toward November’s support at $1.82 despite mild ETF inflows.

Ripple eyes record high breakout in 2026 as Ripple scales infrastructure

XRP has traded under pressure, but short-term support keeps hopes of a sustainable recovery in 2026 alive. The launch of XRP ETFs and regulatory clarity in the US pave the way for institutional adoption.

Bitcoin risks deeper correction as ETF outflows mount, derivative traders stay on the sidelines

Bitcoin (BTC) remains under pressure, trading below $87,000 on Wednesday, nearing a key support level. A decisive daily close below this zone could open the door to a deeper correction.

Monero builds momentum amid bullish bets and looming resistance

Monero (XMR) trades close to $430 at press time on Wednesday, after a 5% jump on the previous day. The privacy coin regains retail interest, evidenced by heightened Open Interest and long positions.

Orange Juice Newsletter – Smart insights by real people. Every day.

A free newsletter highlighting key market trends to help traders stay a step ahead. Daily insights on the most relevant trading topics, compiled by our experts in an easy-to-read format so you never miss an important move.

Bitcoin: Fed delivers, yet fails to impress BTC traders

Bitcoin (BTC) continues de trade within the recent consolidation phase, hovering around $92,000 at the time of writing on Friday, as investors digest the Federal Reserve’s (Fed) cautious December rate cut and its implications for risk assets.