Tron, Avalanche and Uniswap Price Forecast: Double-digit gains on the cards, technical indicators show
- Tron is breaking above an ascending triangle formation; a firm close could spark a continuation of the recent rally.
- Avalanche price is nearing its key support level; if support holds, it would suggest a rally on the horizon.
- Uniswap breaks and closes above a bullish pattern, suggesting an upside move.

Tron (TRX) is breaking above an ascending triangle formation on Tuesday, signaling a potential rally continuation. While AVAX and UNI are retesting their crucial support level — if supported, this suggests an upside move — all three altcoins look poised for double-digit gains as the crypto rally continues.
Tron price is poised for a rally if it breaks above its ascending triangle pattern
Tron price is breaking above an ascending triangle pattern breakout level of around $0.170 in the daily chart and reaches a new all-time high (ATH) of $0.185 on Tuesday. This technical pattern was created by drawing two trendlines from the end of August and the breakout favors the bulls. The target is generally obtained by measuring the distance between the first high and the first low to the breakout point.
Suppose TRX closes above the breakout level of around $0.170. Tron could extend the rally to retest its technical target at $0.192, forming a new all-time high.
The Relative Strength Index (RSI) on the daily chart reads 69, nearing its overbought level of 70. Traders should be cautious as the chances of pullback increase if the RSI falls or rejects from its overbought threshold. Another possibility is that the rally continues, and the RSI remains above the overbought conditions.
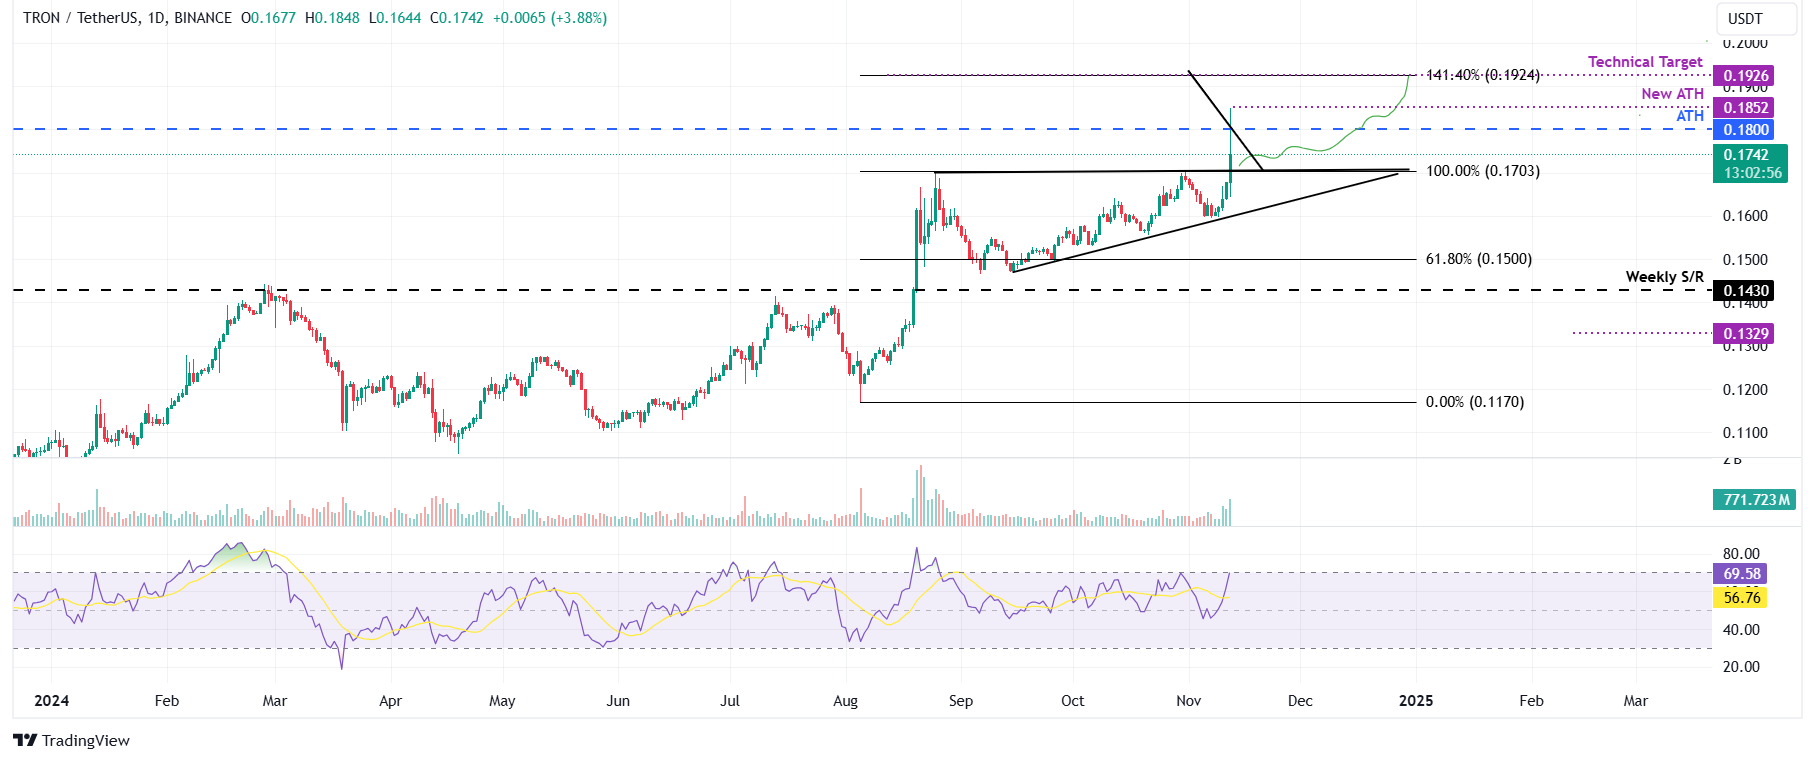
TRX/USDT daily chart
Avalanche price looks promising
Avalanche price found support around its ascending trendline (drawn by joining multiple lows since early August) on November 4 and rallied 57% in a week. It closed above its daily resistance level of $32.66 on Monday. At the time of writing on Tuesday, it trades down around $33.37.
If AVAX daily support level at $32.66 holds, it could extend its rally by 28% to a retest the May 22 high of $41.80. A successful daily close above that level could extend an additional rally by 13% to retest its 61.8% Fibonacci retracement (drawn from March’s high of $65.39 to August's low of $17.36) at $47.04.
The RSI stands at 66, pointing downward, after exiting overbought conditions. Traders should be cautious because the chances of a price pullback are increasing.
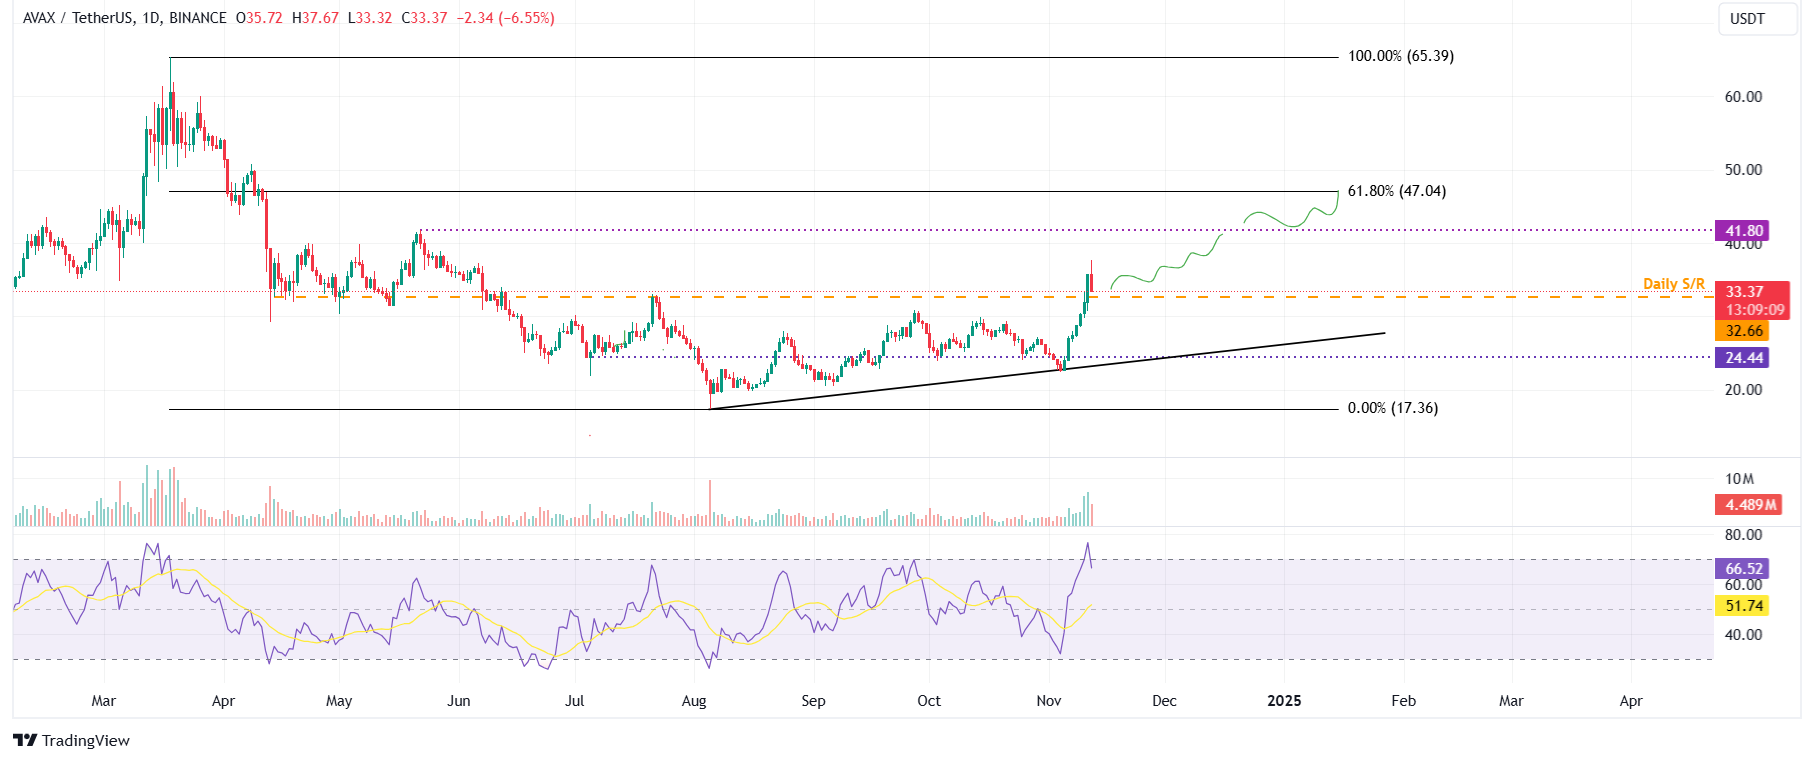
AVAX/USDT daily chart
Uniswap price shows potential after closing above the ascending triangle pattern
Uniswap price broke above an ascending triangle pattern (the same as Tron’s discussed above) on November 6 and successfully retested the breakout level at around $8.63 multiple times last week. As of Tuesday, it trades slightly down around $9.08.
If the breakout level of around $8.63 continues to hold as support, UNI could rally 45% from its breakout level to reach $12.52, the pattern’s technical target. Investors should be cautious of this theoretical move, as it could face a slowdown at Uniswap’s weekly resistance level of $12.01.
The RSI on the daily chart is currently at 61, above its neutral level of 50, indicating the bullish momentum is gaining traction.
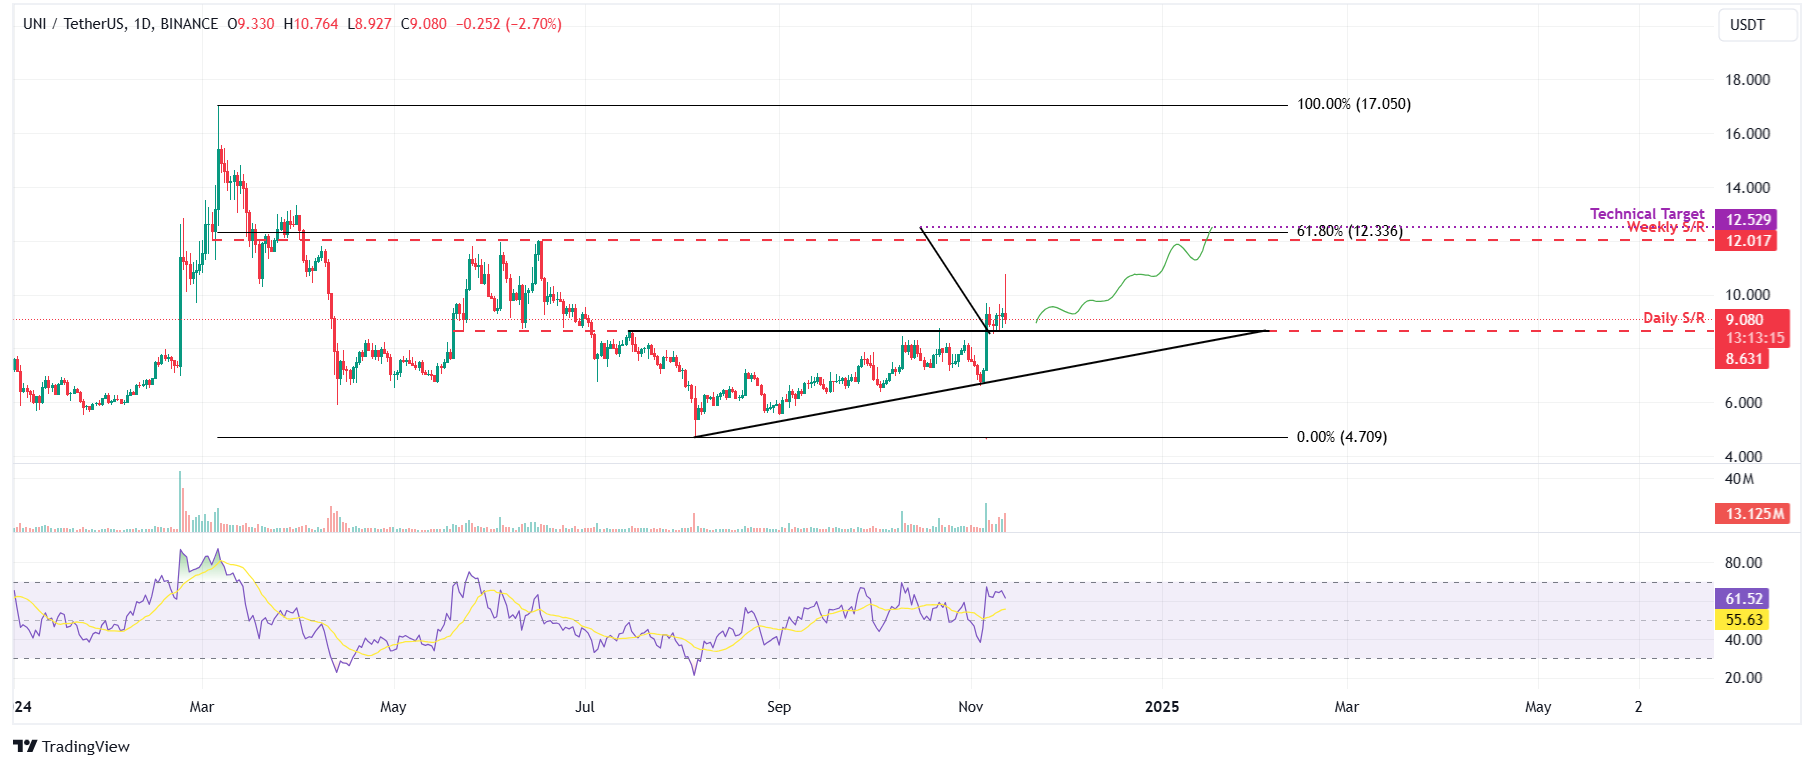
UNI/USDT daily chart
Author

Manish Chhetri
FXStreet
Manish Chhetri is a crypto specialist with over four years of experience in the cryptocurrency industry.


