Solana reaches new yearly high, eyes all-time record levels
- Solana hit a new yearly high of $224 on Monday, following a rally of almost 30% the previous week.
- The weekly chart shows the breakout of a bullish pattern; the technical target is a new all-time high of $276.
- SOL’s open interest hit a new all-time high on Tuesday, while its DEX trading volume reached its highest since mid-April.

Solana (SOL) trades slightly lower on Tuesday after reaching a new yearly high of $224 on Monday, driven by a nearly 30% rally the previous week. The technical outlook suggests a bullish breakout pattern and continuation of the rally, with a target set for a new all-time high of $276.
On-chain data further supports the bullish thesis as SOL’s open interest reached a new all-time high on Tuesday, signaling a surge of new capital, while its DEX trading volume reached its highest since mid-April.
Solana technical outlook projects a new all-time high
Solana’s weekly chart shows it has broken above the downward-sloping parallel channel pattern at around $210.18 and rallied over 29.25% last week. This pattern is formed by connecting multiple weekly highs and lows with two trendlines (from early March to October). A breakout of this pattern, confirmed by a weekly close above the breakout level, favors the bulls.
As of this week, it continues to rally, breaking above its previous yearly high and forming a new one at $224.
The pattern’s technical target (obtained by measuring the distance between the two trendlines and extrapolating it higher) projects a new ATH of $276.55.
The Relative Strength Index (RSI) momentum indicator on the weekly chart reads at 66, above its neutral level of 50 and still far below overbought conditions, suggesting bullish momentum is gaining traction.
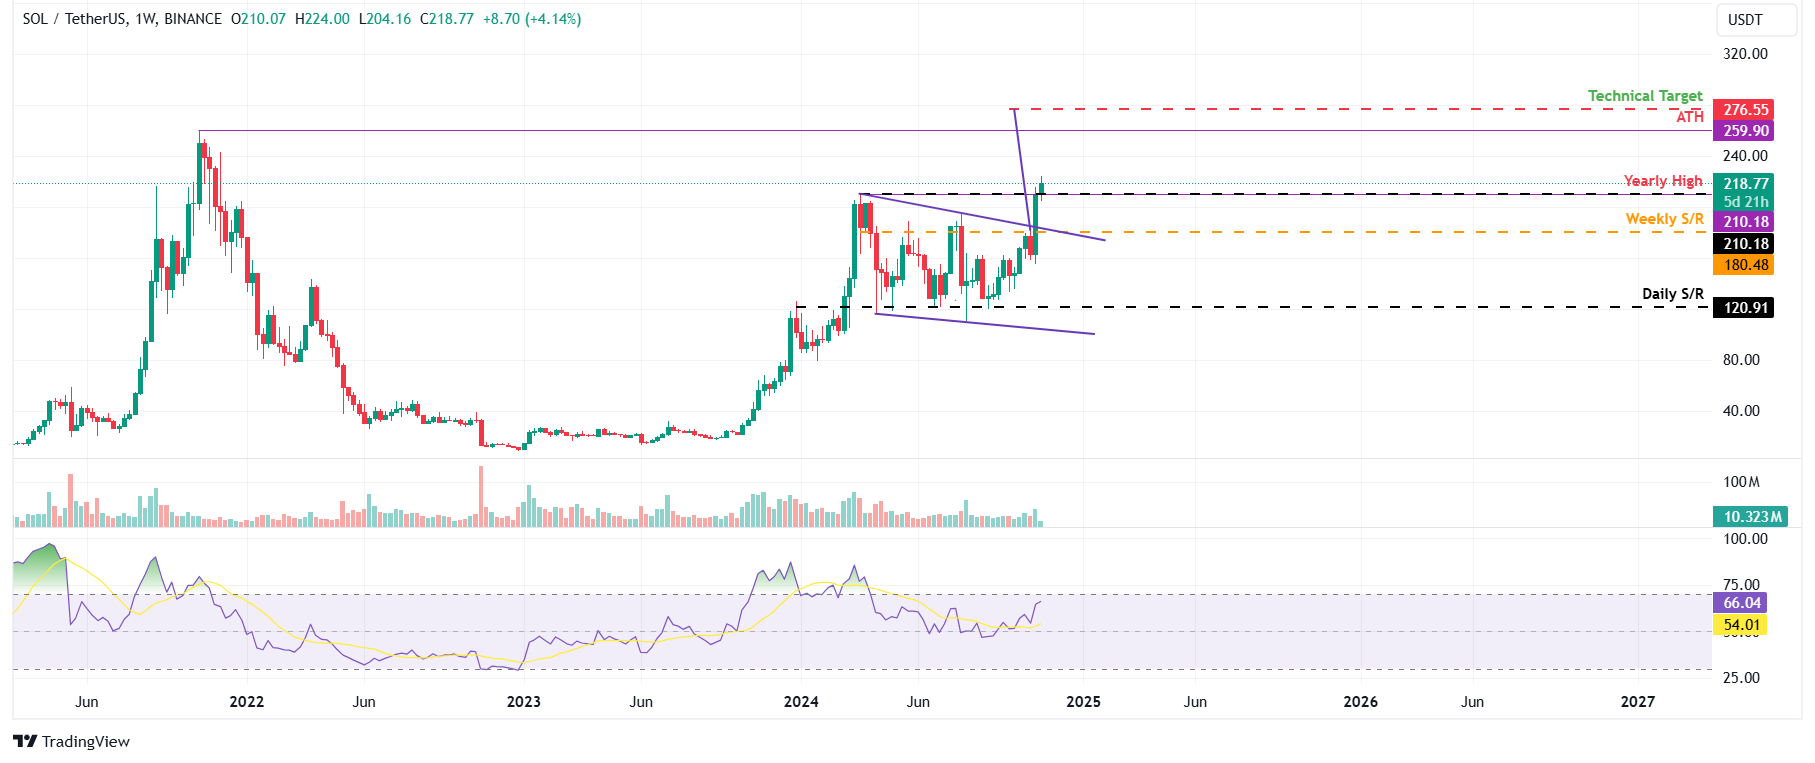
SOL/USDT weekly chart
Solana’s on-chain data further supports the bullish thesis. Coinglass’s data shows that the futures’ Open Interest (OI) in SOL at exchanges is increasing. Increasing OI represents new or additional money entering the market and new buying, which suggests a bullish trend.
The graph below shows that SOL’s OI rose from $2.88 billion on November 5 to $4.54 billion on Tuesday, a new all-time high.
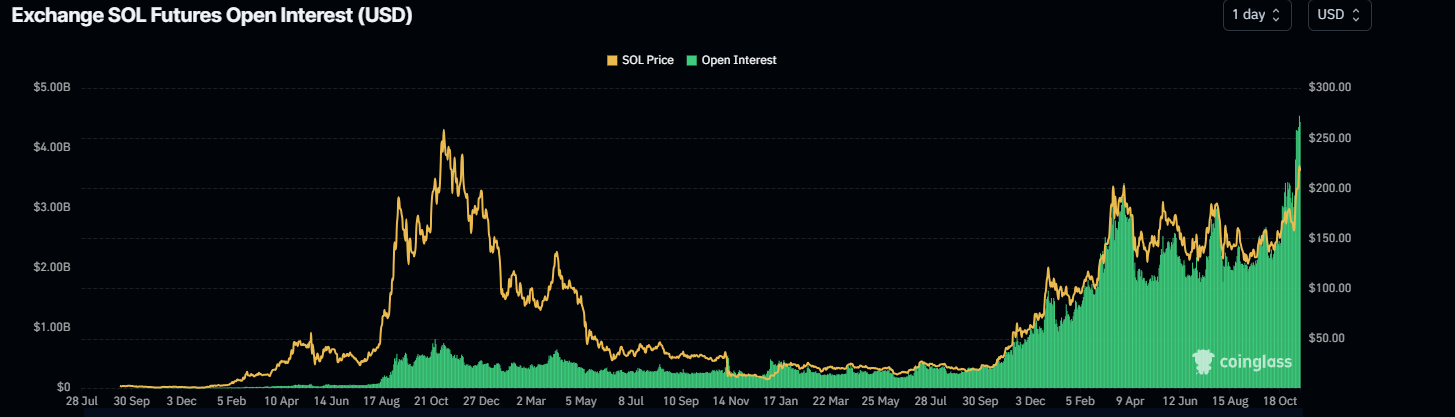
SOL Open Interest chart. Source: Coinglass
Another aspect bolstering the platform’s bullish outlook is a recent surge in traders’ interest and liquidity in the SOL chain. Artemis Terminal data shows that SOL Chain’s decentralized exchange (DEX) trading volume rose from $1.9 billion on Friday to $4.6 billion on Monday, the highest since mid-April.
-638669812549577286.jpg)
Solana DEX trading volume chart. Source: Artemis
Author

Manish Chhetri
FXStreet
Manish Chhetri is a crypto specialist with over four years of experience in the cryptocurrency industry.


