Top five cryptocurrencies to watch this week: BTC, MATIC, NEAR, ATOM, HNT

After staying above $50,000 on Christmas day, Bitcoin (BTC) faced selling pressure on Dec. 26. One of the reasons for the possible dip in Bitcoin’s price is the increase in inflows to the Binance exchange. Data analysis account Material Scientist said that Binance’s inflows could be due to “a new player.”
Although Bitcoin is almost certain to miss PlanB’s floor model price projection of $135,000 for December, the creator of the stock-to-flow price model remains bullish. He said that Bitcoin’s price at $51,000 remains within one standard deviation of the model, which keeps the forecast of $135,000 for this halving cycle in play.
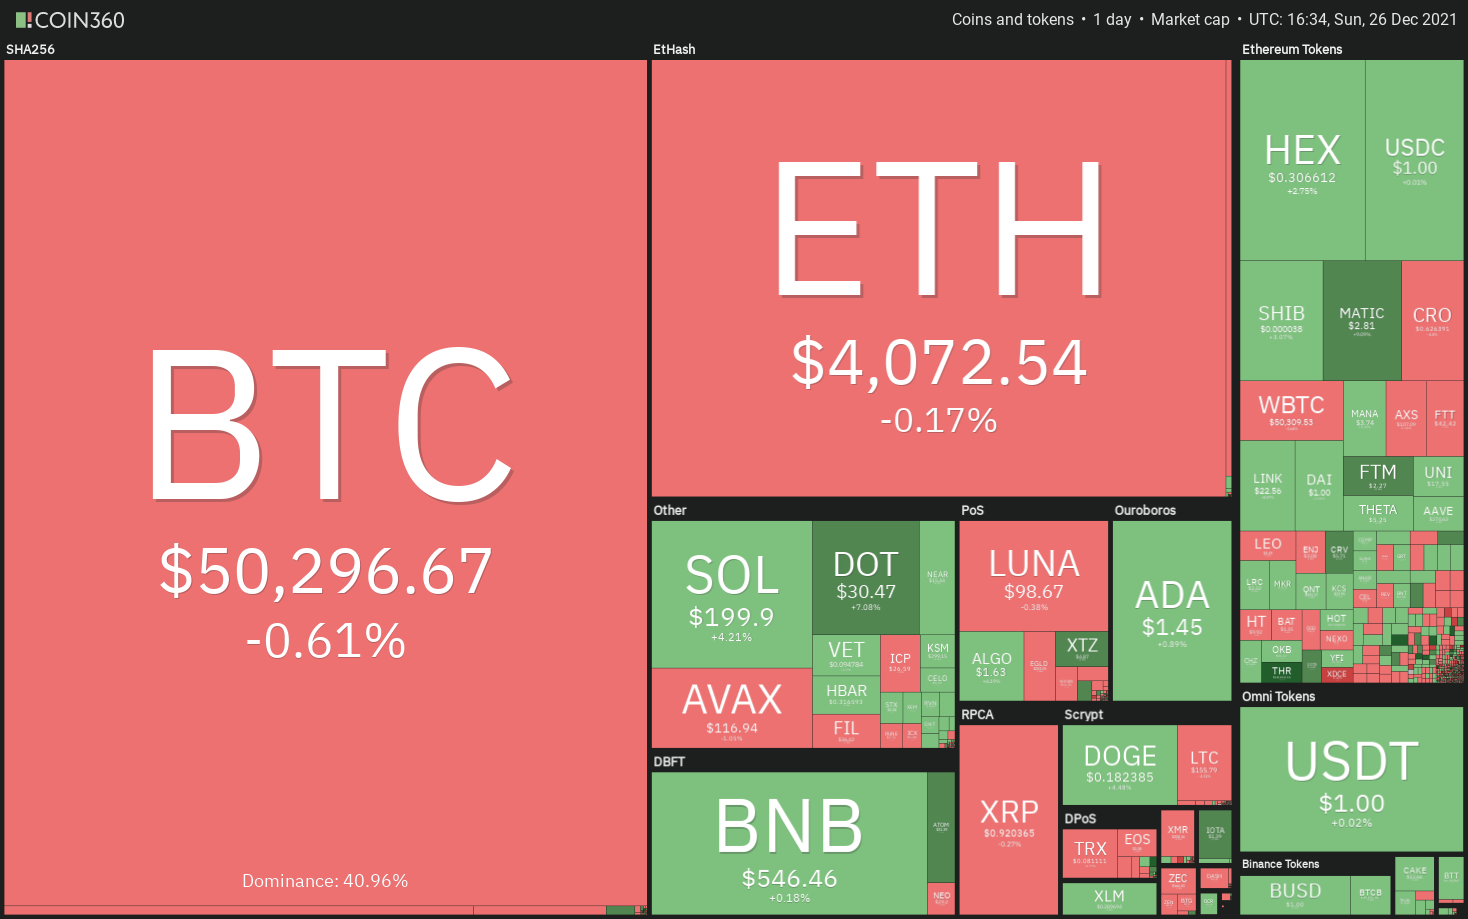
Crypto market data daily view. Source: Coin360
Several asset managers have added Bitcoin to their portfolio in 2021 but UK’s ex-Chancellor Lord Hammond warned retail investors to be “extremely cautious” while investing in cryptocurrencies. He said that “it’s almost certainly not suitable for retail investors as a mainstream investment category.”
Let’s study the charts of the top-5 cryptocurrencies that may lead the recovery in the crypto sector in the next few days.
BTC/USDT
Bitcoin broke above the 20-day exponential moving average ($49,832) on Dec. 23 but the recovery hit a roadblock at the 38.2% Fibonacci retracement level at $52,314. This indicates that bears have not yet given up and continue to sell on rallies.
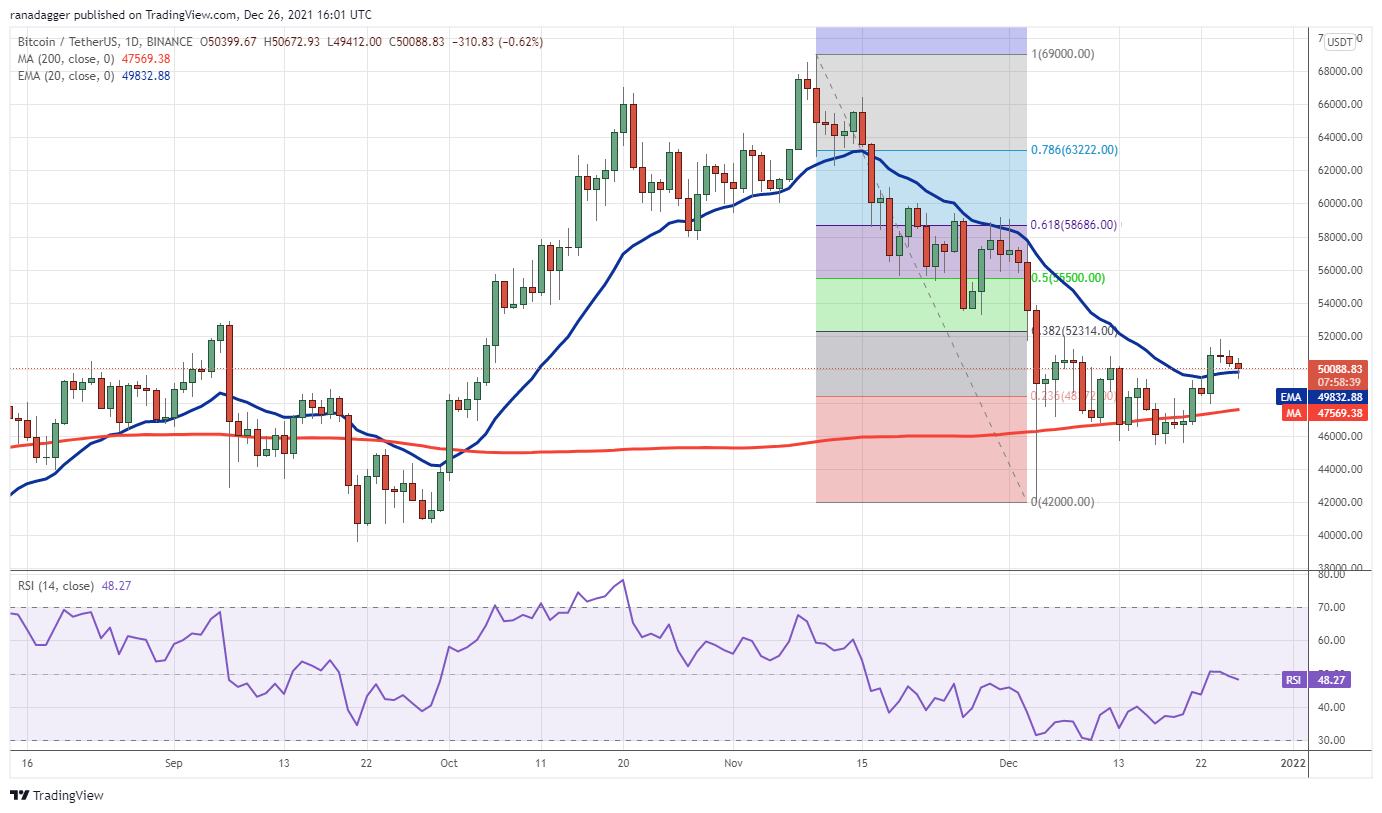
BTC/USDT daily chart. Source: TradingView
The BTC/USDT pair formed a Doji candlestick pattern on Dec. 24, indicating uncertainty among the bulls and the bears. This indecision resolved to the downside on Dec. 25 and the price has slipped to the 20-day EMA.
The relative strength index (RSI) is just below the midpoint and the 20-day EMA is flattish, indicating a balance between supply and demand.
If the price rebounds off the current level and breaks above $52,314, it will suggest that the sentiment has turned positive and traders are viewing the dips as a buying opportunity. The pair could then rise to the 50% retracement level at $55,500 and later to the 61.8% retracement level at $58,686.
Conversely, if bears pull the price below the 20-day EMA, the pair could drop to the 200-day simple moving average ($47,569) and then to $45,456. A break and close below this level could open the doors for a possible drop to $42,000.
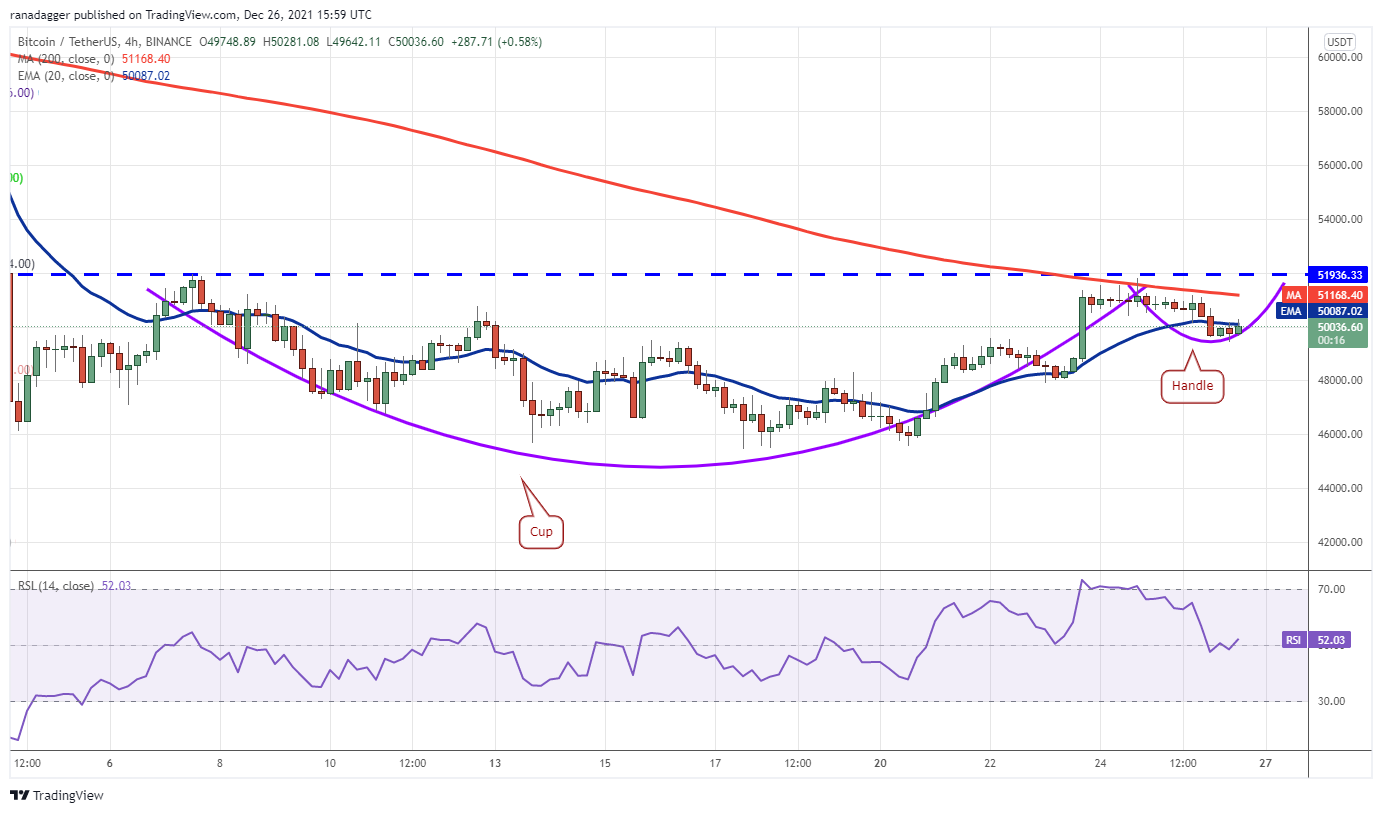
BTC/USDT 4-hour chart. Source: TradingView
The pair is attempting to form a cup and handle formation which will complete on a breakout and close above the overhead resistance at $51,936.33. This reversal setup has a target objective at $58,313.81.
This positive view will invalidate if the price turns down from the current level and breaks below $49,600. That could pull the price down to $47,920.42. If this support also cracks, the decline could extend to $45,558.85.
MATIC/USDT
Polygon (MATIC) has been in a strong uptrend. Although bears posed a stiff challenge at $2.70, the bulls did not give up much ground and have pushed the price to a new all-time high today.
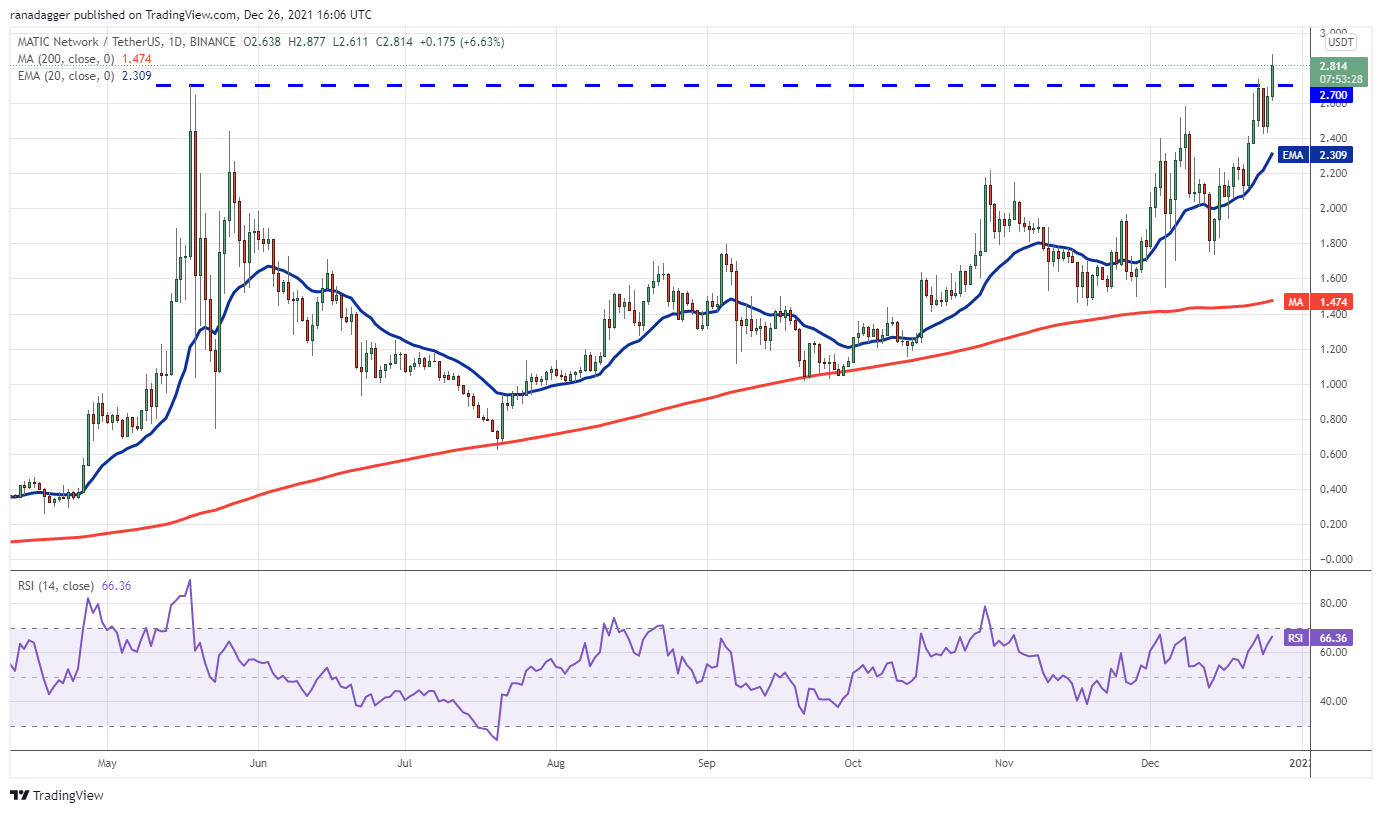
MATIC/USDT daily chart. Source: TradingView
If bulls sustain MATIC price above $2.70, the MATIC/USDT pair could start the next leg of the uptrend. The pair could first rise to $3.41 and if this level is crossed, the up-move may reach the psychological mark at $5.
The upsloping 20-day EMA ($2.30) and the RSI in the positive territory suggest that bulls are in control. If the price turns down and breaks below the 20-day EMA, it will suggest that the current breakout was a bull trap. The pair could then drop to $2 and later to $1.73.
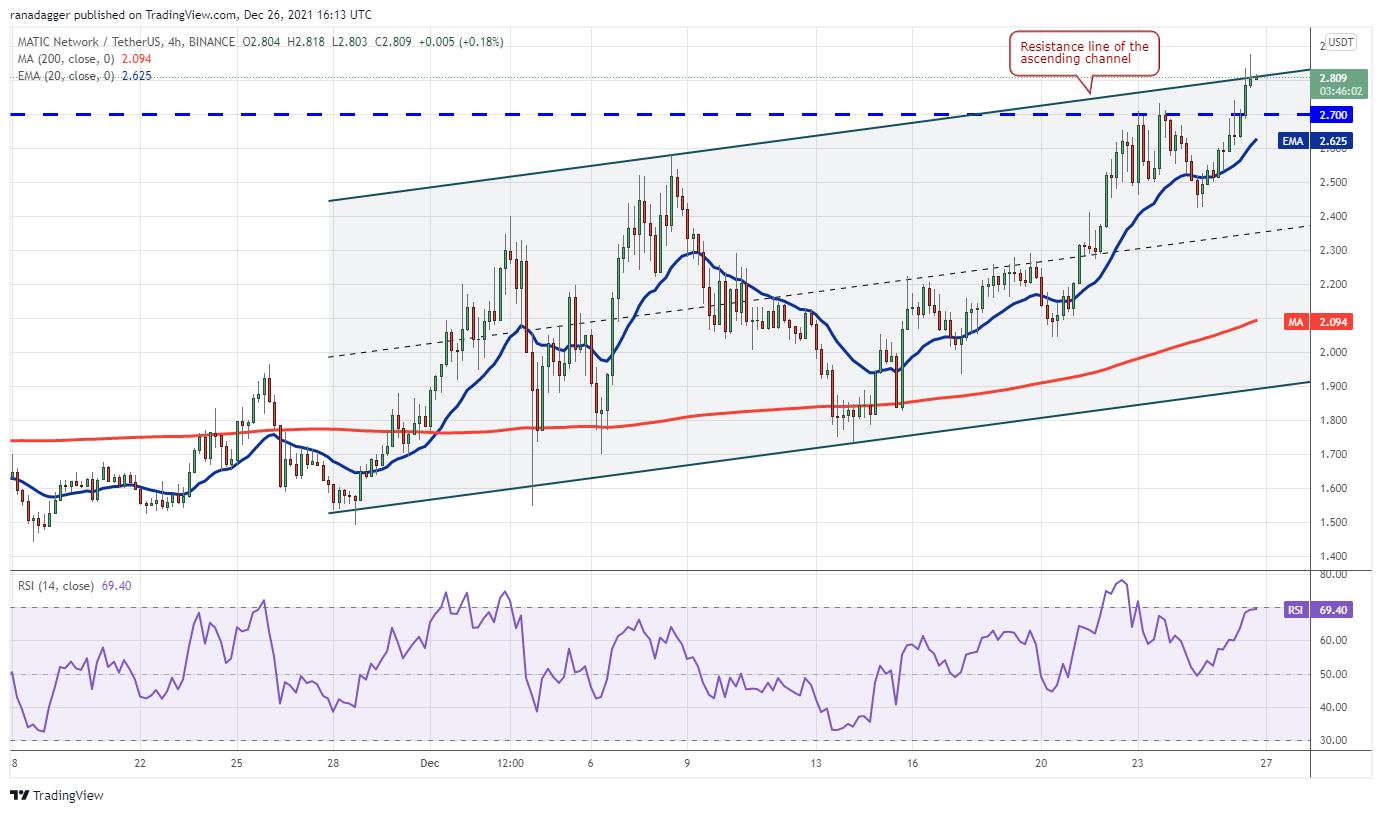
MATIC/USDT 4-hour chart. Source: TradingView
After struggling to break out and sustain above $2.70 on three occasions, the bulls have finally managed to overcome the resistance. However, the bears are unlikely to give up easily and will again try to stall the up-move at the resistance line of the ascending channel.
If the price turns down from the current level and breaks below the 20-EMA, the pair could drop to $2.42. This is an important support for the bulls to defend because if it cracks, the pair could plunge toward the 200-SMA.
On the contrary, if bulls drive and sustain the price above the channel, the bullish momentum could pick up further.
NEAR/USDT
NEAR Protocol’s NEAR token picked up momentum after breaking above the falling wedge pattern on Dec. 23. This carried the price above the strong resistance at $13.23, signaling the resumption of the uptrend.
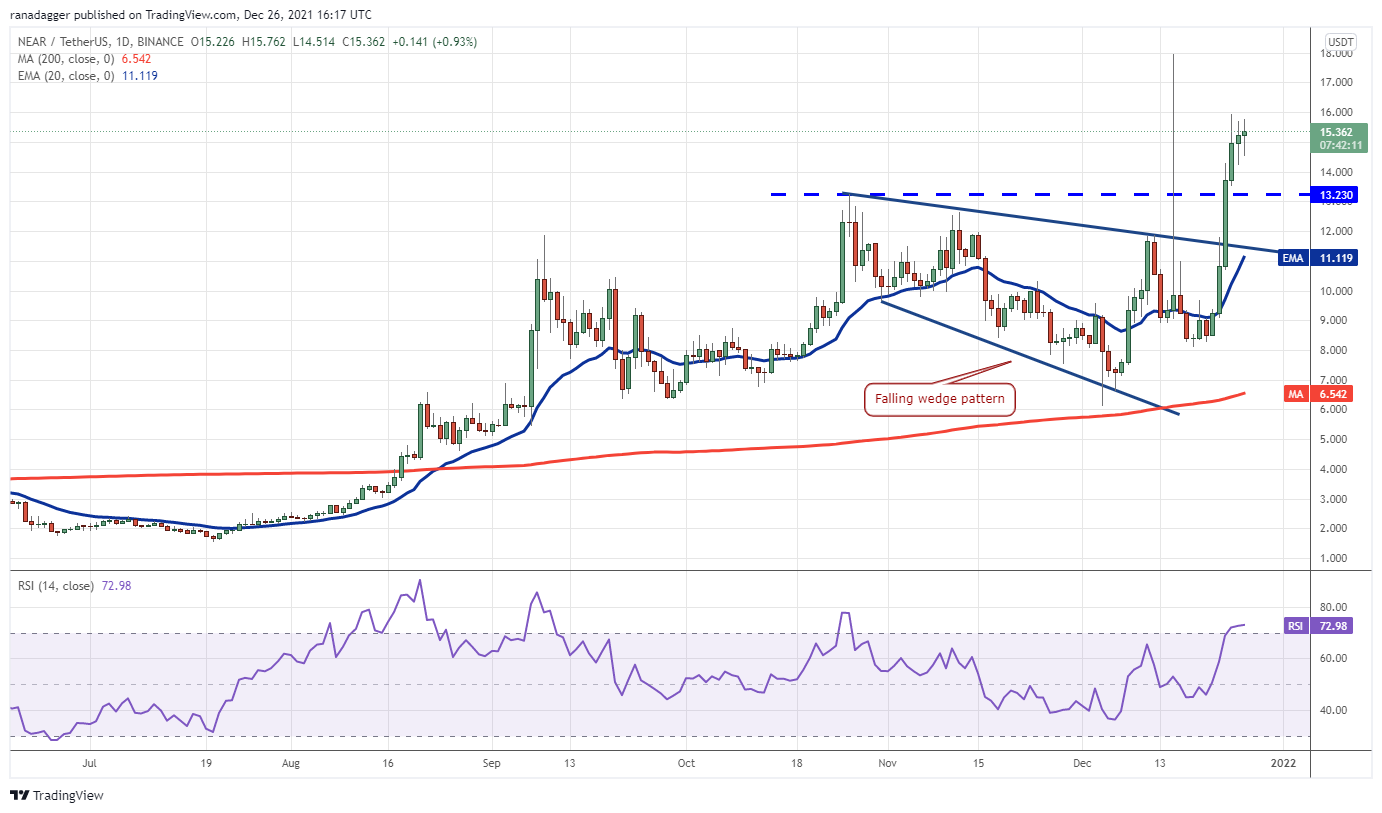
NEAR/USDT daily chart. Source: TradingView
The bears are unwilling to allow the bulls to have their way and are aggressively defending the $16 level. The NEAR/USDT pair formed an inside-day candlestick pattern on Dec. 25, indicating indecision among the bulls and the bears.
If the price breaks below $14, the pair could drop to $13.23 and then to the 20-day EMA ($11.11). A strong rebound off either level will suggest that the sentiment remains positive and traders are buying on dips.
If bulls drive the price above $15.93, the pair could rise to $17.95. This bullish view will be negated if bears sink and sustain the price below the 20-day EMA.
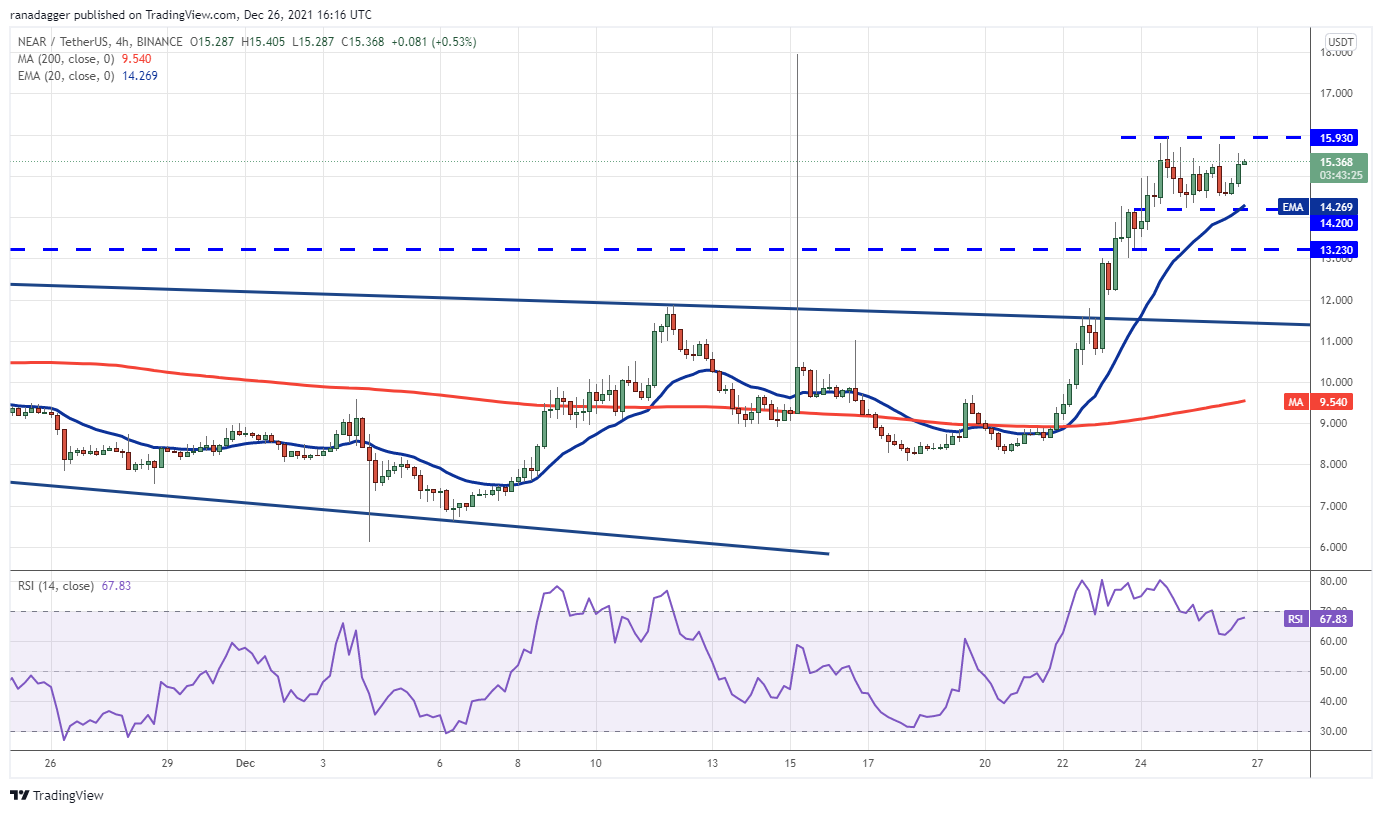
NEAR/USDT 4-hour chart. Source: TradingView
The 4-hour chart shows that the pair is consolidating between $14.20 and $15.93, which is a positive sign. The 20-EMA is sloping up and the RSI is in the positive zone, suggesting that bulls have the upper hand.
If buyers drive the price above $15.93, the pair could resume the uptrend. On the other hand, if the price breaks below the 20-EMA, the pair could drop to $13.23. This level is likely to act as strong support but if it cracks, the next stop could be $11.50.
ATOM/USDT
Cosmos (ATOM) broke out and closed above the resistance line of the descending channel on Dec. 25, indicating that the downtrend may be over.
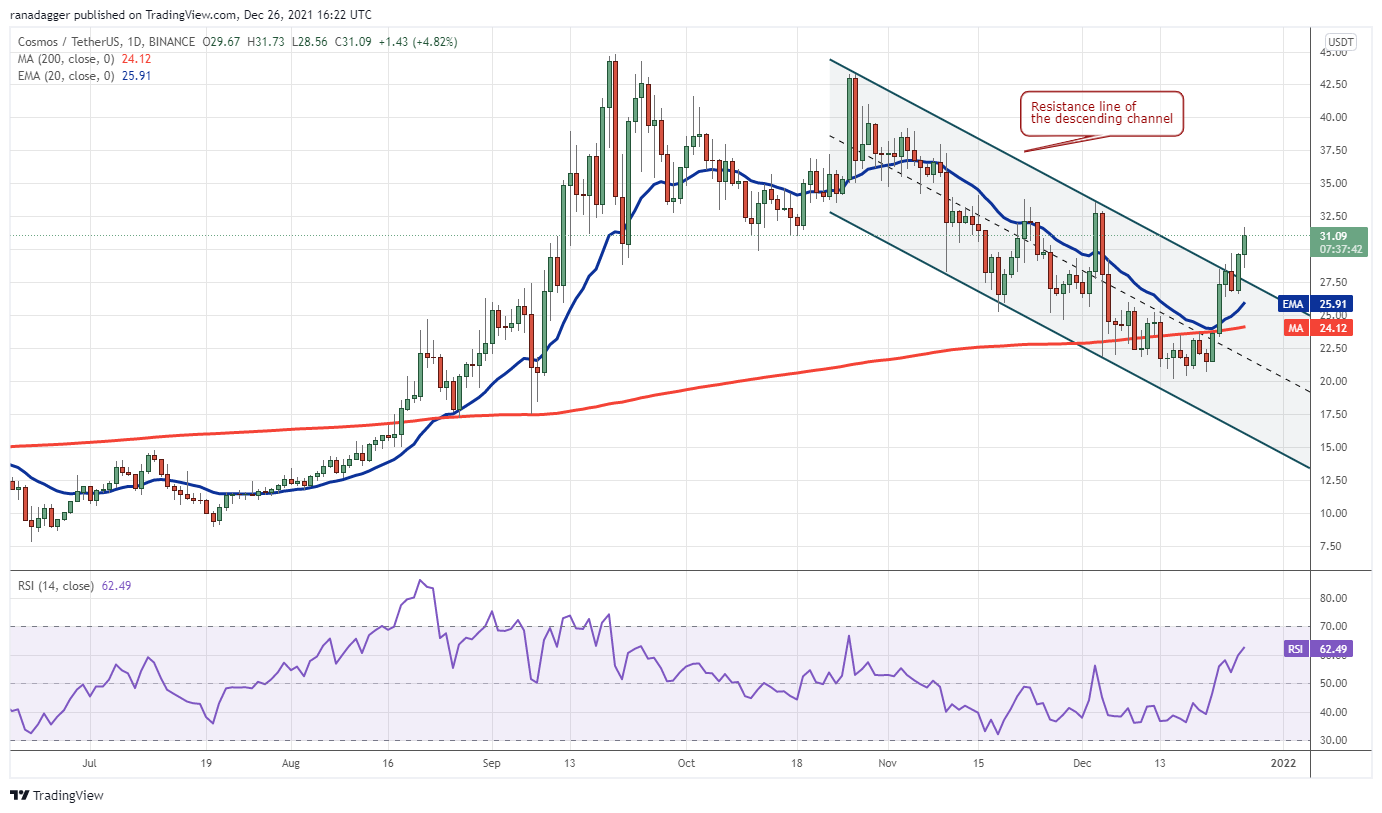
ATOM/USDT daily chart. Source: TradingView
The 20-day EMA ($25.91) has started to turn up and the RSI has risen into the positive territory, indicating that bulls have the upper hand. If buyers sustain the price above the channel, the ATOM/USDT pair could rise to $33.60 and thereafter to $38.
If the price turns down from the current level or the overhead resistance and breaks below the 20-day EMA, it will suggest that traders continue to sell on rallies. The pair could then drop to the 200-day SMA ($24.12).
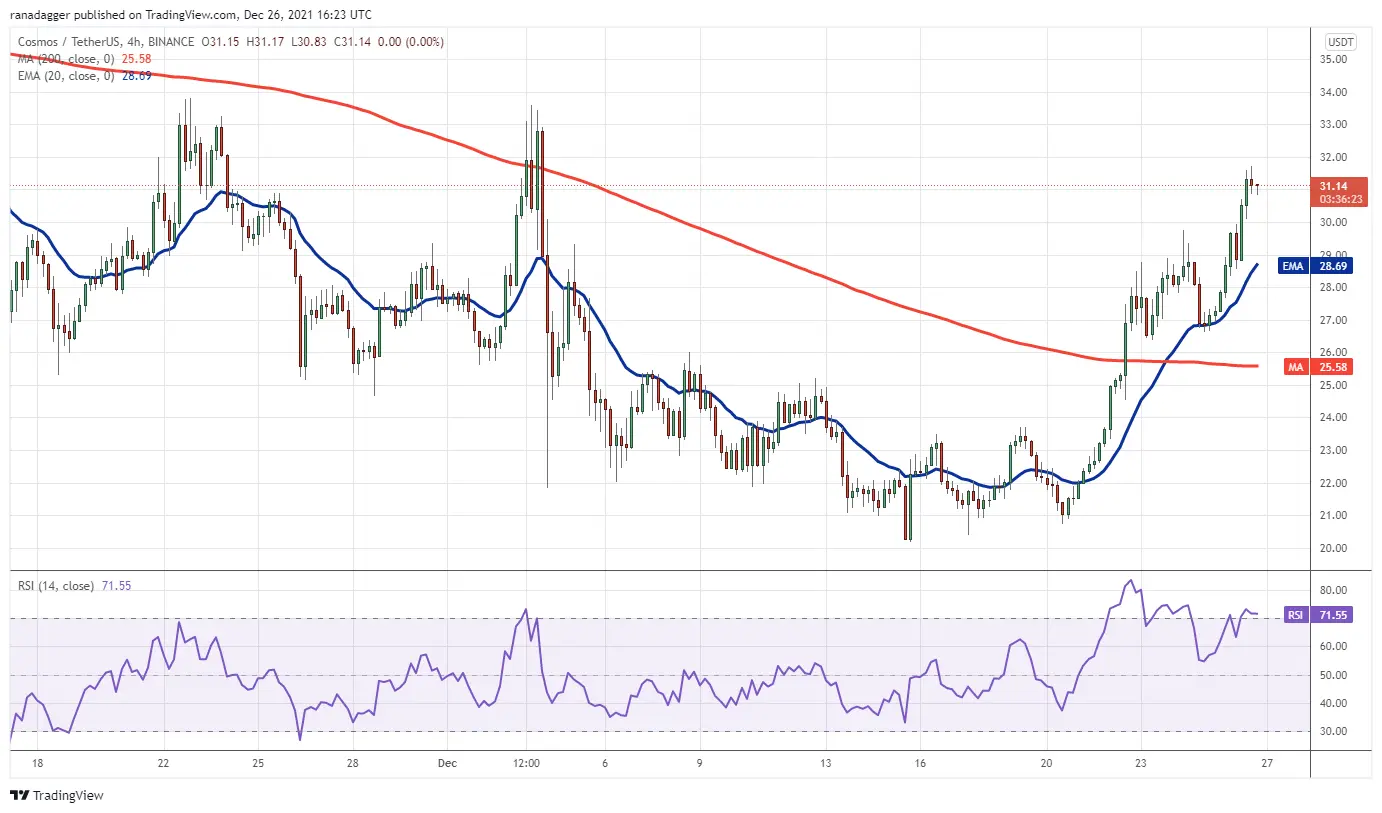
ATOM/USDT 4-hour chart. Source: TradingView
The 4-hour chart shows that the pair picked up momentum after breaking and closing above the 200-SMA. The bears tried to stall the up-move at $30 and pull the price down but the bulls successfully defended the 20-EMA.
This suggests that the sentiment has turned positive and traders are buying on dips. The pair could rally to the overhead zone at $33.60 to $34.15 where the bears may mount a strong resistance.
If the price turns down and breaks below the 20-EMA, it will suggest that supply exceeds demand. That could open the doors for a possible decline to $26.37 and then to the 200-SMA.
HNT/USDT
Helium’s HNT token bounced off the strong support at $25 and broke above the 20-day EMA ($35.38) on Dec. 16. The bears attempted to pull the price back below the 20-day EMA but the bulls purchased the dip and extended the recovery to $43.40 on Dec. 23.
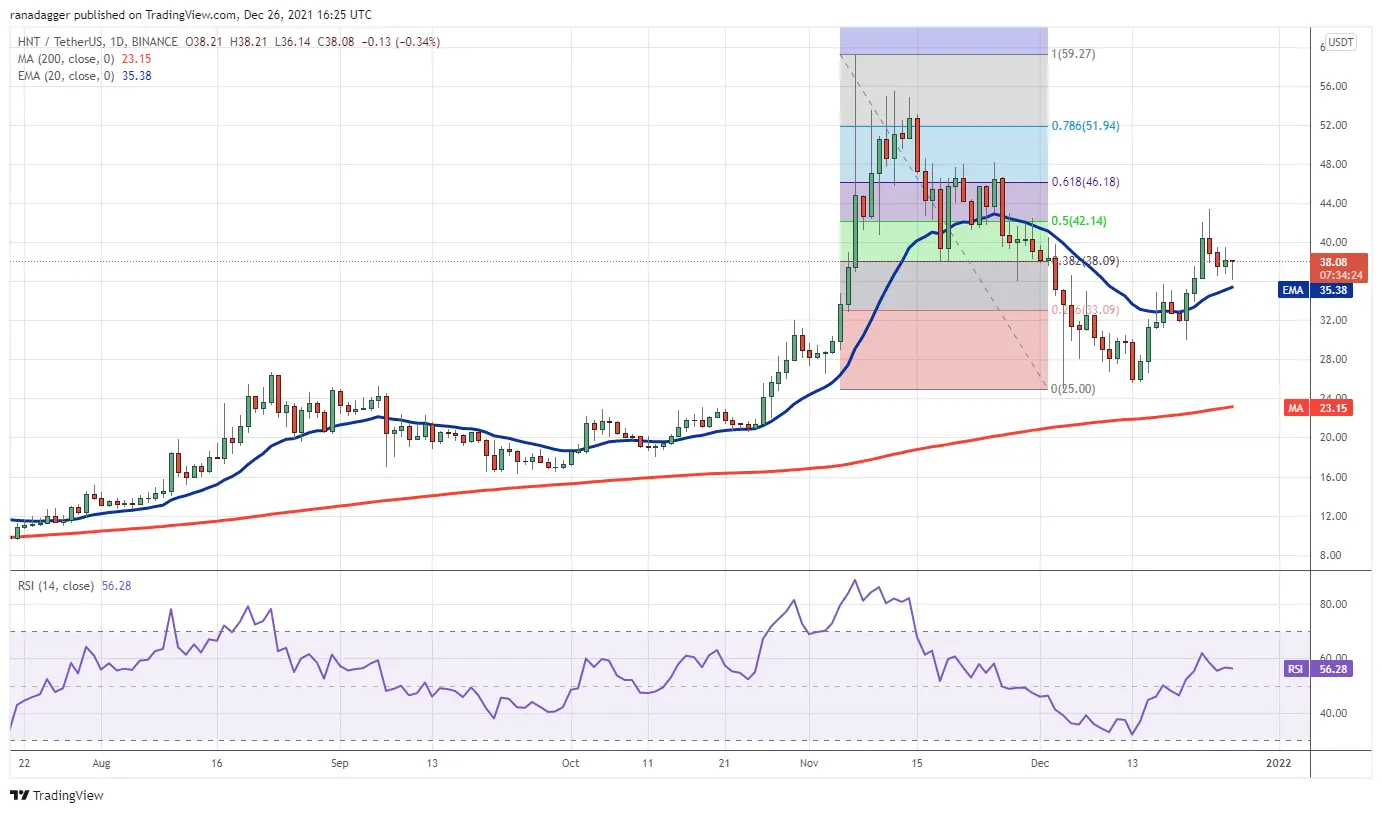
HNT/USDT daily chart. Source: TradingView
The bears are defending the overhead zone between the 50% Fibonacci retracement level at $42.14 and the 61.8% retracement level at $46.18. This has pulled the price back to the 20-day EMA, which is an important level to watch out for.
If the price rebounds off the current level, the buyers will try to push the HNT/USDT pair above the overhead zone. If they succeed, the pair could rise to $51.94.
Conversely, if bears sink the price below the 20-day EMA, the pair could drop to $29.94. A break and close below this level could sink the price to $25.
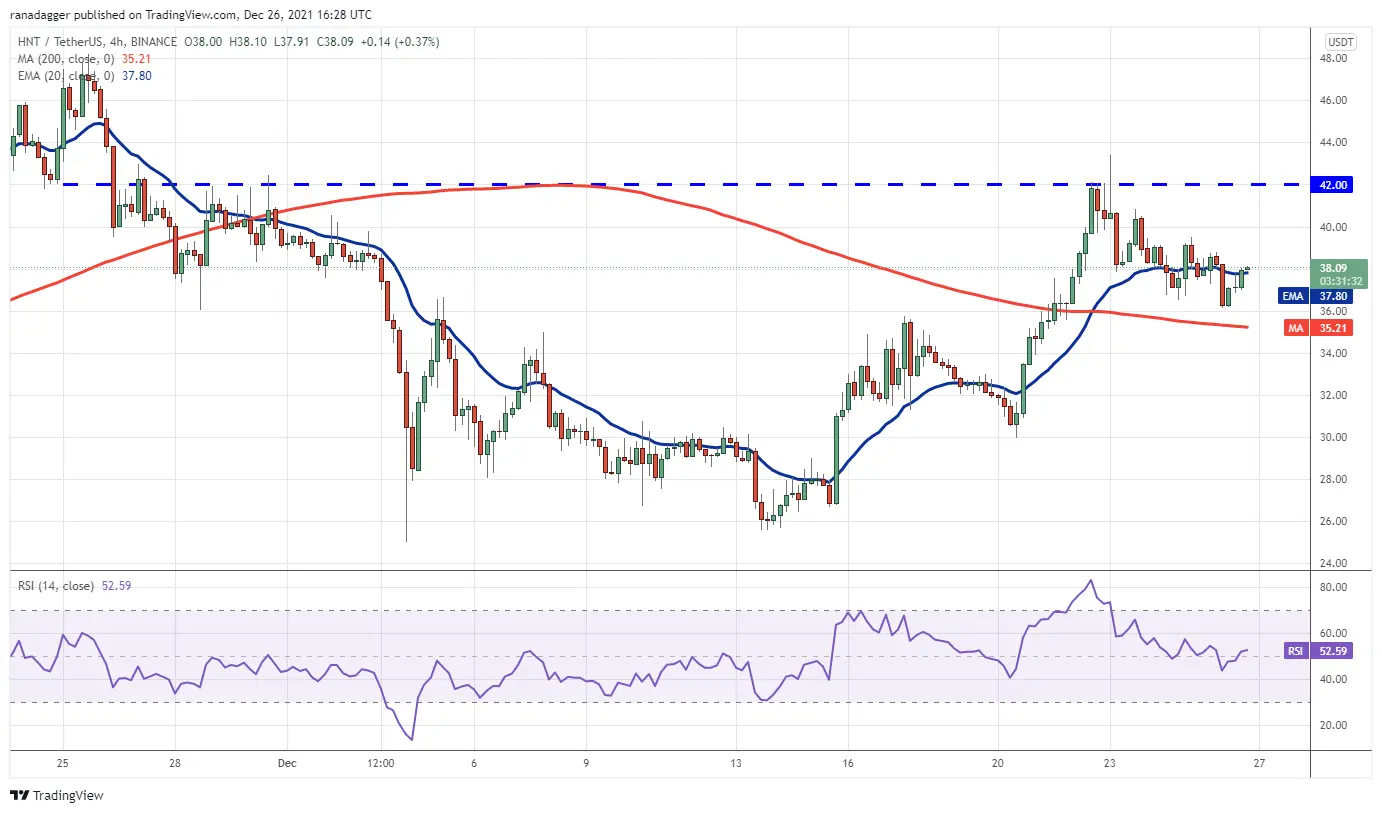
HNT/USDT 4-hour chart. Source: TradingView
The bears are defending the overhead resistance at $42. Although the bulls pushed the price above this resistance, they could not sustain the higher levels. This could have trapped the aggressive bulls, resulting in a correction.
The 20-EMA has flattened out and the RSI is near the midpoint, indicating a balance between supply and demand.
If bears pull the price below the 200-SMA, the correction could deepen further and the pair may slide to $30. Alternatively, a break and close above $39.50 could push the price to $42. A break and close above this level will suggest the resumption of the uptrend.
Author

Cointelegraph Team
Cointelegraph
We are privileged enough to work with the best and brightest in Bitcoin.


