Top 3 Price Predictions: Bitcoin faces little resistance up to $8,500, Ethereum in a tight range, Ripple looks more shaky – Confluence Detector
- The Confluence Detector shows clusters of technical levels according to their importance.
- Bitcoin is looking bullish, Ethereum is looking for a direction, while Ripple is vulnerable.

BTC/USD path of least resistance is up
The price of Bitcoin (BTC/USD) extends its gradual recovery. Can it continue higher?
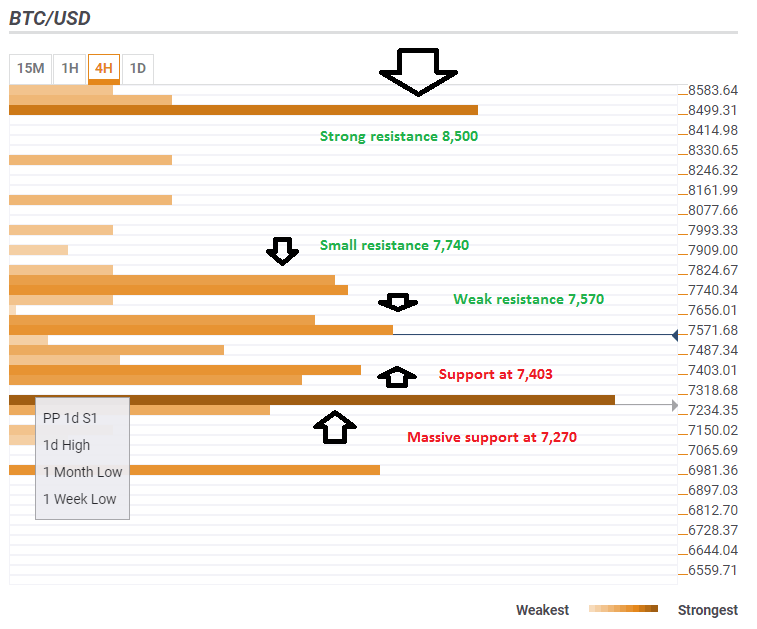
The Technical Confluence Detector shows that the digital coin has more room to the upside than to the downside. A confluence of some technical lines awaits at $7,570. This is the meting point of the Simple Moving Average 5-1h, the Pivot Point one -day R1, the SMA 5-15m, the SMA 10-15m, and the SMA 10-one day.
The next hurdle is at $7,740 which is the convergence of the Fibonacci 61.8% one-month and the Fibonacci 161.8% one-day.
However, the most significant cluster of potent resistance lines awaits only around $8,500. This is the meeting point of the Fibonacci 48.2% one-month, the Simple Moving Average 50 one day, the SMA 200-4h, and the SMA 100 one day, all strong lines.
On the downside, support awaits at $7,403 which is a cluster that consists of the 4h-high, the Fibonacci 38.2% one-day, the SMA 5-4h, and the Bolinger Band one-hour Middle (Stdv. 2.2).
The most robust support line is at $7,270 which is the confluence of the Pivot Point one-day Support 1, the one-day high, the one-month low, and the one-week low.
All in all, there is more room to the upside than to the downside.
This is how it looks:
ETH/USD is within a $36 range
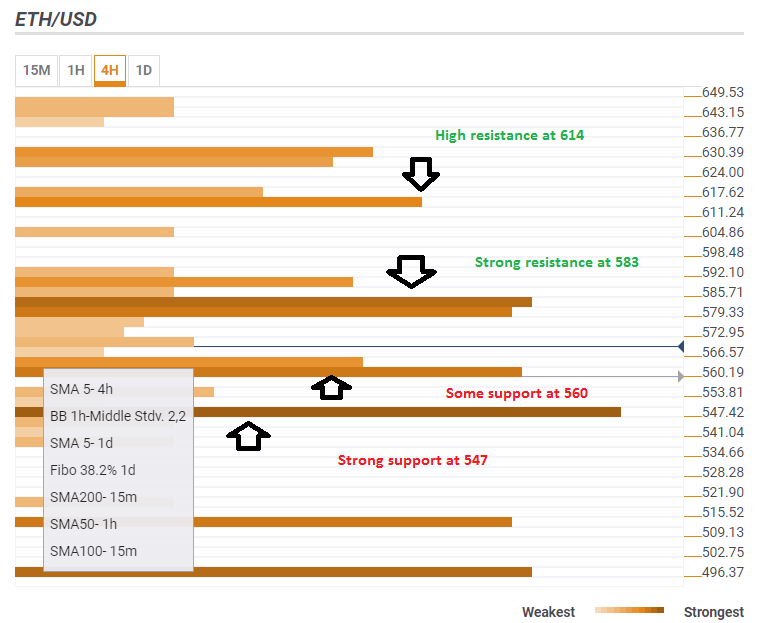
The Confluence Detector sees clear battle lines for Ethereum (ETH/USD). The cryptocurrency faces fierce resistance around $583. This is the convergence of the Fibonacci 38.2% one-month, the Bolinger Band 1h-Upper (Stdv. 2.2), the BB 15m-Upper, and the powerful Pivot Point one-day Resistance 1.
Further above, $614 is the confluence of the Fibonacci 161.8% one-day and the Fibo 38.2% one-week. This cluster is not as strong as the previous one. So, a break above $583 could unleash the upside.
On the downside, $560 is a significant line of support with the congestion of the Simple Moving Average 5-4h, the BB 1h-Middle, the SMA 5-1d, the Fibonacci 38.2% one-day, the SMA 200-15m, the SMA 50-1h, and the SMA 100-15m.
The next level to watch is $547 which consists of the Bolinger Band 1h-Middle, the one-month low, and the one-week low.
All in all, ETH/USD is trading within the $547-$583 band.
XRP/USD on unstable ground
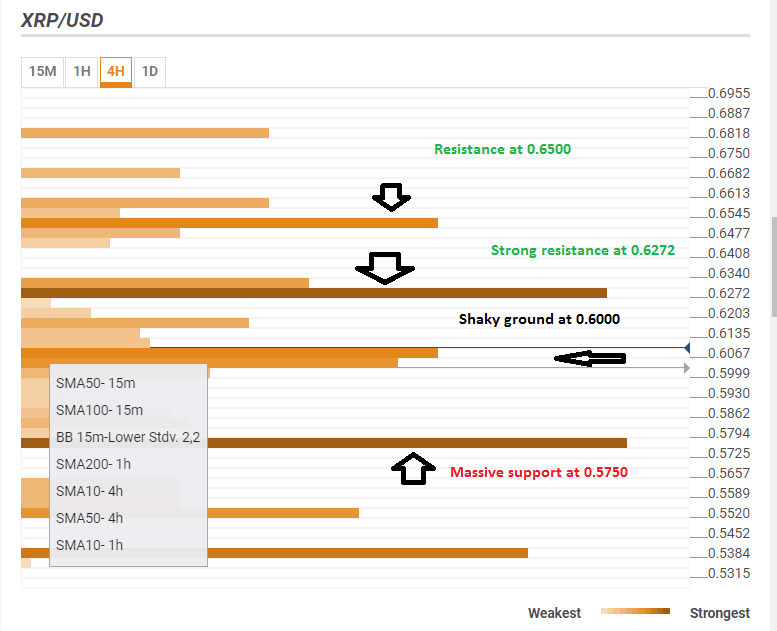
Contrary to the other blockchain biggies, Ripple (XRP/USD) is not looking that great. The $0.6000 is a convergence area of relatively weak support levels: the one hour low, the Fibonacci 23.6% one-week, the Simple Moving Average 50-15m, the SMA 100-15m, the Bolinger Band 15m-Lower, the SMA 200-1h, the SMA 50-4h, and more. While the list is long, no line stands out.
Stronger support is at $0.5750 which is the confluence of the one-month low, the one-week low, and the Bollinger Band one-hour Lower.
On the upside, $0.6272 is a critical cap: the Pivot Point one-day Resistance 1, the Fibonacci 38.2% one-week, the one-day high, and the Bolinger Band one-hour Upper converge there.
Further above on the upside, the $0.6500 area is a cluster featuring the Pivot Point one-day Resistance 2, the Fibonacci 61.8% one-month, and the Bolinger Band one-day Middle.
At current levels, there is somewhat more resistance than support for Ripple.
The Confluence Detector finds exciting opportunities using Technical Confluences. The TC is a tool to locate and point out those price levels where there is a congestion of indicators, moving averages, Fibonacci levels, Pivot Points, etc. Knowing where these congestion points are located is very useful for the trader, and can be used as a basis for different strategies.
This tool assigns a certain amount of “weight” to each indicator, and this “weight” can influence adjacents price levels. These weightings mean that one price level without any indicator or moving average but under the influence of two “strongly weighted” levels accumulate more resistance than their neighbors. In these cases, the tool signals resistance in apparently empty areas.
Author

Yohay Elam
FXStreet
Yohay is in Forex since 2008 when he founded Forex Crunch, a blog crafted in his free time that turned into a fully-fledged currency website later sold to Finixio.


