- Records in transfers and payments are not reflected in the price of XRP.
- Regulators may monitor value transfers in this new blockchain market.
- Technically speaking, the most remarkable thing is developments between key moving averages.
The day looks boring among the leading players in the crypto market — surprisingly dull as there is significant information concerning XRP.
The XRP network allows to execute more than 25 different types of orders and commands, but only one of them activates a payment protocol between addresses. We will examine the number of transactions reached on Tuesday and the number of payments made on the network.
On October 29, the number of daily XRP transactions came close to its daily historical record.
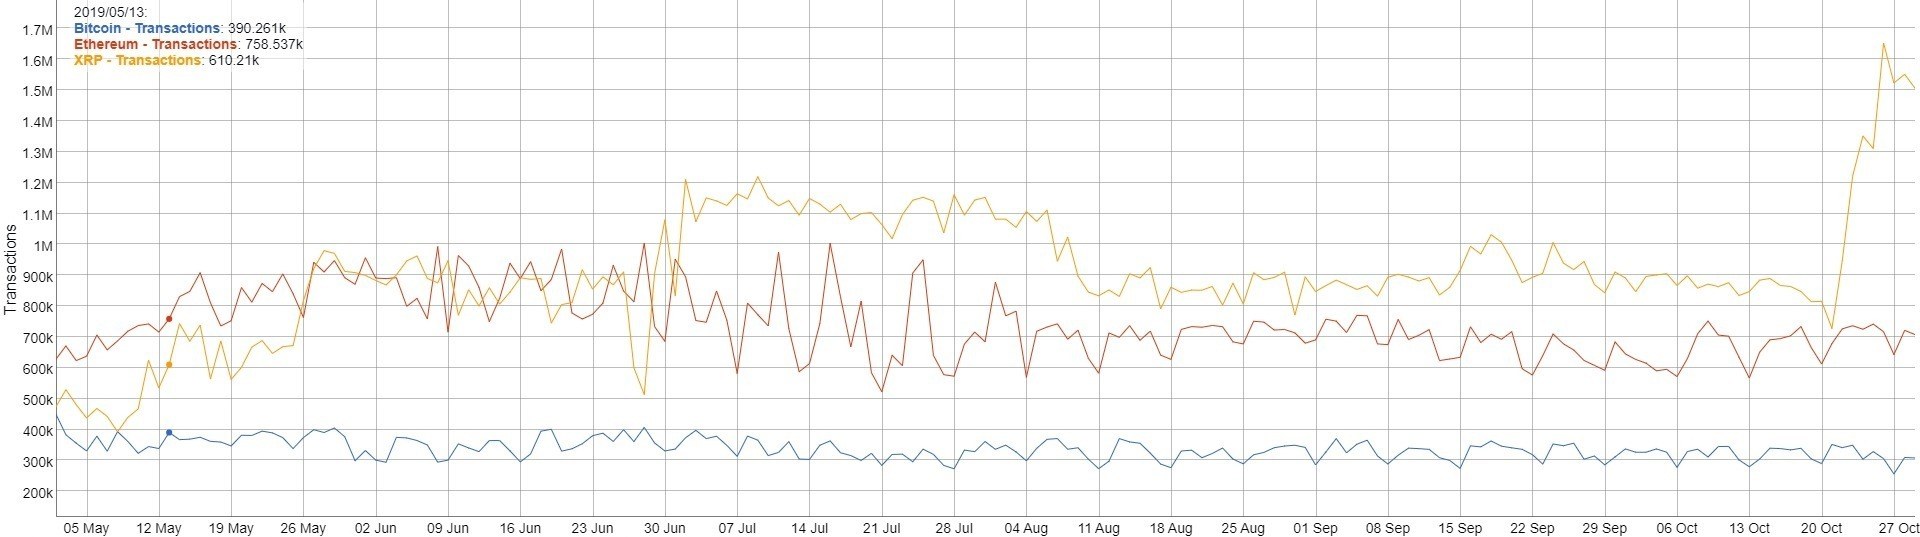
Source: Bitinfocharts.com
However, it is even more important to look at the level of payments made.
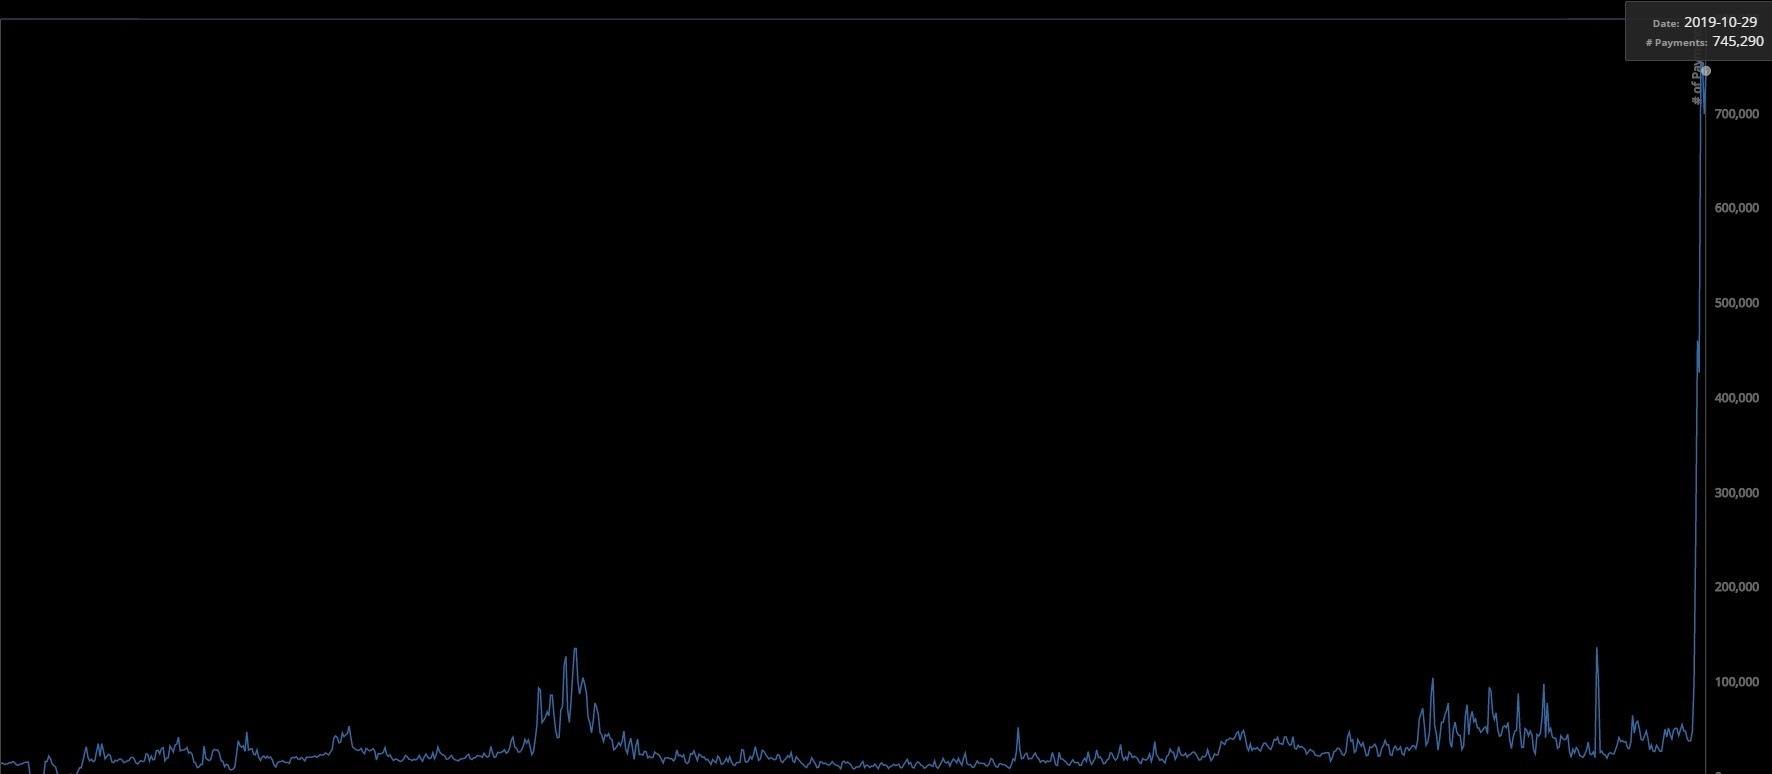
Source:Xrpcharts.ripple.com
As we can see in the graphs above, the level of transactions reached on Tuesday is marginally lower than that achieved in January 2018, but the number of payments soared in comparison to the same month in 2018.
There was no impact on XRP’s price, as Ripple’s token is a value transfer tool but with no adoption as a valuable reserve asset.
The XRP network is centralized, with Ripple Ltd regulating and deciding the amount of XRP available.
The supply of XRP is limited to 100 billion, of which just over half are in circulation. It lacks the scarcity factor that Bitcoin and Ethereum enjoy so its value must be related to other factors.
In my opinion, the price of XRP s intimately linked to the success of its parent company Ripple Ltd and the regulatory authorities should start considering how to favor the transfer of value between Ripple Ltd and XRP.
ETH/BTC Daily Chart
ETH/BTC is currently trading at 0.0201 and is recovering to the technically significant level of resistance of 0.02. The price remains compressed between the SMA100 and the EMA50 – between 0.021 and 0.020.
Above the current price, the first resistance level is 0.021, then the second at 0.022 and the third one at 0.023.
Below the current price, the first support level is at 0.020, then the second at 0.019 and the third one at 0.018.
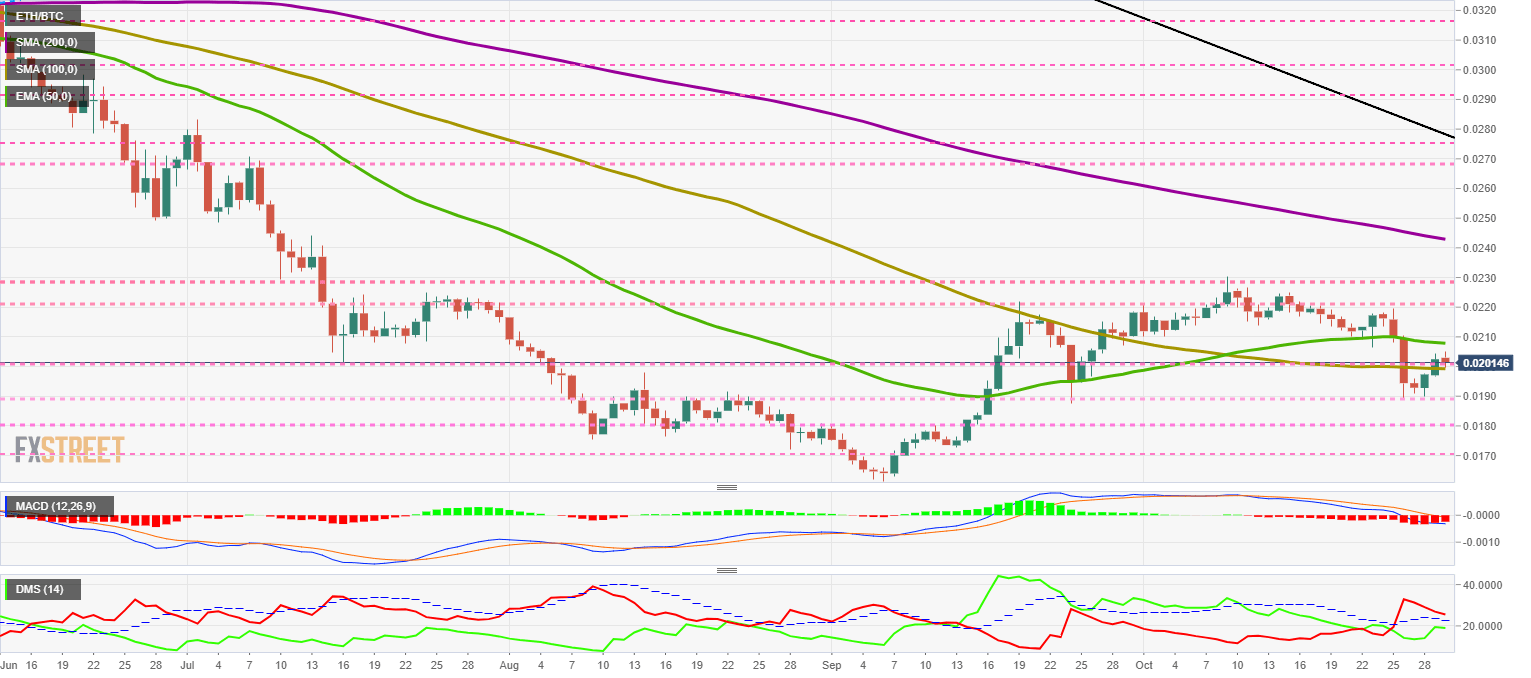
The MACD on the daily chart shows a loss of bearish slope in the moving averages. These moving averages that make up the MACD are now in the neutral zone, so the price is underlined to lose momentum.
The DMI on the daily chart shows bears losing strength as the bulls gain it. The situation concerning the ADX line supports the bearish side of the market, so the underlying trend looks to the sell-side.
BTC/USD Daily Chart
BTC/USD is currently trading at $9,099 and maintains the same range for the fourth consecutive day.
The price of BTC/USD remains compressed between the main moving averages, with the SMA200 and the EMA50 as support and the SMA100 as resistance.
Above the current price, the first resistance level is at $9,650, then the second at $10,650 and the third one at $11,250.
Below the current price, the first support level is at $9,000, then the second at $8,800 and the third one at $8,500.
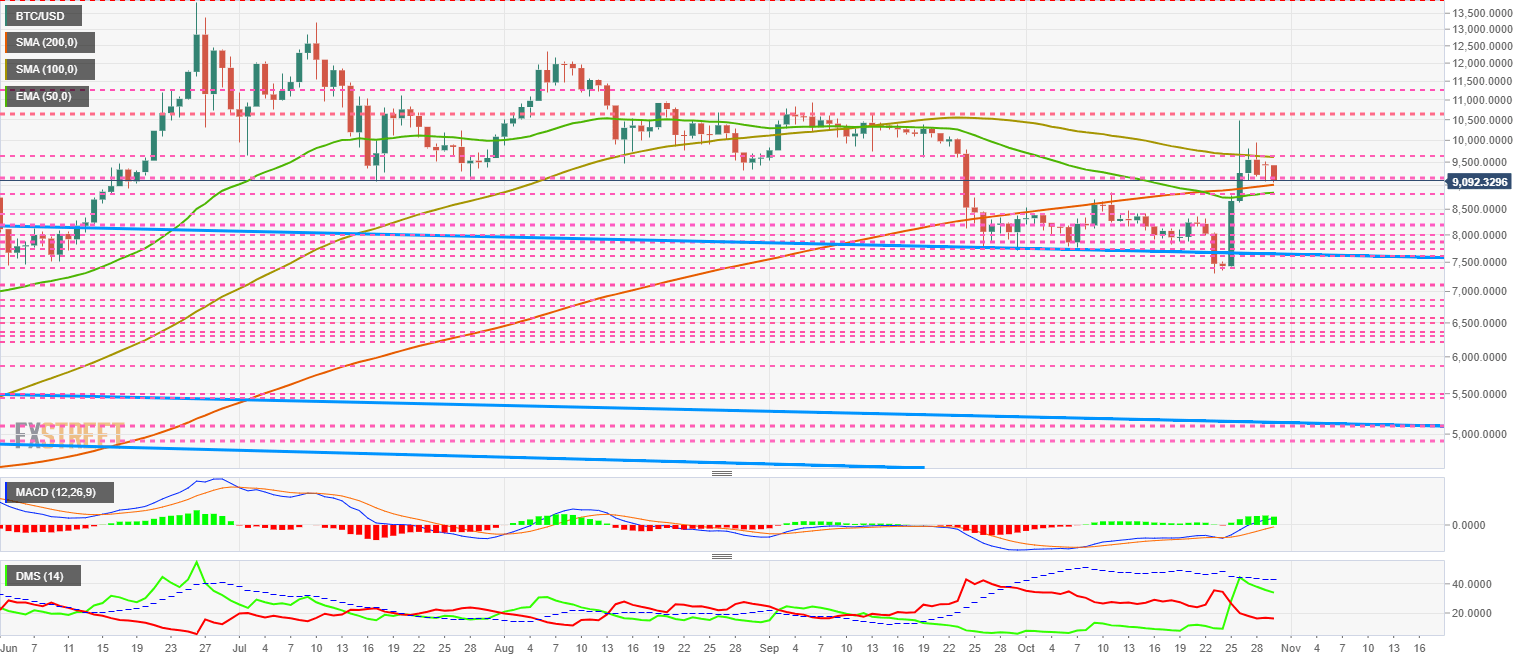
The MACD on the daily chart shows an improvement in the bullish profile. The slope and line spacing increases, both of which are positive for the price in the short term. The fast-moving average enters the positive zone, while the slow one remains in the negative area, which proposes indecision and struggles in the short term.
The DMI on the daily chart for BTC/USD shows the bulls losing strength after the failed attempt to cross up the ADX line. The bears stop the decline for the time being and could regain momentum.
ETH/USD Daily Chart
ETH/USD is currently trading at $183.7 after failing to close above $190. Moving averages compress the price although, in Ethereum’s case, the two are exerting resistance and only one support.
Above the current price, the first resistance level is at $190, then the second at $195 and the third one at $200.
Below the current price, the first support level is at $180, then the second at $170 and the third one at $160.
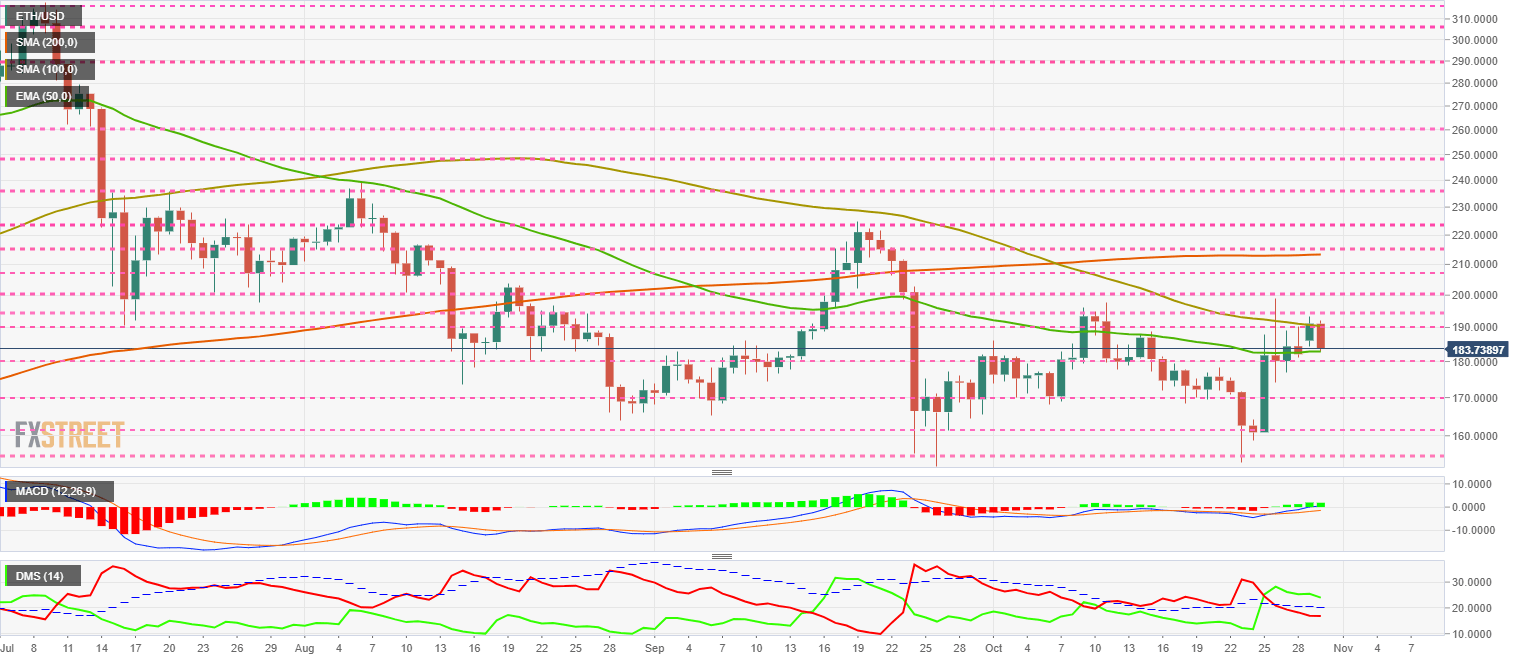
The MACD on the daily chart shows an improvement in the bullish profile, with more positive inclination while the opening remains the same. Moving averages are initiating the transition to the buyer side of the market, but it is unlikely to be a direct path.
The DMI on the daily chart shows both bulls and bears losing strength, reflecting the drop in ETH/USD volatility. Bulls take advantage by holding above the ADX line, which provides underlying bullish strength. Bears continue to lose power although at a slower pace.
XRP/USD Daily Chart
Above the current price, the first resistance level is at $0.297, then the second at $0.32 and the third one at $0.33.
Below the current price, the first support level is at $0.296, then the second at $0.293 and the third one at $0.289.
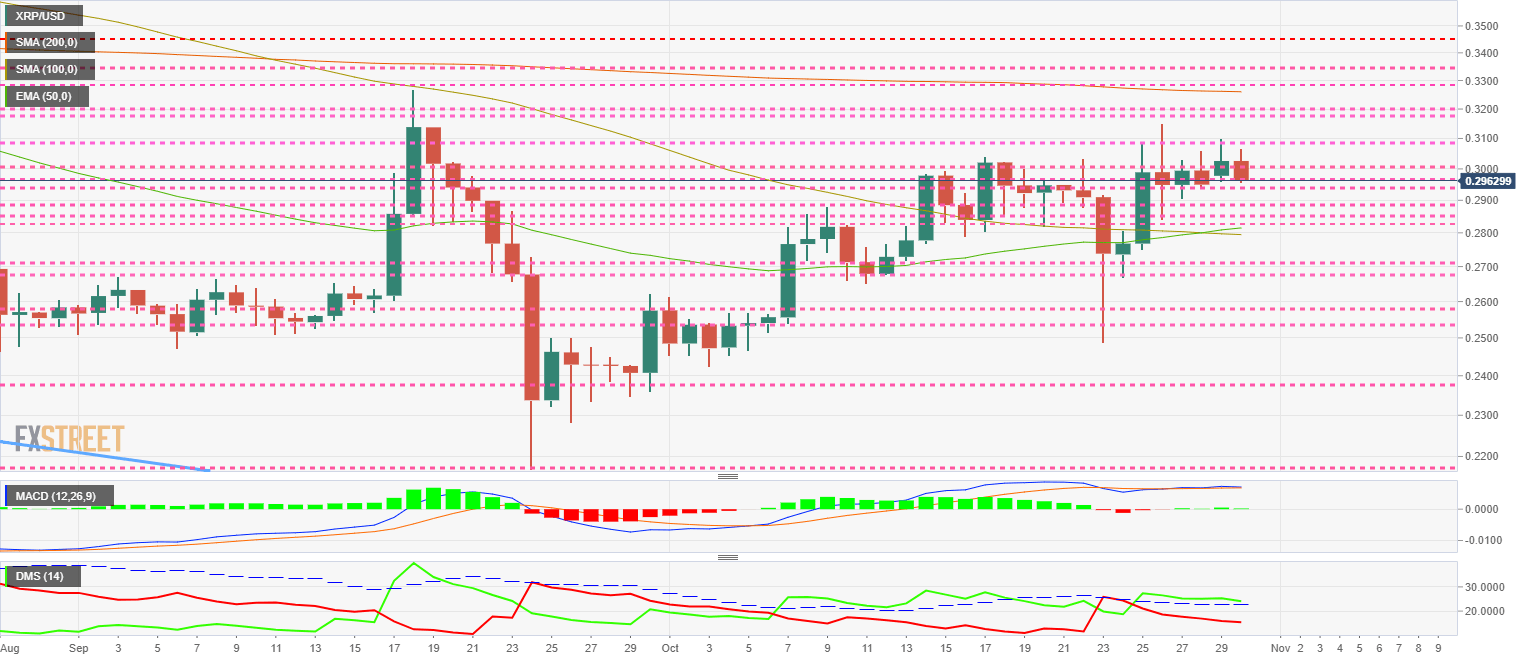
The MACD on the daily chart shows a flat profile with no spacing between the lines. This technical structure usually precedes violent price movements.
The DMI on the daily chart shows bulls losing trend strength slowly but continuously. Despite the constant drop in intensity, bulls remain above the ADX line, indicating the underlying bullish strength of XRP/USD.
Get 24/7 Crypto updates in our social media channels: Give us a follow at @FXSCrypto and our FXStreet Crypto Trading Telegram channel
Information on these pages contains forward-looking statements that involve risks and uncertainties. Markets and instruments profiled on this page are for informational purposes only and should not in any way come across as a recommendation to buy or sell in these assets. You should do your own thorough research before making any investment decisions. FXStreet does not in any way guarantee that this information is free from mistakes, errors, or material misstatements. It also does not guarantee that this information is of a timely nature. Investing in Open Markets involves a great deal of risk, including the loss of all or a portion of your investment, as well as emotional distress. All risks, losses and costs associated with investing, including total loss of principal, are your responsibility. The views and opinions expressed in this article are those of the authors and do not necessarily reflect the official policy or position of FXStreet nor its advertisers. The author will not be held responsible for information that is found at the end of links posted on this page.
If not otherwise explicitly mentioned in the body of the article, at the time of writing, the author has no position in any stock mentioned in this article and no business relationship with any company mentioned. The author has not received compensation for writing this article, other than from FXStreet.
FXStreet and the author do not provide personalized recommendations. The author makes no representations as to the accuracy, completeness, or suitability of this information. FXStreet and the author will not be liable for any errors, omissions or any losses, injuries or damages arising from this information and its display or use. Errors and omissions excepted.
The author and FXStreet are not registered investment advisors and nothing in this article is intended to be investment advice.
Recommended Content
Editors’ Picks
Ripple wipes out weekly gains, experts comment on role of Ripple stablecoin

Ripple declined to $0.52 on Thursday, erasing all gains registered earlier this week. Ripple SVP Eric van Miltenburg’s comments on the firm’s stablecoin, and how it is expected to benefit the XRP Ledger and native token XRP have raised concerns among crypto experts.
Hedera HBAR slips nearly 10% after air is cleared on mistaken link with giant BlackRock
HBAR price is down nearly 10% on Thursday, partly erasing gains inspired by the misinterpreted link with BlackRock. Despite the recent correction, Hedera’s price is up 44% in the past seven days.
The reason behind Bonk’s 105% rise and if you should buy now Premium

Bonk price has shot up 105% in the past five weeks. A retracement into $0.0000216 or the $0.0000152 to $0.0000186 imbalance would be a good buying opportunity. Patient investors can expect double-digit gains from BONK that could extend up to 70%.
Injective price weakness persists despite over 5.9 million INJ tokens burned
Injective price is trading with a bearish bias, stuck in the lower section of the market range. The bearish outlook abounds despite the network's deflationary efforts to pump the price. Coupled with broader market gloom, INJ token’s doomed days may not be over yet.
Bitcoin: BTC post-halving rally could be partially priced in Premium

Bitcoin (BTC) price briefly slipped below the $60,000 level for the last three days, attracting buyers in this area as the fourth BTC halving is due in a few hours. Is the halving priced in for Bitcoin? Or will the pioneer crypto note more gains in the coming days?