- Short-term hopes do not extend to the longer term.
- Ethereum continues to weaken and drags the whole market down.
- XRP also shows a lack of direction and gets stuck at well-known levels.
Today, it's time to perform an analysis of scenarios that allow us to build different strategies for the coming weeks.
The crypto market continues awaiting for Ethereum to react and start fulfilling its essential role as the leader of the Altcoins.
I have repeated on numerous occasions that, in my opinion, the crypto market needs two conditions to enter bullish mode fully:
- The first condition is that Bitcoin should be in bullish mode. BTC/USD has managed to get out of the long-term bearish scenario by beating $8,150, and I now consider it to be in a bullish lateral scenario. Its value has multiplied by three since December, but it remains at about 50% of its peak price level.
- The second necessary condition is that Altcoins and Ethereum, in particular, perform better than Bitcoin. All major upward movements in the whole market have occurred when Ethereum has taken the lead.
Let us focus on the critical question – when will the second condition be met?
The analysis of the ETH/BTC pair shows no signs of a significant uptrend – not in the medium nor in long term – and only shows signs of typical technical extremes preceding an uptrend only in the short term. We will see this in the analysis of the Directional Movement Index (DMI).
ETH/BTC Daily Chart
ETH/BTC is currently trading at the price level of 0.02889 and loses support at the price congestion of 0.0292. The margin for more drops is tight before the price may enter a free fall – which could have terrible consequences for the entire Altcoins segment.
Below the current price, the first support level is at 0.0281 (price congestion support), then the second is at 0.0275 (price congestion support) and the third one at 0.0268 (price congestion support).
Above the current price, the first resistance level is at 0.0291 (price congestion resistance), the second is a confluence extending from 0.0298 to 0.03106 (EMA50, SMA100, and SMA200) and the third one awaits at 0.032. It is another confluence of a price congestion resistance and a parallel bullish trend line.
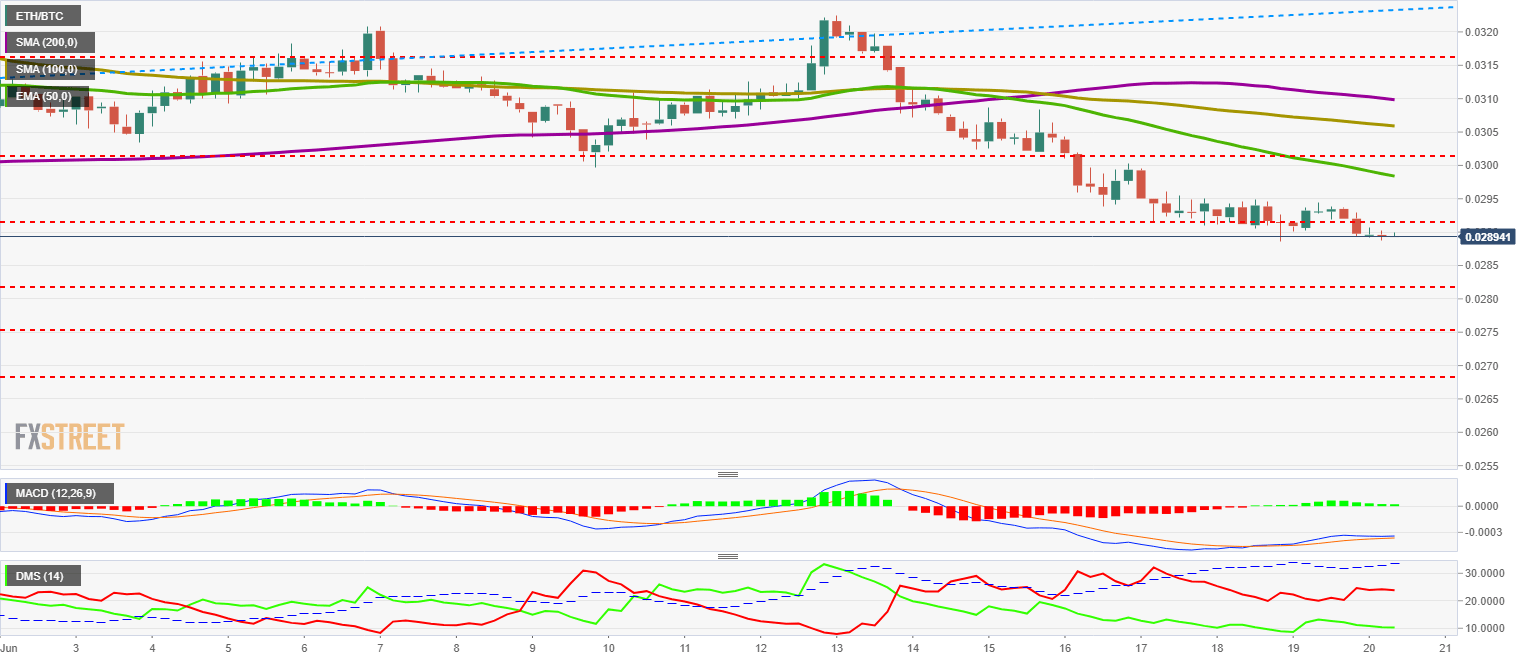
The MACD on the 4-hour chart is crossed bullish but with no bullish inclination and even less separation between moving averages. In principle, it is a structure that tends to develop upwards, although the lack of strength that shows makes it difficult to imagine.
The DMI on the 4-hour chart shows bears controlling the market without problems while the bulls go to levels unseen since the days before the last significant upwards move.
Every time the D+ has reached these lows – the pair has reacted to the upside.
BTC/USD Daily Chart
BTC/USD is currently trading at $9,271 and remains above the $9.200 support level (price congestion support).
Above the current price, the first resistance level is at $9,600 (price congestion resistance), then the second one is at $10,600 (price congestion resistance) and finally, the third one awaits at $11,250 (price congestion resistance).
Below the current price, the first level of support is at $9,200 (price congestion support), then the second at $8,800 (price congestion support) and the third one for the ETH/BTC pair is at $8,400 (price congestion support).
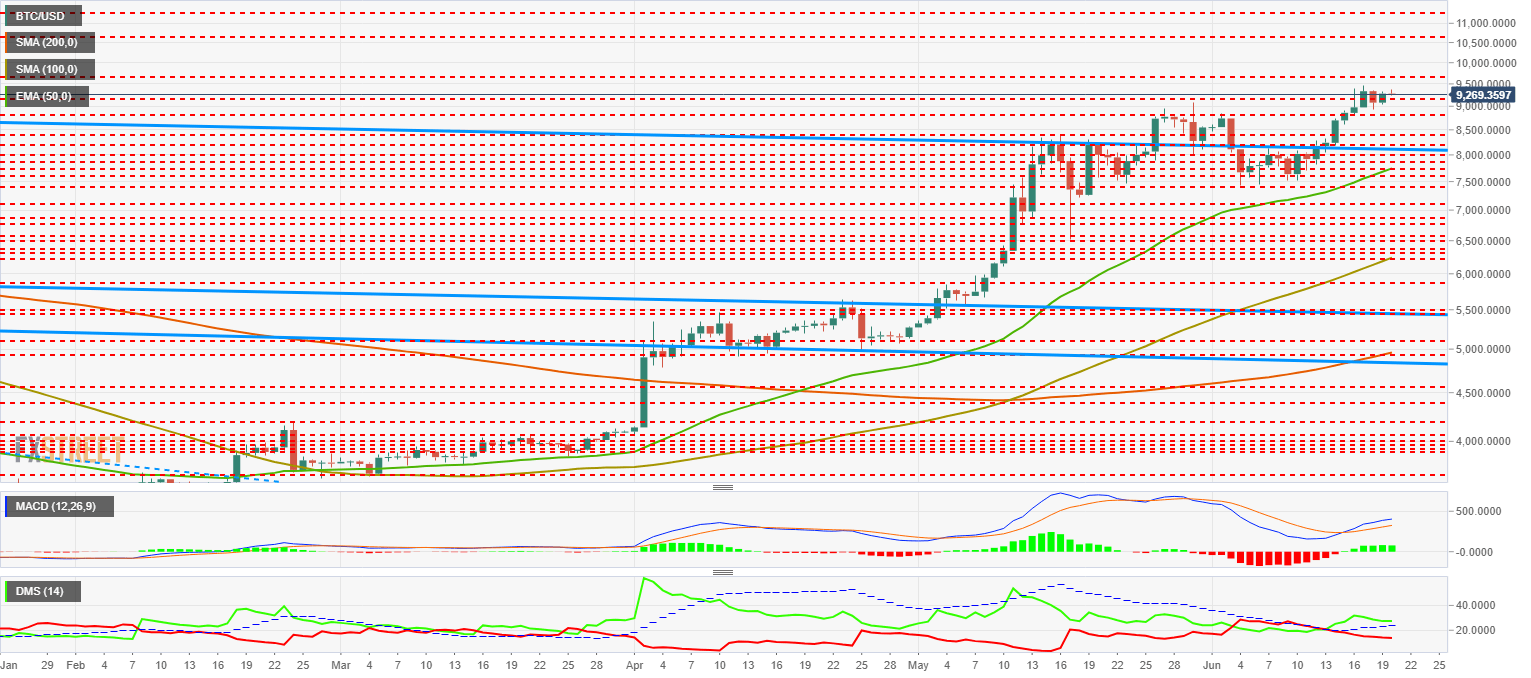
The MACD on the 4-hour chart shows a fully bullish profile, both for steepness and openness between the averages. The structure is divergent with the price, which paints the analysis with darker tones.
The DMI on the 4-hour chart shows bulls dominating the situation, although with less advantage compared to previous days. Bears continue to decline and are far from extreme levels.
ETH/USD Daily Chart
ETH/USD is currently trading at the $267.5 price level.
Above the current price, the first resistance level is at $290 (price congestion resistance), then the second one is at $308 (price congestion resistance), and the third cap for ETH/USD is at $318 (price congestion resistance).
Below the current price, the first support level is at $260 (price congestion support), then the second cushion is at $250 (price congestion support), and the third one is at $238 (price congestion support and EMA50).
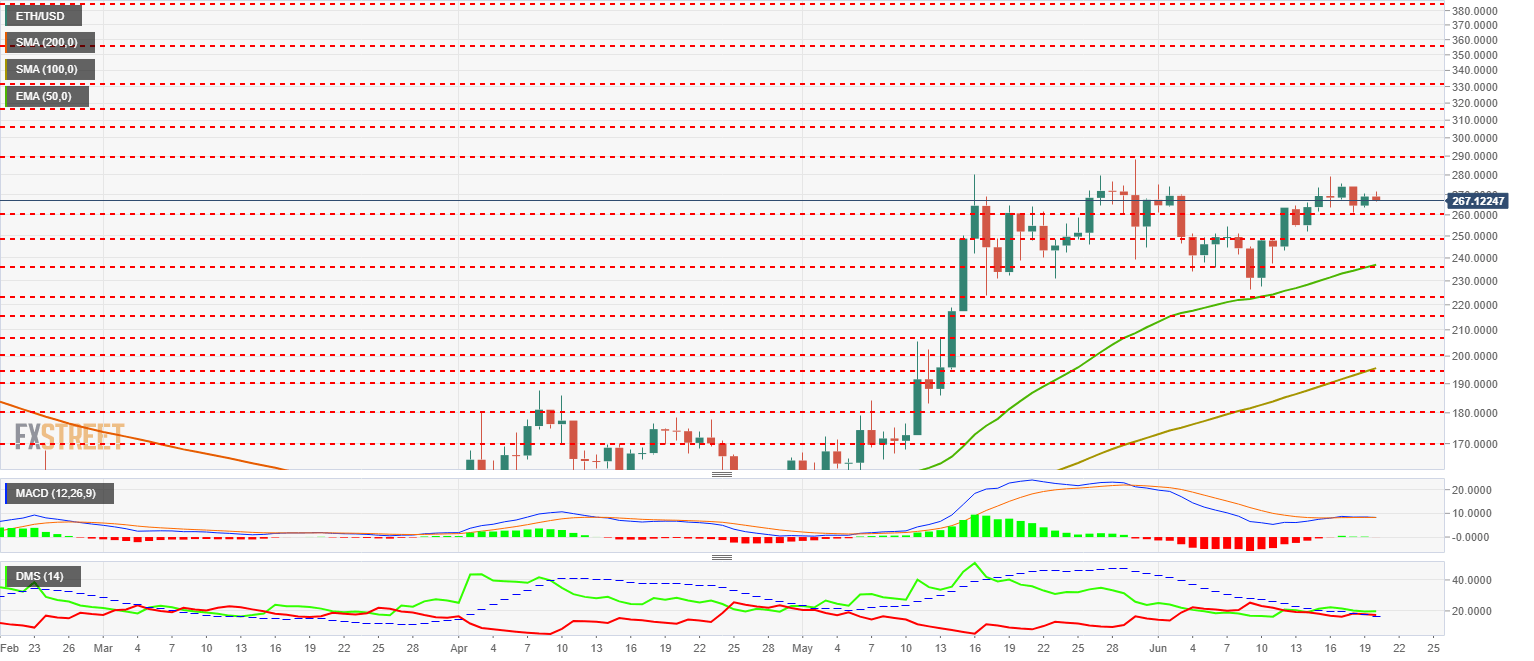
The MACD on the daily chart shows an utterly flat profile with no opening between the lines. It is a structure that does not give any information, similar to the one that showed the days before the last bullish section.
The DMI on the daily chart shows bulls with a minimal advantage over bulls — both sides of the market move above the ADX line.
XRP/USD Daily Chart
XRP/USD is currently trading at $0.429 – right at the price level of the first support for price congestion.
Above the current price, the first resistance level is $0.439 (price congestion resistance), then the second is $0.442 (price congestion resistance), and the third one is $0.468 (price congestion resistance).
Below the current price, the first support level is $0.412 (price congestion support), then the second support level is $0.39 (price congestion support and EMA50) and the third one is $0.367 (price congestion support).
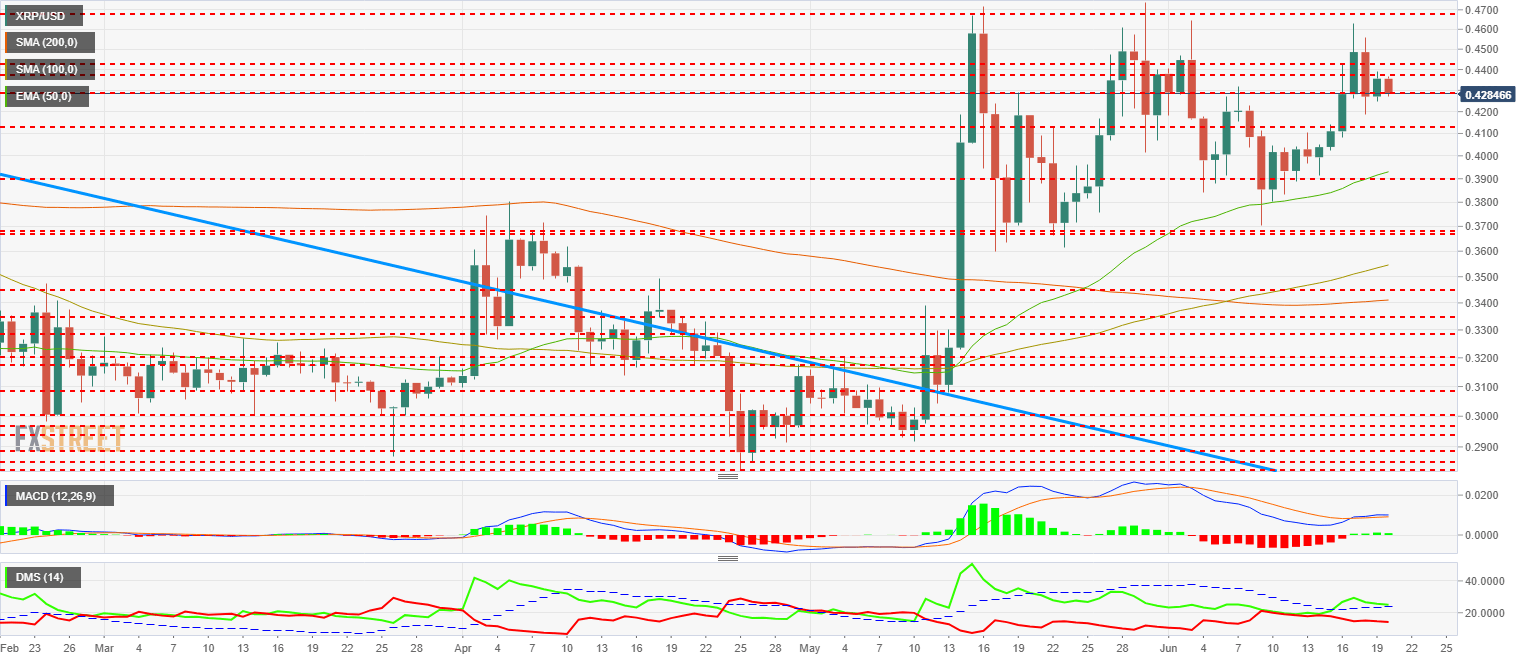
The MACD on the daily chart shows a very flat profile with hardly any opening between the lines – although the bullish cross remains.
The DMI on the daily chart shows bulls dominating the scene and moving above the ADX line. The bears, on the other hand, continue to descend softly but far from their lows.
Get 24/7 Crypto updates in our social media channels: Give us a follow at @FXSCrypto and our FXStreet Crypto Trading Telegram channel
Information on these pages contains forward-looking statements that involve risks and uncertainties. Markets and instruments profiled on this page are for informational purposes only and should not in any way come across as a recommendation to buy or sell in these assets. You should do your own thorough research before making any investment decisions. FXStreet does not in any way guarantee that this information is free from mistakes, errors, or material misstatements. It also does not guarantee that this information is of a timely nature. Investing in Open Markets involves a great deal of risk, including the loss of all or a portion of your investment, as well as emotional distress. All risks, losses and costs associated with investing, including total loss of principal, are your responsibility. The views and opinions expressed in this article are those of the authors and do not necessarily reflect the official policy or position of FXStreet nor its advertisers. The author will not be held responsible for information that is found at the end of links posted on this page.
If not otherwise explicitly mentioned in the body of the article, at the time of writing, the author has no position in any stock mentioned in this article and no business relationship with any company mentioned. The author has not received compensation for writing this article, other than from FXStreet.
FXStreet and the author do not provide personalized recommendations. The author makes no representations as to the accuracy, completeness, or suitability of this information. FXStreet and the author will not be liable for any errors, omissions or any losses, injuries or damages arising from this information and its display or use. Errors and omissions excepted.
The author and FXStreet are not registered investment advisors and nothing in this article is intended to be investment advice.
Recommended Content
Editors’ Picks
Trust Wallet with over 100 million users back on Google Play Store after temporary removal

Trust Wallet is a non-custodial software wallet that allows traders to send, receive, exchange and hold digital assets. Users can hold cryptocurrencies and NFTs in their Trust Wallets. The wallet disclosed its removal from Google’s application store, Play Store, early on Monday.
Maker loses 9% in past 24 hours as whales sell MKR for profits

Maker (MKR) wiped out 9% of its value in the past 24 hours. Data from crypto intelligence tracker Santiment shows that large wallet investors are taking profit on their MKR holdings, likely driving down the asset’s price.
Week Ahead: Bitcoin could surprise investors this week Premium

Two main macroeconomic events this week could attempt to sway the crypto markets. Bitcoin, which showed strength last week, has slipped into a short-term consolidation. However, a shift in momentum could soon bring forth a momentary rally for BTC and altcoins.
XRP slides to $0.50 as ETHgate controversy resurfaces, Ripple CTO debates impact on litigation

Ripple (XRP) loses all gains from the past seven days, trading at $0.50 early on Monday. XRP holders have their eyes peeled for the Securities and Exchange Commission (SEC) filing of opposition brief to Ripple’s motion to strike expert testimony.
Bitcoin: BTC’s next breakout could propel it to $80,000 Premium

Bitcoin’s (BTC) recent price consolidation could be nearing its end as technical indicators and on-chain metrics suggest a potential upward breakout. However, this move would not be straightforward and could punish impatient investors.