Top 3 Price Prediction Bitcoin, Ripple, Ethereum: The Crypto market needs time and we need patience
- The current technical structures in Altcoins need time to be solved.
- Only a major shock could trigger an early solution.
- Bitcoin needs the support of Altcoins in order to continue to rise.

Of my more than 20 years working as an haute cuisine chef, one of the things I remember best is the result obtained with slow cooking.
My mother, also a chef, taught me the traditional Mediterranean cuisine and its secrets. The first secret was to give time for the ingredients of the recipe to align – evolving from a taste that lacked strength to a wonderful dish as the hours passed by.
Such patience is a gift that I do not have in large quantities – but it is now essential when trading cryptos. We need to give markets time to align and provide us the best results.
Patience was missing on Tuesday as Bitcoin failed in its attempt to move away from the support level by $11,260. Both Ethereum and XRP remain below the main moving averages and continue to burden the market. Litecoin, the fourth on the list, moves above the 200 simple moving average but is also unable to surpass the 50 and Exponential Moving Averages (EMAs).
Past data indicate that for the bull rally to be consistent, it must be made WITH the Altcoins and in its explosive phase – and led by them.
For now, the market is denying this and is demanding patience from us.
ETH/BTC Daily Chart
The ETH/BTC pair reflects the situation very graphically. The levels of equivalence concerning Bitcoin are at shallow levels – and what is worse – it seems that this is not going to change, at least not now.
Once ETH/BTC loses the 0.020 level, the next support level is at 0.0187 (price congestion support), then the second one is at 0.017 (price congestion support), and the third one is at 0.0155 (price congestion support).
Above the current price, the first resistance level is at 0.020 (price congestion resistance), then the second at 0.0229 (price congestion resistance) and the third one at 0.0236 (50-period exponential average).
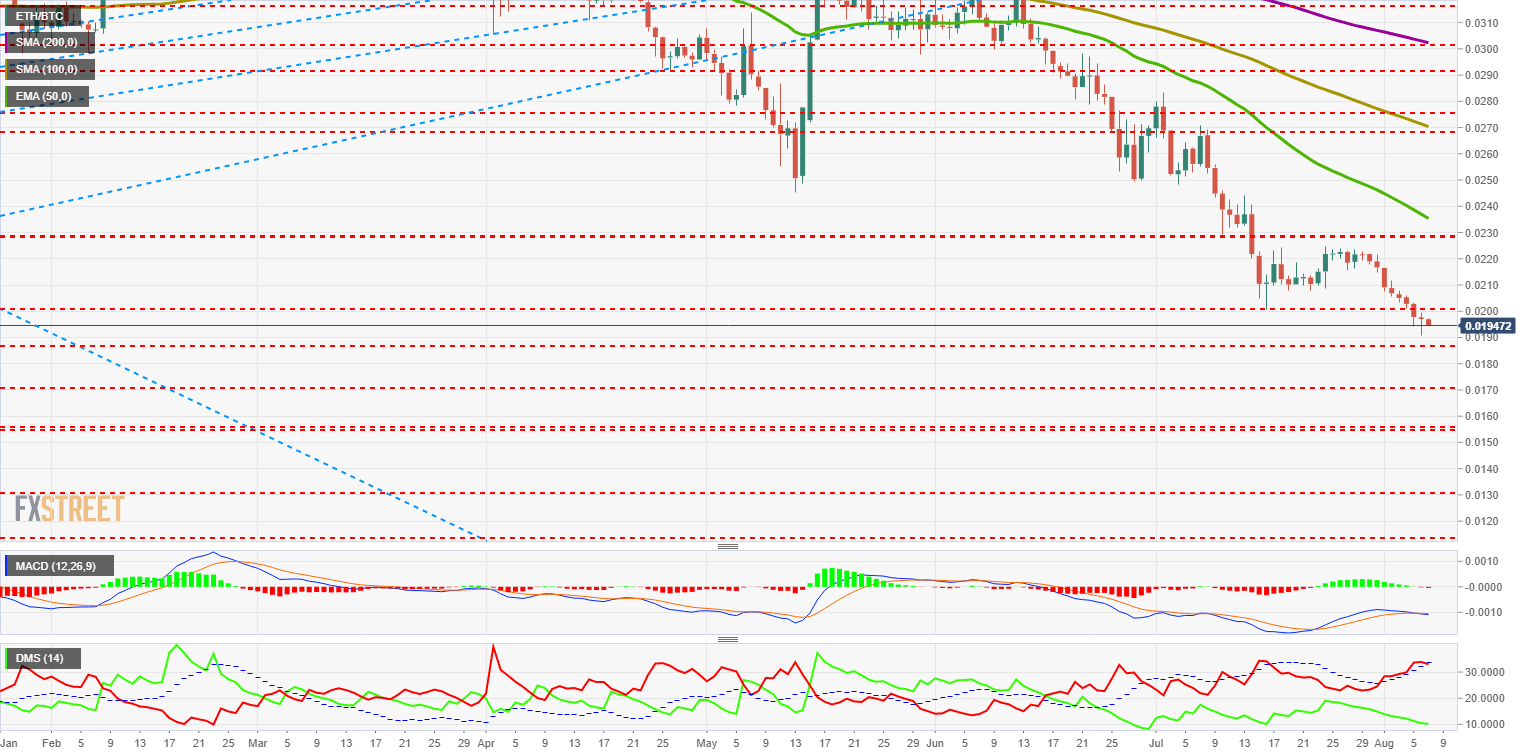
The MACD presents us with an ambiguous profile. Among its possible developments, there are various options ranging from a bearish continuity to a possible upward rebound. The highlight of the current MACD level is the potential divergence if the relative price of ETH/BTC moves higher.
The DMI on the daily chart shows a very extreme situation, with both sides of the market at levels where they do not usually move. This type of extreme structure tends to be short-lived and resolved with a counter-movement.
BTC/USD Daily Chart
BTC/USD is trading at the $11,629 price level and is down almost $1,000 from yesterday's highs. For now, it manages to stay above the $11,250 support level and retains the potential to attack unopposed relative highs. The problem is that it needs the support of the Altcoins.
Below the current price, the first support level is at $11,257 (price congestion support), then the second at $10,268 (50-period exponential moving average) and the third one at $9,600 (price congestion support).
Above the current price, the first resistance level is at $14,000 (price congestion resistance), then the second at $17,000 (price congestion resistance) and the third one at historical highs near $20,000.
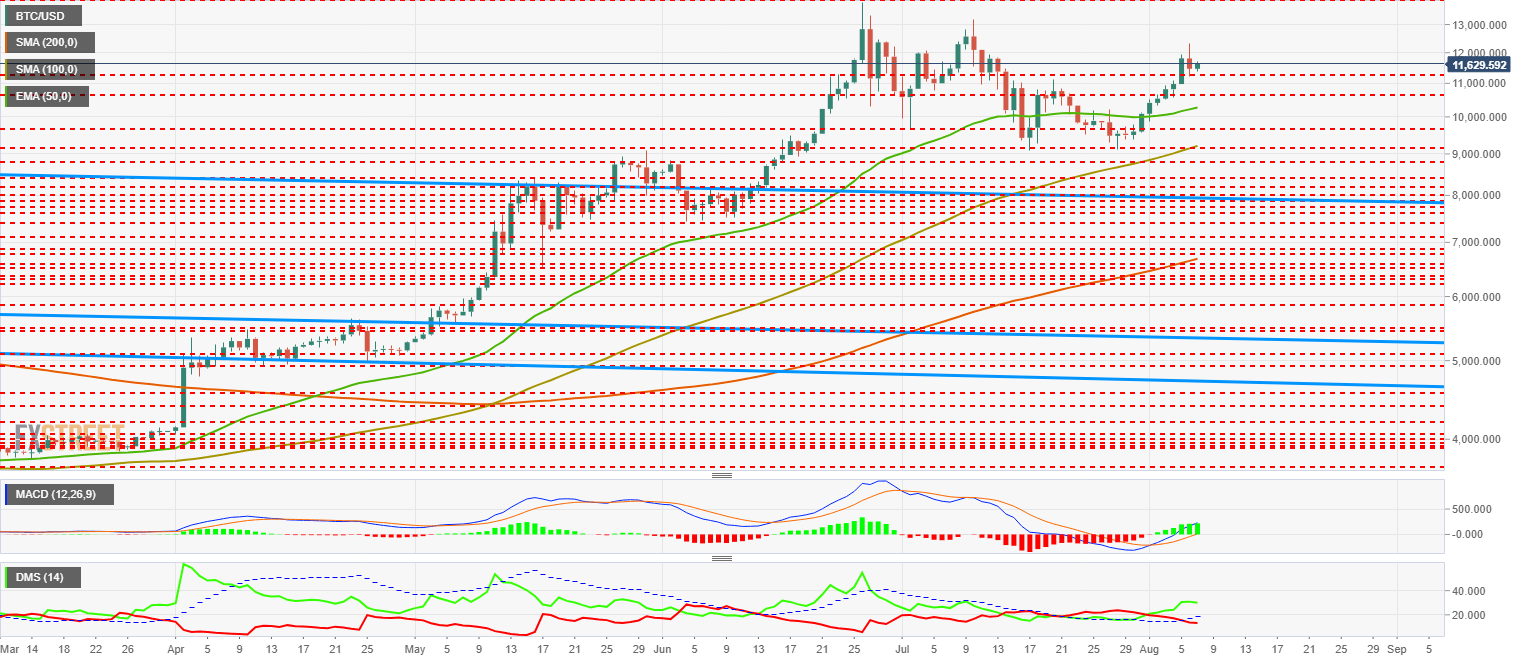
The MACD on the daily chart shows a very open and bullish profile. It would be very bullish if it weren't for being in the 0 level or breakeven point zone. In this zone, it is easy for the indicator to flatten out in search of support above the middle line. Tuesday’s price action suggests this scenario.
The DMI on the daily chart shows the bulls leading even though they lose the degree of bullishness they had two days ago. The bears lose the support of the ADX line and complete a pattern of downward continuity on behalf of the sellers.
ETH/USD Daily Chart
ETH/USD is currently trading at $225.15 after Tuesday’s failure to break the 50-period exponential moving average by $240.
Below the current price, the first level of support is at $225 (price congestion support), then the second at $215 (price congestion support) and the third one at $207 (price congestion support).
Above the current price, the first resistance level is at $236 (price congestion resistance and EMA50), then the second at $248 (SMA100 and price congestion resistance) and the third one at $260 (price congestion resistance).
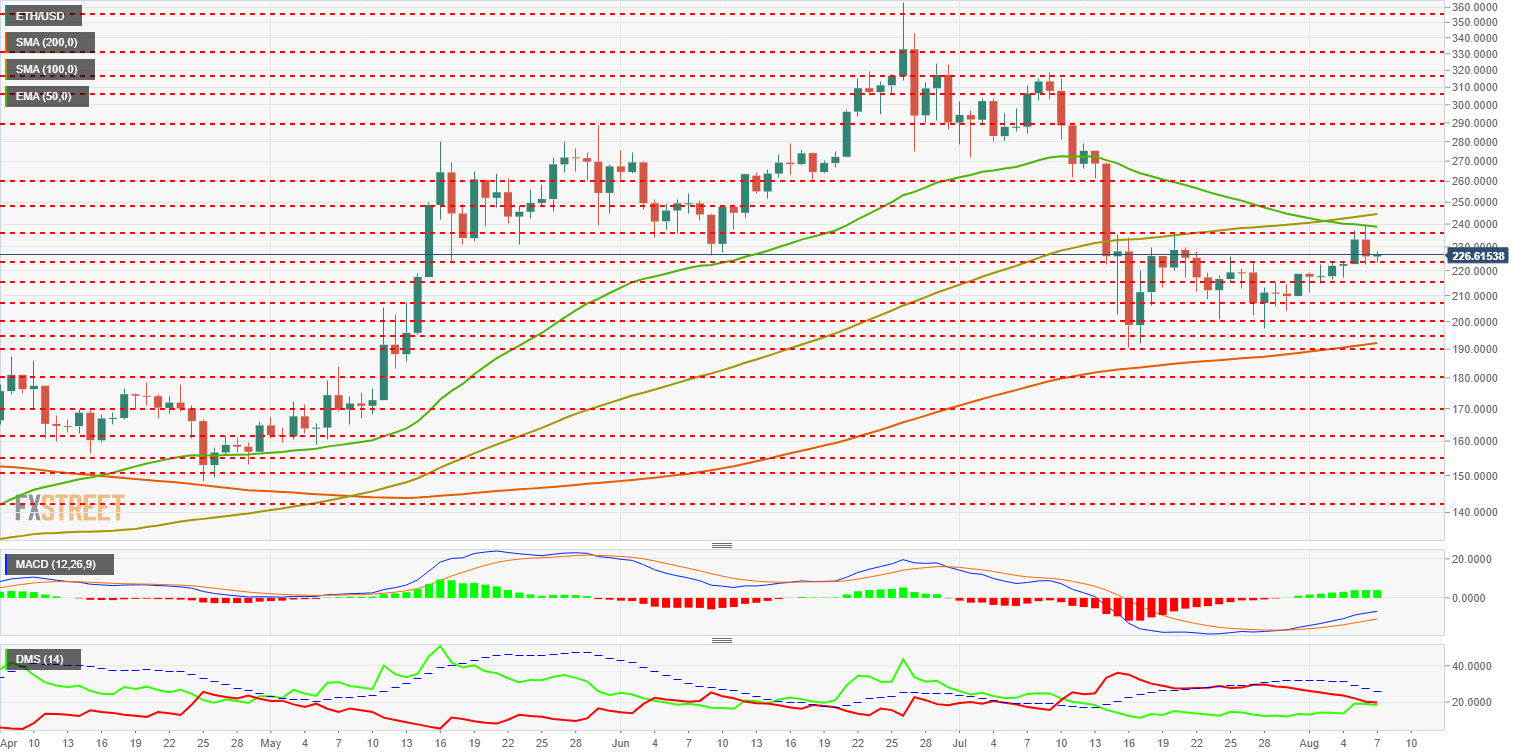
The MACD on the daily chart loses some of its bullish bias while retaining the line spacing. The indicator loses some upside potential in the short term.
The DMI on the daily chart shows a tie between both sides of the market. Bears remain symbolically above bulls, although at any moment this equilibrium will be broken.
XRP/USD Daily Chart
The XRP/USD is trading at $0.3103 – at the same range it has settled since mid-July.
Below the current price, the first support level is $0.30 (price congestion support), then the second at $0.295 (price congestion support), and the third one at $0.293 (price congestion support).
Above the current price, the first resistance level is at $0.32 (double price congestion resistance), then the second at $0.328 (price congestion resistance) and the third one at $0.335 (price congestion resistance).
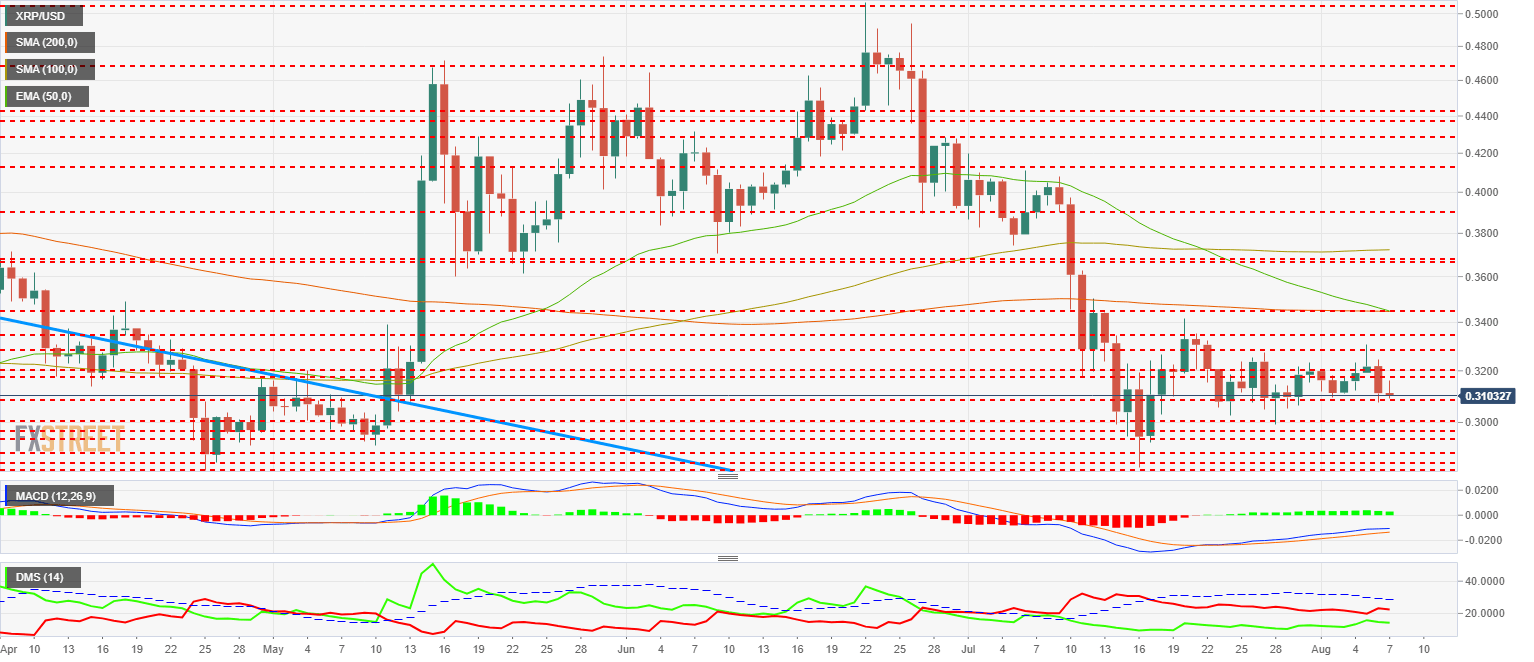
The MACD on the daily chart is losing its bullish cross. The profile is fragile, and cannot exclude falls in the short term.
The DMI on the daily chart is giving mixed signals. On the bearish side, the bears keep control and distance themselves from the bulls again. The buyers show a continuous increase in trend strength since July 25th.
Get 24/7 Crypto updates in our social media channels: Give us a follow at @FXSCrypto and our FXStreet Crypto Trading Telegram channel
Author

Tomas Salles
FXStreet
Tomàs Sallés was born in Barcelona in 1972, he is a certified technical analyst after having completing specialized courses in Spain and Switzerland. He expanded his technical training following the guidance of great experts on the financial markets.



