- Bitcoin's rises take cryptos to the limit of a new bear market.
- Ethereum reacts and recovers positions saving the match ball.
- XRP comes into play with early morning hikes.
Today, my country celebrates the day of "Sant Jordi," a day of culture in which people give each other books and roses, world-class authors sign books in the streets and florists strive to present the most beautiful roses in the world.
Well, it seems that the main protagonists of the crypto-board are working on a suspense masterpiece, sending the ETH/BTC pair to the limit of an absolute disaster, looking for a base extension level below which there is nothing. Well, if there is something, it will be bad. Like every self-respecting suspense story, the walk on edge has been quick, has brought the right dose of panic and has quickly turned back to a more reasonable level.
The plot has gone through Bitcoin attacking the $5,600 price level while Ethereum did not react, a move we saw on April 2nd as well. After reaching the minimum support, ETH/USD has responded to the upside at the right time to save the situation and is currently moving around $176.
The theory indicates that it is in these tense moments, where emotions rule, it is necessary to act. Overcoming uncertainty has a reward, and now it is peak opportunity. If the market does not firmly defend the current level in the ETH/BTC pair, the consequences will be severe for the ERC20 family and contagious for the market in general.
ETH/BTC 4 Hours Chart
The ETH/BTC pair is currently trading at the price level of 0.0317, after having set 0.0310 as the minimum of the squeeze that has pushed things to the limit. The rapid recovery of Ethereum’s price against Bitcoin allows us to see the green in the current candle, but it is necessary to wait for the closing of the candle to confirm that the match has been saved.
Above the current price, the first resistance level is at 0.0332 (price congestion resistance and upper parallel trendline). The second resistance level is at 0.0343 (second upper parallel trendline). The third resistance level for the ETH/BTC pair is at 0.035 (price congestion resistance).
Below the current price support options are scarce. The first support level for the ETH/BTC pair is at 0.0316 (price congestion support). The second support level is at 0.0315 (lower parallel trendline), then the third support level, the last of the scenario is at 0.0309 (lower parallel trendline).
-636916070758239242.png)
The MACD on the four-hour chart presents a bearish profile, with little downtrend and proper line spacing. It is an ambiguous profile that can both lead to a bullish turn and deepen the bearish moment.
The DMI on the four-hour chart shows bears rising as bulls weaken and go below the ADX line. If this structure is consolidated, the weakness in Ethereum will persist.
BTC/USD 4 Hour Chart
BTC/USD is currently trading at $5,546, after hitting an intraday high of $5.632. Bitcoin manages with the movement against the U.S. dollar to overcome the resistance at the price congestion at $5,500 but failing in the attempt to recover the ground of the long-term bearish channel.
Above the current price, the first resistance level is at $5,616 (base of the long term bearish channel on the daily chart). So the second resistance level for BTC/USD is at $5,870 (price congestion resistance), and the third resistance level is at $6,200 (price congestion resistance).
Below the current price, the first support level is at $5,500 (price congestion support), then the second support level is at $5,240 (confluence of the EMA50 and the SMA100). The third support level for the BTC/USD pair is at $4,740 (SMA200).
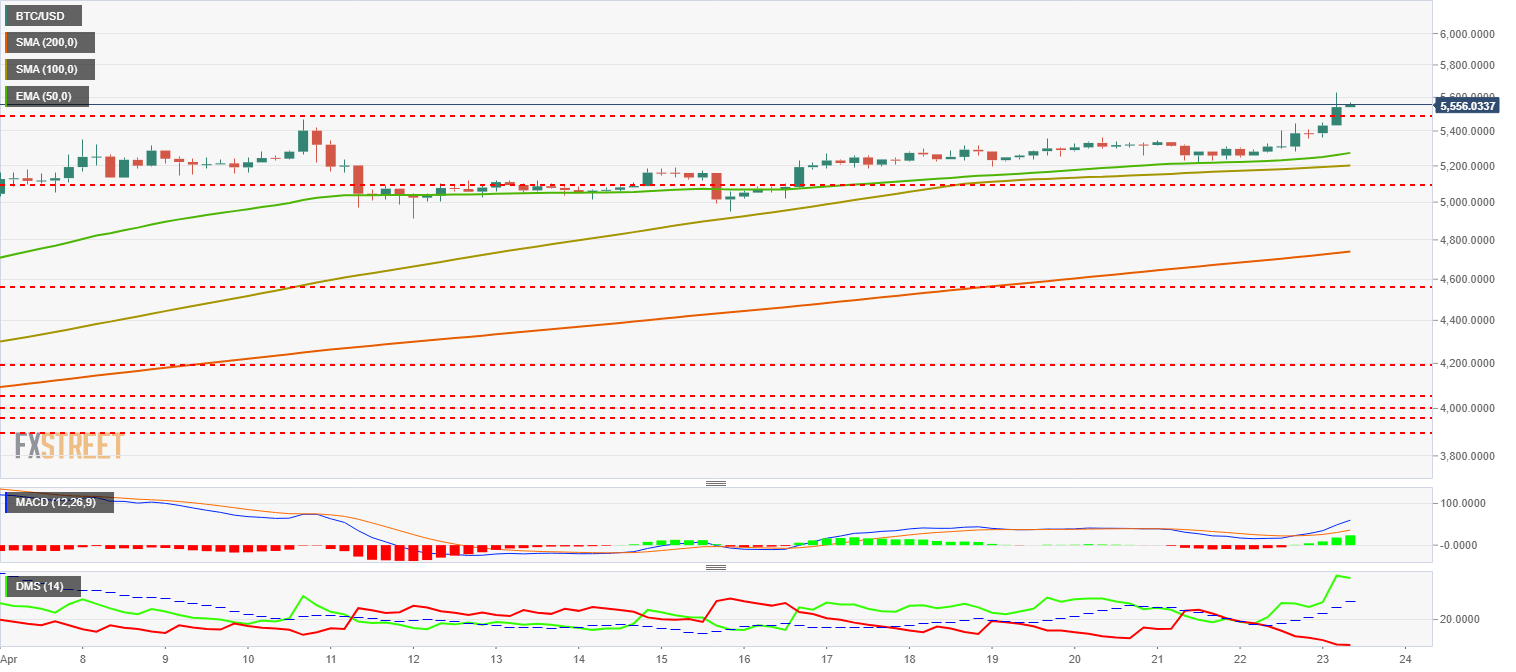
The MACD on the four-hour chart shows a remarkable, bullish profile with good line spacing. It is a continuing profile that presents some risk of price falls to regulate extremes.
The DMI on the four-hour chart shows the bulls dominating the situation, while the bears go to minimum levels. There is a risk of price falls to regulate bullish extremes.
ETH/USD 4 Hour Chart
The ETH/USD is currently trading at $177 following the bullish reaction to the ETH/BTC disaster.
Above the current price the first resistance level is at $180 (price congestion resistance), then the second resistance level is at $190 (price congestion resistance). The third resistance level for ETH/USD is at $193 (price congestion resistance).
Looking down, the first support level is at $170 (confluence of the EMA50 and the SMA100), then the second support level for the ETH/USD pair is at $162 (price congestion support). The third level of support is at $158 (SMA200).
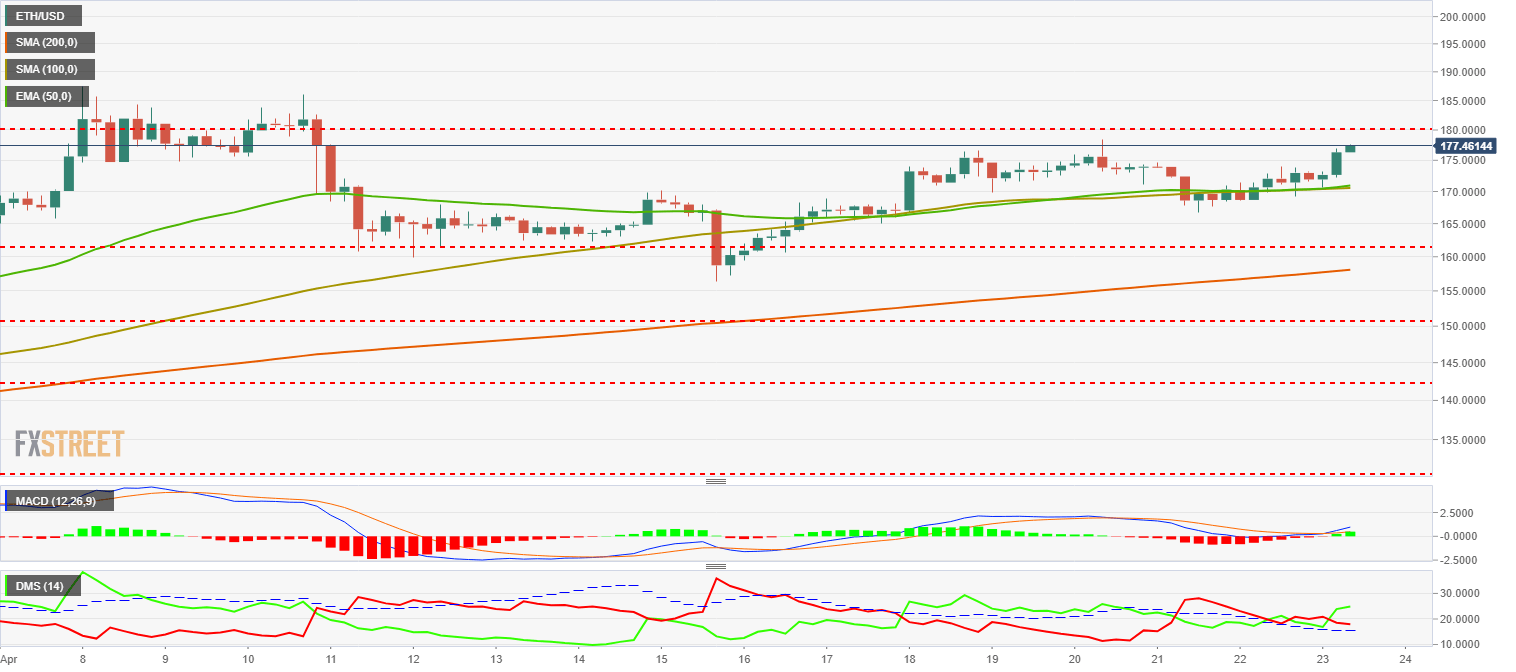
The MACD on the 4-hour chart shows a recent bullish cross just above the neutral line of the indicator. The averages that make up the indicator are barely open or inclined due to their recent formation. The structure is potentially bullish but needs confirmation.
The DMI on the 4-hour chart shows the bulls in control of the situation. The bears are kept at low levels but still above the ADX. It is a potentially bullish structure yet to be confirmed.
XRP/USD 4 Hour Chart
XRP/USD is currently trading at the $0.329 price level, showing some bullish muscle after finding support at the $0.3175 level over the weekend.
Above the current price, the first resistance level is at $0.335 (SMA100 confluence and price congestion resistance), then the second resistance level is at $0.366 (price congestion resistance), and the third resistance level is at $0.390 (price congestion resistance).
Below the current price, the first support level is $0.317 (price congestion support), then the second support level for the XRP/USD pair is $0.309 (price congestion support). The third support level is $0.30 (price congestion support).
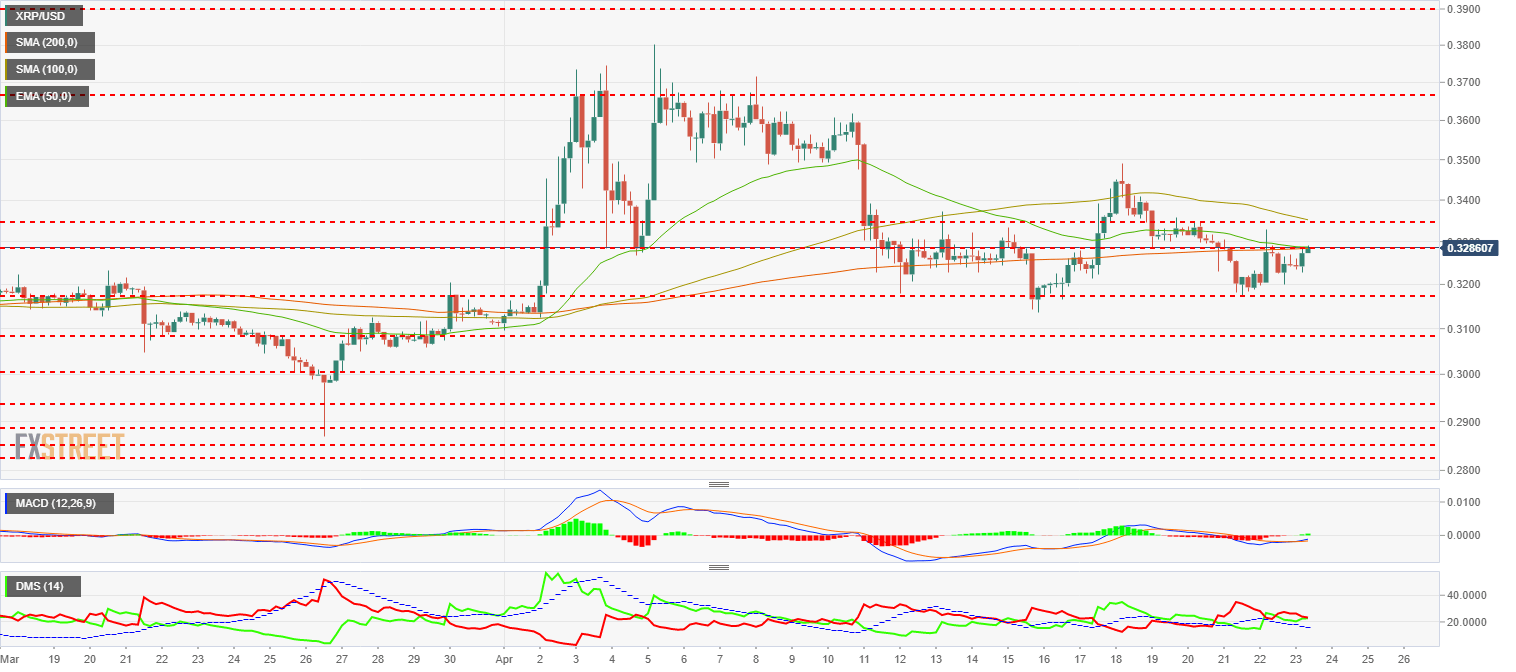
The MACD on the four-hour chart shows a bullish cross structure coming from the negative side of the indicator. It is a figure of possible medium-term bullish development.
The DMI on the four-hour chart shows an absolute tie between bulls and bears. The encounter between both sides of the market occurs above level 20, which would allow the winning side to pick up speed quickly.
Get 24/7 Crypto updates in our social media channels: Give us a follow at @FXSCrypto and our FXStreet Crypto Trading Telegram channel
Information on these pages contains forward-looking statements that involve risks and uncertainties. Markets and instruments profiled on this page are for informational purposes only and should not in any way come across as a recommendation to buy or sell in these assets. You should do your own thorough research before making any investment decisions. FXStreet does not in any way guarantee that this information is free from mistakes, errors, or material misstatements. It also does not guarantee that this information is of a timely nature. Investing in Open Markets involves a great deal of risk, including the loss of all or a portion of your investment, as well as emotional distress. All risks, losses and costs associated with investing, including total loss of principal, are your responsibility. The views and opinions expressed in this article are those of the authors and do not necessarily reflect the official policy or position of FXStreet nor its advertisers. The author will not be held responsible for information that is found at the end of links posted on this page.
If not otherwise explicitly mentioned in the body of the article, at the time of writing, the author has no position in any stock mentioned in this article and no business relationship with any company mentioned. The author has not received compensation for writing this article, other than from FXStreet.
FXStreet and the author do not provide personalized recommendations. The author makes no representations as to the accuracy, completeness, or suitability of this information. FXStreet and the author will not be liable for any errors, omissions or any losses, injuries or damages arising from this information and its display or use. Errors and omissions excepted.
The author and FXStreet are not registered investment advisors and nothing in this article is intended to be investment advice.
Recommended Content
Editors’ Picks
TRON gains 10% in 2024, supply of stablecoins reaches over $50 billion in Q1

TRON, a blockchain-based digital platform, has seen positive growth in the first quarter of 2024, as seen in a Messari report. TRON noted gains across several metrics like market capitalization, revenue and total value locked.
XRP hovers near $0.50 as Ripple CTO addresses concerns related to stablecoin launch

XRP is hovering near $0.53 on Friday, spending nearly all week below $0.55. Ripple CTO David Schwartz addressed concerns on stablecoin and XRP utility on Thursday.
Terraform Labs set to restrict access for users in the US after recent ruling in SEC lawsuit

Blockchain company Terraform Labs said Thursday that it will restrict access to some of its products and services for US-based users as it expects to receive a court order soon in light of its legal battle against the US Securities and Exchange Commission (SEC).
Bitcoin Weekly Forecast: BTC’s next breakout could propel it to $80,000 Premium

Bitcoin’s (BTC) recent price consolidation could be nearing its end as technical indicators and on-chain metrics suggest a potential upward breakout. However, this move would not be straightforward and could punish impatient investors.
Bitcoin: BTC’s next breakout could propel it to $80,000 Premium
Bitcoin’s (BTC) recent price consolidation could be nearing its end as technical indicators and on-chain metrics suggest a potential upward breakout. However, this move would not be straightforward and could punish impatient investors.