Top 3 Price Prediction Bitcoin, Ripple, Ethereum: BTC/USD rocket burns phases and points already above $17,000
- Only three levels of resistance separate the King from historical highs.
- ETH collapses in front of BTC and strains the Alt market.
- XRP remains disconnected from the market and puts nervousness among its supporters.

Today is the fourth day with Bitcoin hovering around $11,000, a level unimaginable for many just a few months ago.
Human beings quickly forget and always doubt that past actions have a decisive impact on future situations, but Bitcoin is doing what it did in 2017, climbing steadily and without giving the late investor time to join the trend in "safe" conditions - the perfect breeding ground for FOMO ("Fear of Missing Out") syndrome.
The environment is anxiously awaiting the Alt season, while the purist Bitcoiners are delighted with King Bitcoin's supremacy and leadership.
The Ethereum continues to take advantage of the wake left by Bitcoin to continue to rise, but rejecting, for now, every opportunity it has had to take the lead and bring the market into hyperspace mode. It seems, as we will see in the technical analysis, that the issue can be extended for a few days.
For its part, the XRP is in a technical configuration similar to the one it had in the hours before one of its typical upward explosions. The reliability of the behavior patterns will also be tested in this case.
A final note before moving on to pure technical analysis. Analyst Thomas Lee - founder of Fundstrat Global - published a tweet:
Just an observation, but if $BTC re-attains its all-time high this year, it is only 18-20 months from prior high.
When a market re-attains a high so quickly, one could argue the prior high was not a bubble after all.
Hmmmm
— Thomas Lee (@fundstrat) 22 de junio de 2019
ETH/BTC Daily Chart
The ETH/BTC pair, a thermometer of the relationship between Altcoins and Bitcoin, continues to crush Alts forks mercilessly. This situation was already present in 2017 and, as now, it stressed the traders' emotional system to the maximum.
ETH/BTC is currently trading at the price level of 0.02756 after reaching the price congestion support level of 0.02753.
Above the current price, the first resistance level is at 0.029 (price congestion resistance and EMA50), then the second at 0.030 (SMA100, price congestion resistance, and SMA200) and the third one at 0.0316 (price congestion resistance).
Below the current price, the first level of support is at 0.0273 (price congestion support), then the second at 0.0268 (price congestion support) and the third one at 0.02549 (price congestion support).

The MACD on the four-hour chart shows an almost divergent structure in the short term. The decline is likely to accelerate in the next few days.
The DMI on the 4-hour chart shows bears dominating the asset but with a structure that fits into a trend ending rather than a continuation. The bulls, on the other hand, go to an extreme negative level and move in an area conducive to bullish rebounds.
BTC/USD Daily Chart
Just 6 days ago, the BTC/USD pair managed to break up the price congestion resistance by $9,150. In those six days, it has flown higher and today is presented above $11,000 to defeat the price congestion resistance at $11,250. Above that level at the daily close, the rises will still accelerate further.
BTC/USD is currently quoted at the price level of $11,288. Above the current price, the first resistance level is at $14,000 (price congestion resistance), then the second at $17,190 (price congestion resistance) and the third one, the historic high at $19,810.
Below the current price, the first level of support is at $10,650 (price congestion support), then the second at $9,662 (price congestion support) and the third one at $9,150 (price congestion support).
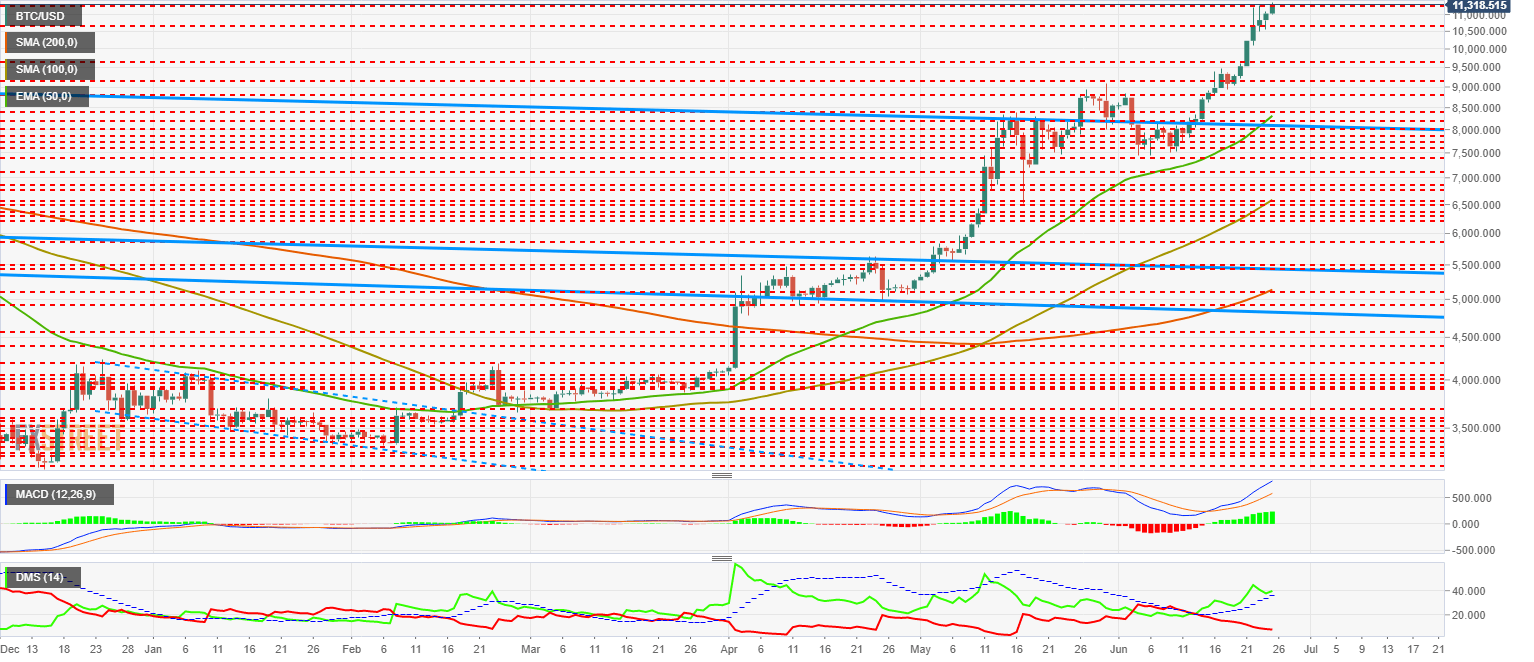
The MACD on the daily chart shows a very bullish profile. The rally has been so strong that the bearish divergence has been canceled out.
The DMI on the daily chart shows bulls controlling the market and set to continue rising. The bears go to minimum levels but not yet extreme, which leaves room for a bullish continuation.
My opinion is that there is a high probability that the BTC/USD pair will stay in this area for a while as Altcoins improve their behavior towards the King.
ETH/USD Daily Chart
The ETH/USD is currently trading at the $312.7 price level and appears to be falling below the $318 resistance (price congestion resistance).
Above the current price, the first resistance level is at $330 (price congestion resistance), then the second resistance level is at $355 (price congestion resistance), and the third one at $385 (price congestion resistance).
Below the current price, the first level of support is at $305 (price congestion support), then the second level of support at $290 (price congestion support) and the third one at $260 (price congestion support).
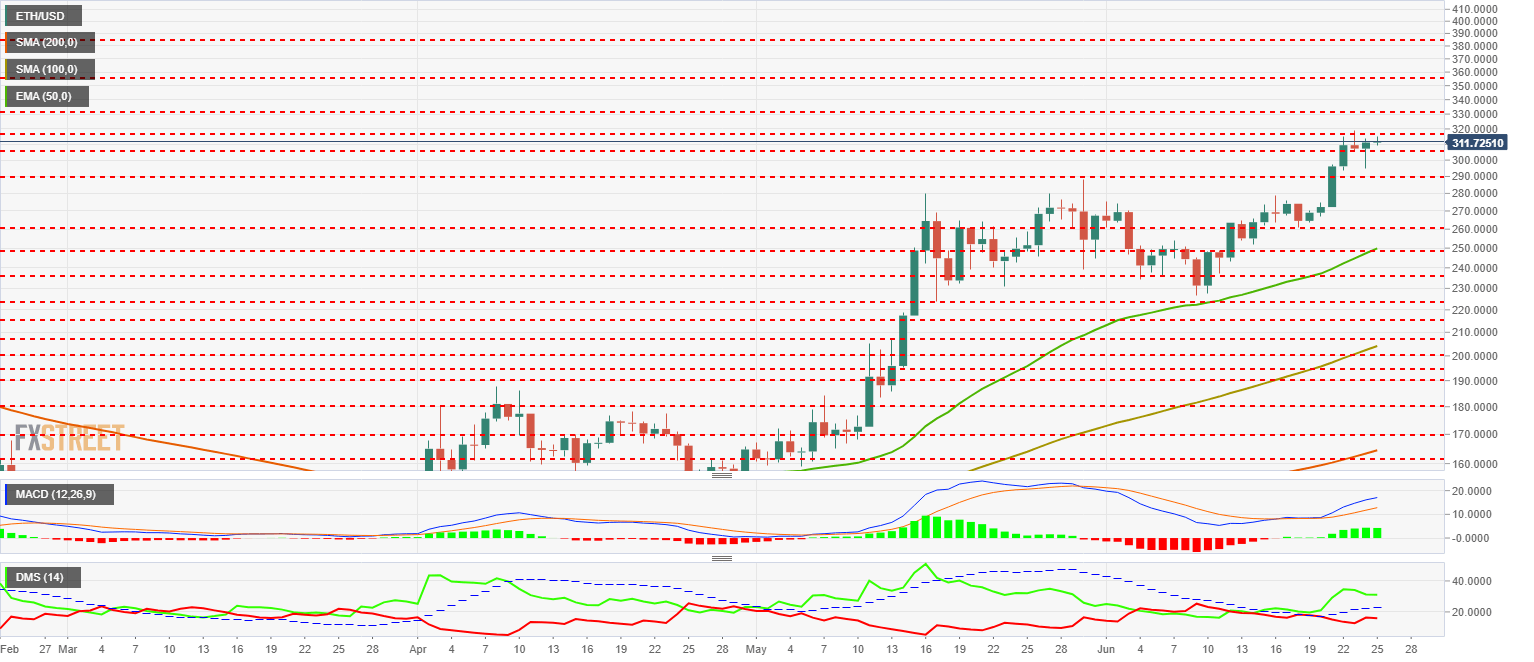
The MACD on the daily chart shows a bullish structure in development and is likely to continue to move higher.
The DMI on the daily chart shows bulls clearly dominating the asset. The D+ is clearly set higher. The bears have not yet given up, which explains the relative weakness of Ethereum against Bitcoin. It is the last stumbling block before seeing the market explode upwards.
XRP/USD Daily Chart
The XRP/USD pair is currently trading at the $0.4663 price level and momentarily loses support at $0.469.
Above the current price, the first resistance level is at $0.505 (price congestion resistance), then the second at $0.528 (price congestion resistance) and the third one at $0.548 (price congestion resistance).
Below the current price, the first support level is $0.44 (double price congestion support), then the second at $0.43 (price congestion support and EMA50) and the third one at $0.39 (price congestion support).
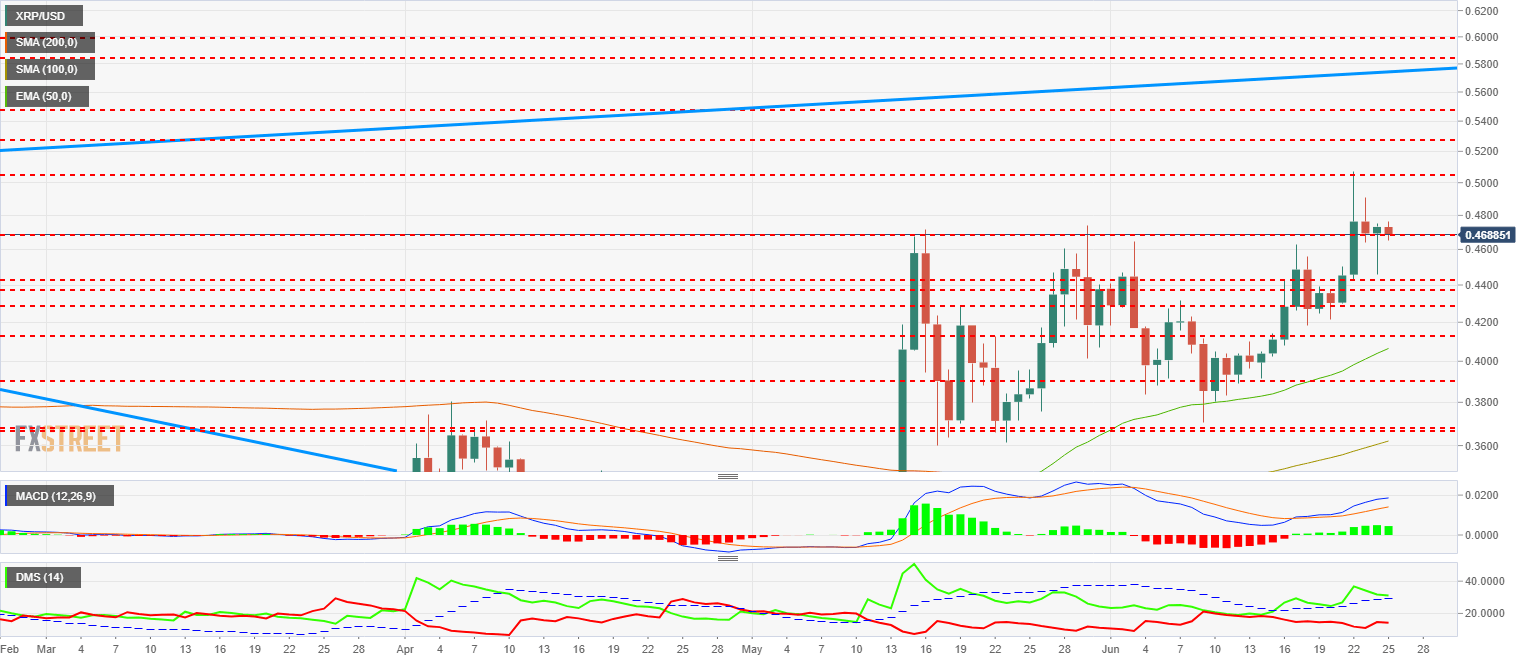
The MACD on the daily chart shows a less accelerated bullish profile than we have seen on the BTC or ETH. The most likely development is bullish continuity.
The DMI on the daily chart shows the bulls controlling the situation but at risk of crossing down the ADX line. How this point is resolved will define the development in the coming days.
Get 24/7 Crypto updates in our social media channels: Give us a follow at @FXSCrypto and our FXStreet Crypto Trading Telegram channel
Author

Tomas Salles
FXStreet
Tomàs Sallés was born in Barcelona in 1972, he is a certified technical analyst after having completing specialized courses in Spain and Switzerland. He expanded his technical training following the guidance of great experts on the financial markets.


