- Ethereum reasserts itself against Bitcoin and claims a heroic role.
- Bitcoin joins the rally but lacks guarantees of continuity.
- XRP stays put and waits for its moment.
The crypto market is beginning to see the effects of the upswing among the main Altcoins.
Their gains against Bitcoin during the Asian session have been remarkable, giving us a taste of what may be their usual behavior for the coming weeks.
The upward turning process is going to take a few days, as in periods of less than a day prices have hit the main moving averages.
There are two scenarios on the analysis panel. First, the market reacts as a whole, rallying with the Altcoins consistently dragging Bitcoin’s performance. In the second scenario, Bitcoin and the majority of Altcoins continue to move downward but outperforming Crypto-King.
The unpleasant news of the day is the security breach in Crypto's YouHolder loan platform, which has exposed sensitive data from thousands of users.
ETH/BTC Daily Chart
The pair is currently trading at 0.022 and is down from Wednesday’s high of 0.0224. This pair has been in a more bearish trend since January 2018, so consolidating a change of direction may take quite some time.
Above the current price, the first resistance level is at 0.0228 (price congestion resistance), then the second at 0.0253 (EMA50) and the third one at 0.027 (double price congestion resistance).
Below the current price, the first level of support is at 0.020 (price congestion support), then the second at 0.0155 (double price congestion support). There is no notable third level of support, and drilling the second support down could bring the market to the brink of collapse.
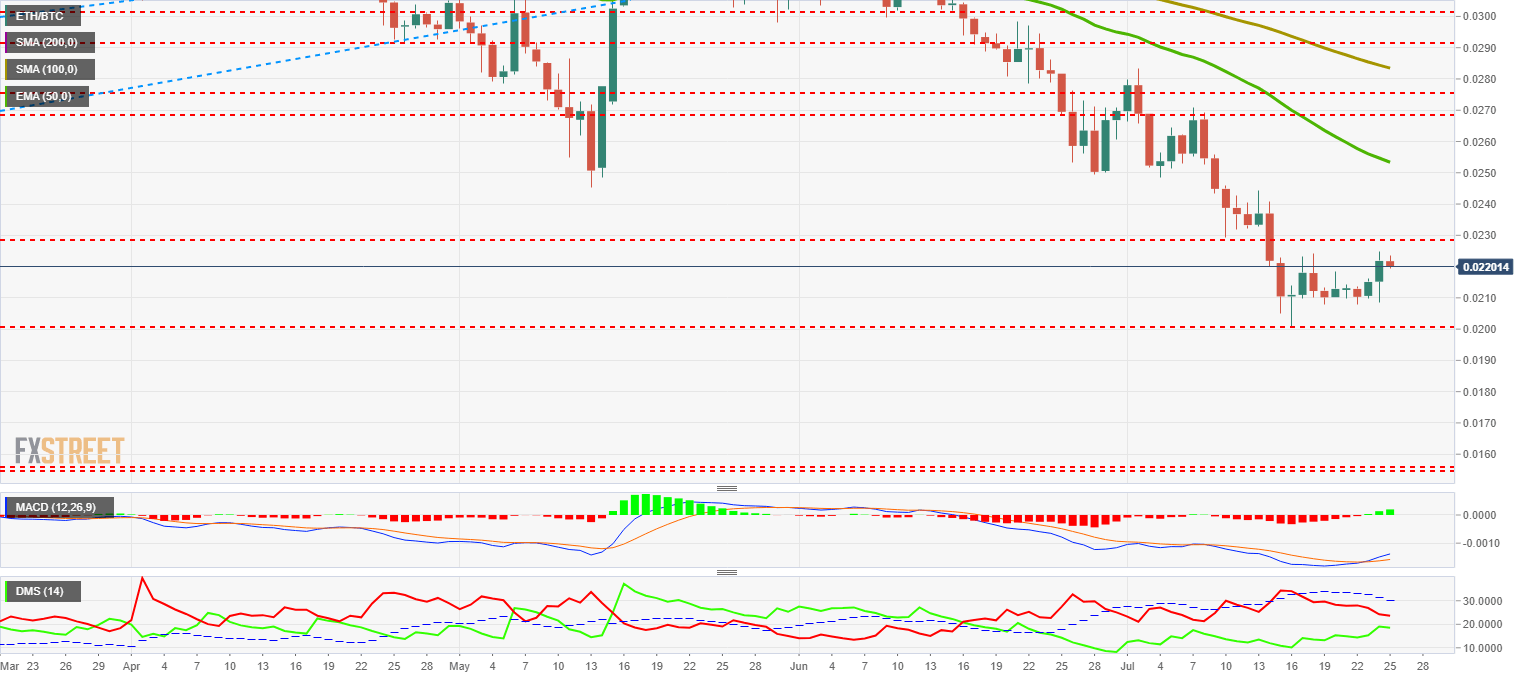
The MACD on the daily chart shows a perfect bullish cross. It has a long way to go up without any obstacle, which augurs weeks, if not months, of bullish strength.
The DMI on the daily chart shows the bulls have not yet managed to take the lead from the bears. The meeting between both sides of the market will take place in the coming days and will provide clarity for the coming months.
BTC/USD Daily Chart
The BTC/USD pair is currently trading at the $10.099 price level and is affected by the upward movements of the Altcoins.
Today's move has stopped at the level of the EMA50 while technical indicators continue to point downwards, so the chances of moving up the exponential average are low.
Above the current price, the first resistance level is at $10,090 (EMA50), then the second at $10,800 (price congestion resistance) and the third one at $11,250 (price congestion resistance).
Below the current price, the first level of support is at $9,650 (price congestion support), then the second at $9,150 (price congestion support) and the third one at $8,800 (price congestion support).
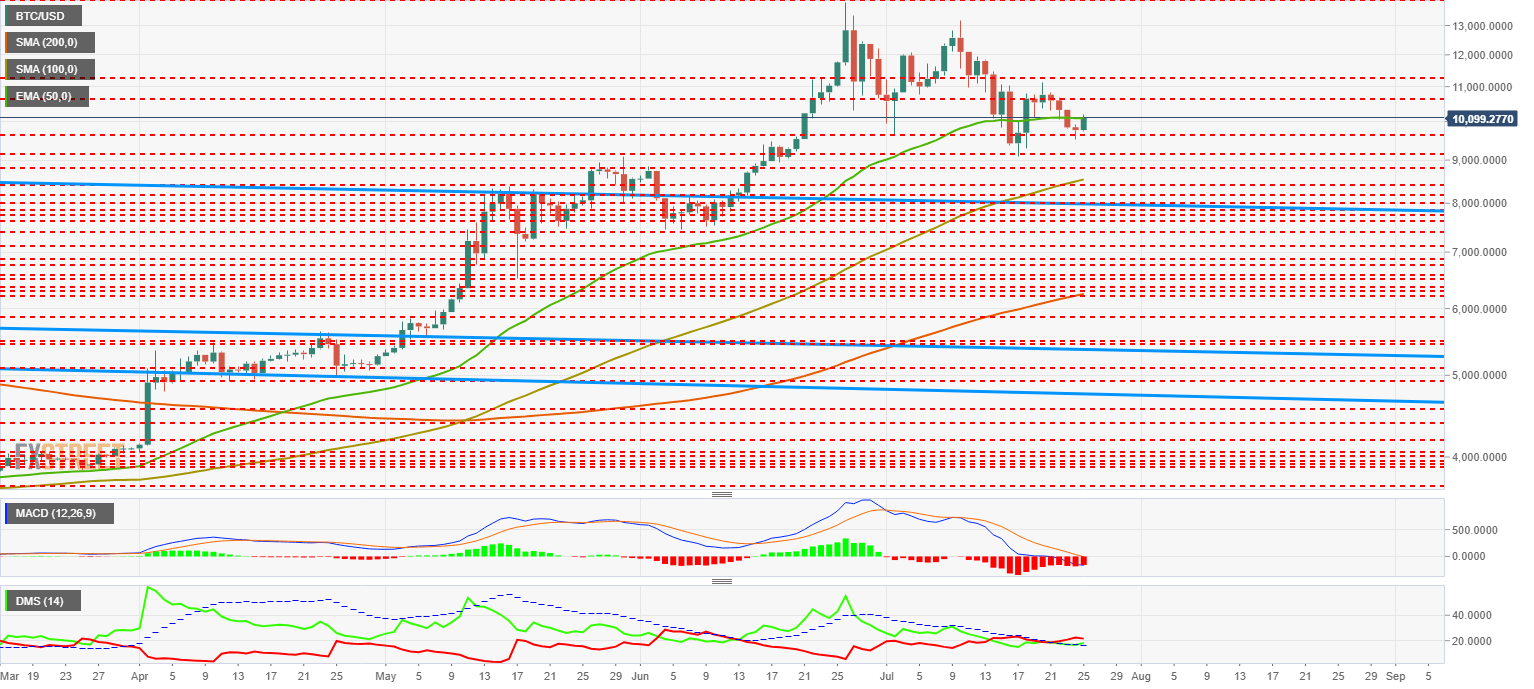
The MACD on the daily chart shows a bearish profile that fully enters the negative zone of the indicator. The most likely development is bearish continuity. This scenario will change if the indicator crosses higher and enters the positive region of the indicator.
The DMI on the daily chart shows bears with a small advantage over bulls — both sides of the market move above the ADX line, which increases the chances of increased volatility.
ETH/USD Daily Chart
ETH/USD is currently trading at $222.6 and is struggling with the price congestion resistance of $225 that it has managed to break earlier today.
As we will see later, Ethereum’s situation is typical of the moments before a bullish turn.
Above the current price, the first resistance level, beyond $225, is at $235 (SMA100 and price congestion resistance), then the second at $248 (EMA50 and price congestion resistance) and the third one at $260 (price congestion resistance).
Below the current price, the first level of support is at $215 (price congestion support), then the second at $207 (price congestion support) and the third one at $200 (price congestion support).
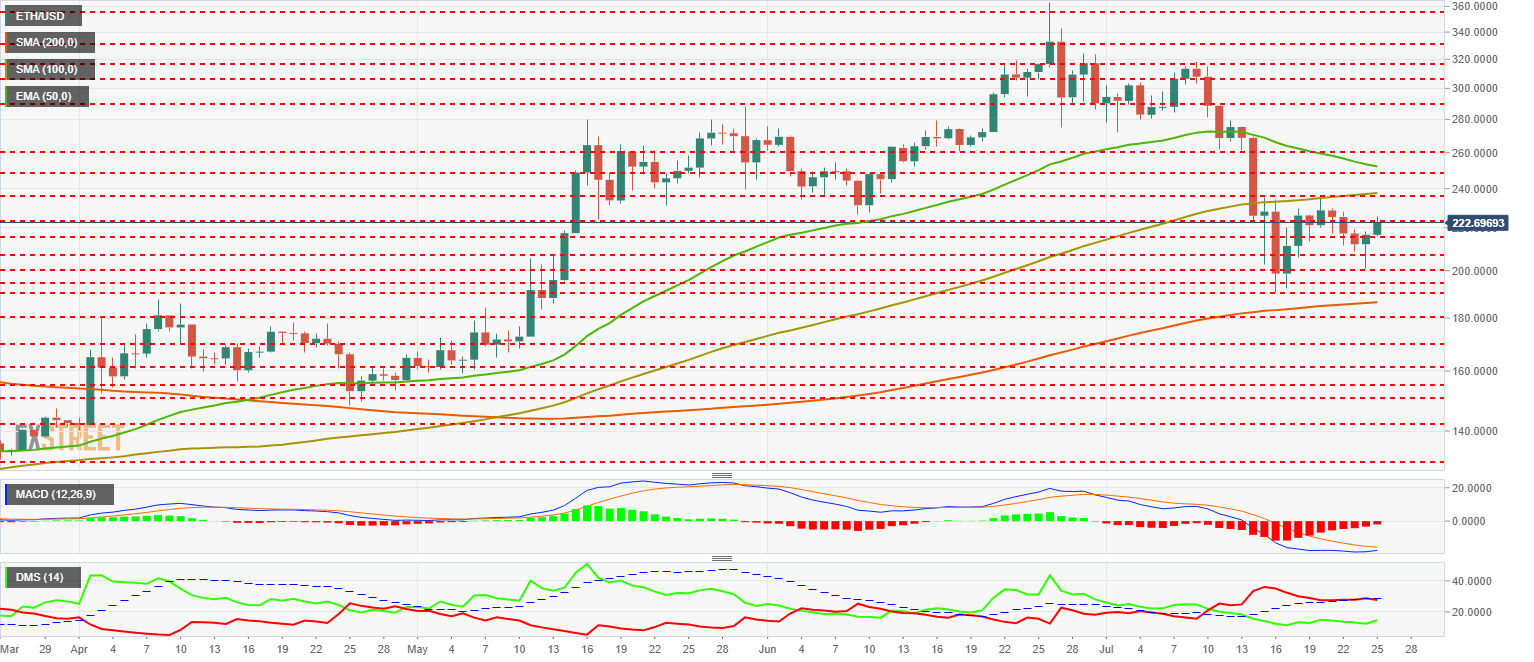
The MACD on the daily chart shows how the fast average goes straight to a bullish cross of the slow average. The first attempt will most likely fail, there will be a move to the low terminal, and then it will cross up and continue its way to new annual highs.
The DMI on the daily chart shows how bears still rule the pair. The bulls react well to today's highs and are on their way to snatch leadership from the selling side. The moment in which the two sides of the market meet is the ideal moment to generate volatility.
XRP/USD Daily Chart
XRP/USD is trading at $0.3179 and is struggling to overcome the double price congestion resistance of $0.32.
Above the current price, the first resistance level is at $0.329 (price congestion resistance), then the second at $0.334 (price congestion resistance) and the third one at $0.345 (SMA200 and price congestion resistance).
Below the current price the first level of support is $0.308 (price congestion support), then the second at $0.30 (price congestion support) and the third one at $0.295 (price congestion support).
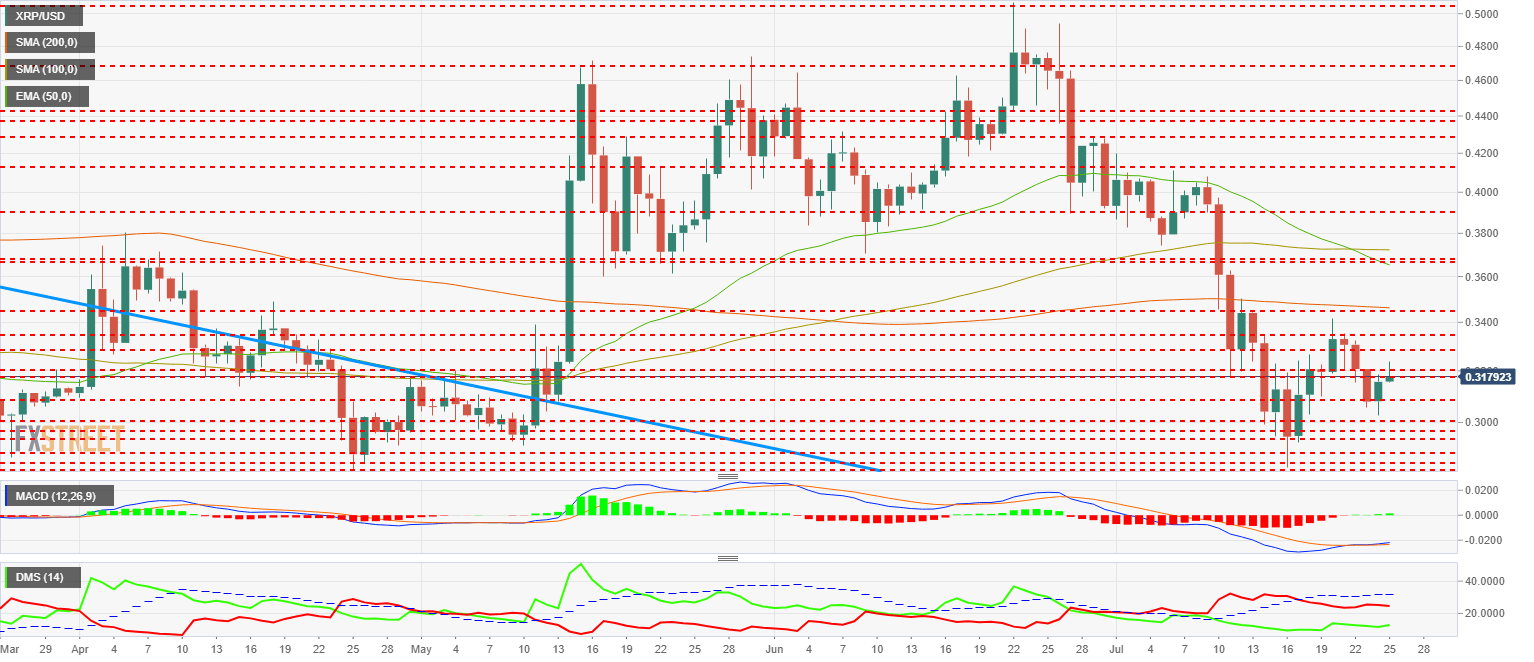
The MACD on the daily chart shows a bullish cross profile at an early stage. The potential for bullish development is enormous, with the doubt remaining as to when it will occur, not whether it will.
The DMI on the daily chart shows bears leading but they are on a collision trajectory with bulls. This crossing process can take several days to complete.
Get 24/7 Crypto updates in our social media channels: Give us a follow at @FXSCrypto and our FXStreet Crypto Trading Telegram channel
Information on these pages contains forward-looking statements that involve risks and uncertainties. Markets and instruments profiled on this page are for informational purposes only and should not in any way come across as a recommendation to buy or sell in these assets. You should do your own thorough research before making any investment decisions. FXStreet does not in any way guarantee that this information is free from mistakes, errors, or material misstatements. It also does not guarantee that this information is of a timely nature. Investing in Open Markets involves a great deal of risk, including the loss of all or a portion of your investment, as well as emotional distress. All risks, losses and costs associated with investing, including total loss of principal, are your responsibility. The views and opinions expressed in this article are those of the authors and do not necessarily reflect the official policy or position of FXStreet nor its advertisers. The author will not be held responsible for information that is found at the end of links posted on this page.
If not otherwise explicitly mentioned in the body of the article, at the time of writing, the author has no position in any stock mentioned in this article and no business relationship with any company mentioned. The author has not received compensation for writing this article, other than from FXStreet.
FXStreet and the author do not provide personalized recommendations. The author makes no representations as to the accuracy, completeness, or suitability of this information. FXStreet and the author will not be liable for any errors, omissions or any losses, injuries or damages arising from this information and its display or use. Errors and omissions excepted.
The author and FXStreet are not registered investment advisors and nothing in this article is intended to be investment advice.
Recommended Content
Editors’ Picks
TRON gains 10% in 2024, supply of stablecoins reaches over $50 billion in Q1

TRON, a blockchain-based digital platform, has seen positive growth in the first quarter of 2024, as seen in a Messari report. TRON noted gains across several metrics like market capitalization, revenue and total value locked.
XRP hovers near $0.50 as Ripple CTO addresses concerns related to stablecoin launch

XRP is hovering near $0.53 on Friday, spending nearly all week below $0.55. Ripple CTO David Schwartz addressed concerns on stablecoin and XRP utility on Thursday.
Terraform Labs set to restrict access for users in the US after recent ruling in SEC lawsuit

Blockchain company Terraform Labs said Thursday that it will restrict access to some of its products and services for US-based users as it expects to receive a court order soon in light of its legal battle against the US Securities and Exchange Commission (SEC).
Bitcoin Weekly Forecast: BTC’s next breakout could propel it to $80,000 Premium

Bitcoin’s (BTC) recent price consolidation could be nearing its end as technical indicators and on-chain metrics suggest a potential upward breakout. However, this move would not be straightforward and could punish impatient investors.
Bitcoin: BTC’s next breakout could propel it to $80,000 Premium
Bitcoin’s (BTC) recent price consolidation could be nearing its end as technical indicators and on-chain metrics suggest a potential upward breakout. However, this move would not be straightforward and could punish impatient investors.