Top 3 Price Prediction Bitcoin, Ethereum, XRP: Crypto bulls continue to hold, but for how long?
- Bitcoin price consolidation continues, bear still in control but bulls defending strongly.
- Ethereum price action is overwhelmingly bearish, but sellers can’t shake off buyers.
- XRP price enters a make-or-break zone, giving equal weight to bulls and bears for the likelihood of a breakout.

Bitcoin price continues to consolidate. Ethereum price confirms, again, a major Ichimoku short entry condition. XRP price consolidation gives longs and shorts opportunities for profit.
Bitcoin price continues to vex bears, but a fall is not far away
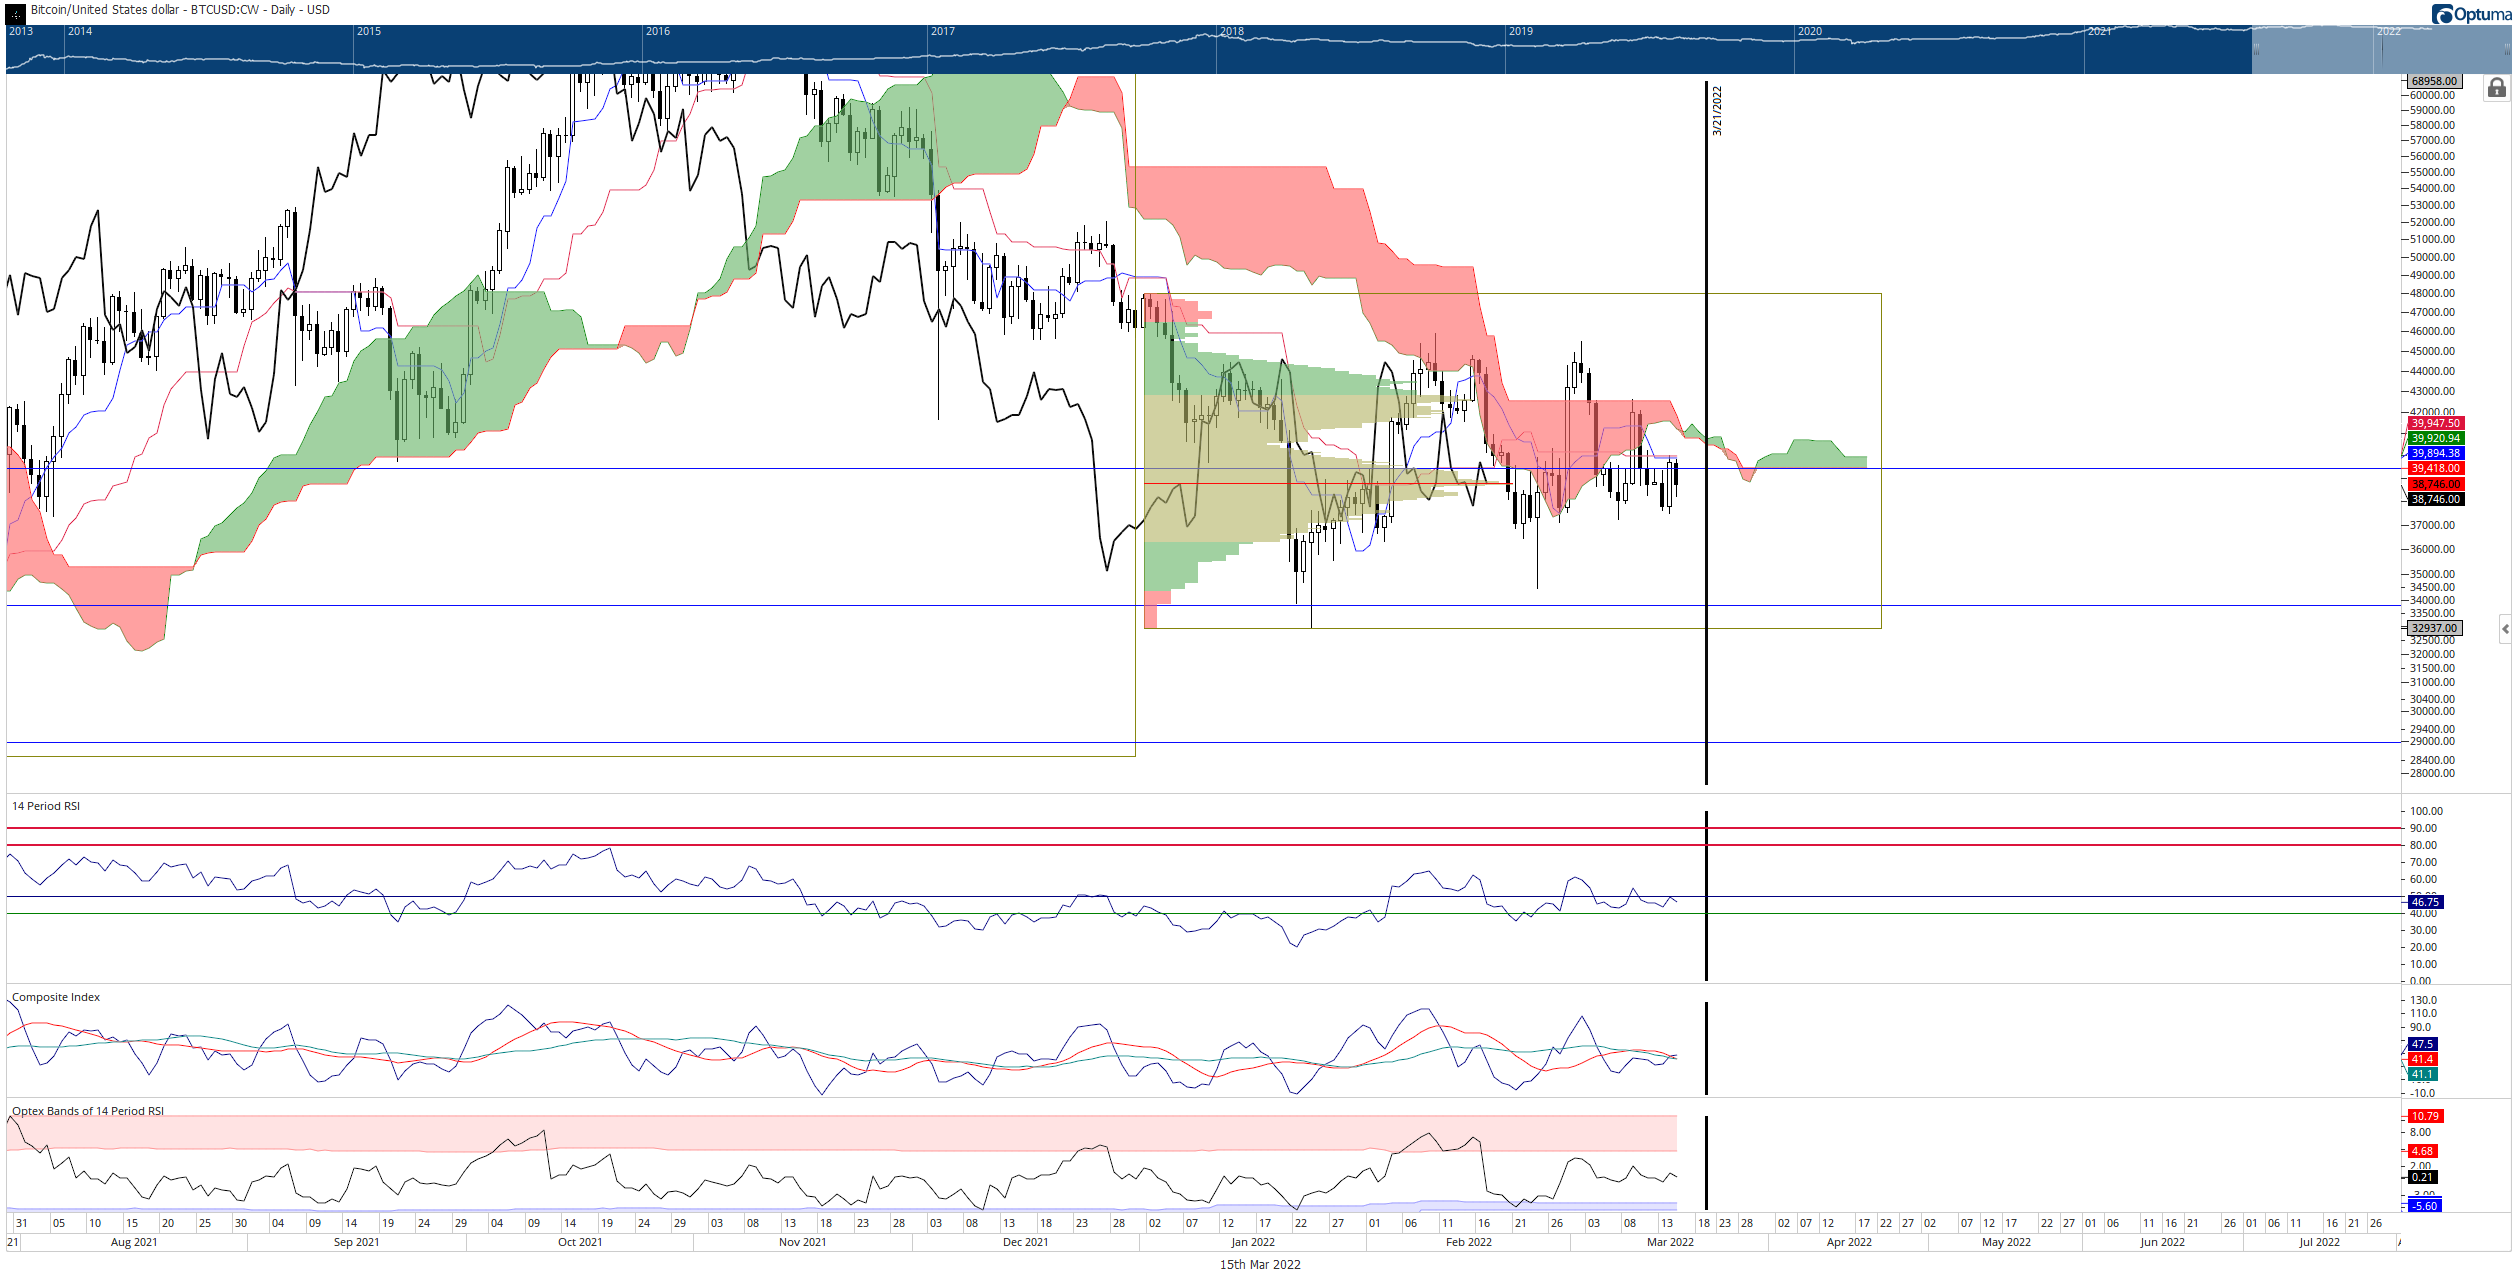
Bitcoin price action has seen many whipsaws over the past thirty days. Multiple attempts to push Bitcoin lower have been attempted. Similarly, many attempts to return Bitcoin to bullish conditions have also been attempted and rejected.
It is decidedly bearish given where Bitcoin currently sits within the Ichimoku Kinko Hyo system. However, the threshold needed to convert Bitcoin price into a bull market has dropped markedly. As a result, the Ichimoku Cloud has become very thin starting today. Thin Ichimoku Clouds represent weakness. This means that if Bitcoin price can close above the Tenkan-Sen and Kijun-Sen, at or above $40,125, it should have an easy time breaking out above the Ichimoku Cloud.
BTC/USD Daily Ichimoku Kinko Hyo Chart
Bitcoin price needs to close at or above $44,600 to confirm an Ideal Bullish Ichimoku Breakout. The likely target before hitting any resistance is the $53,000 value area.
A daily close at or below $37,000 would confirm an Ideal Bearish Ichimoku Breakout and likely push Bitcoin price down to the June 2021 and July 2021 lows near $30,000.
Ethereum price shows bears having difficulty pushing ETH lower
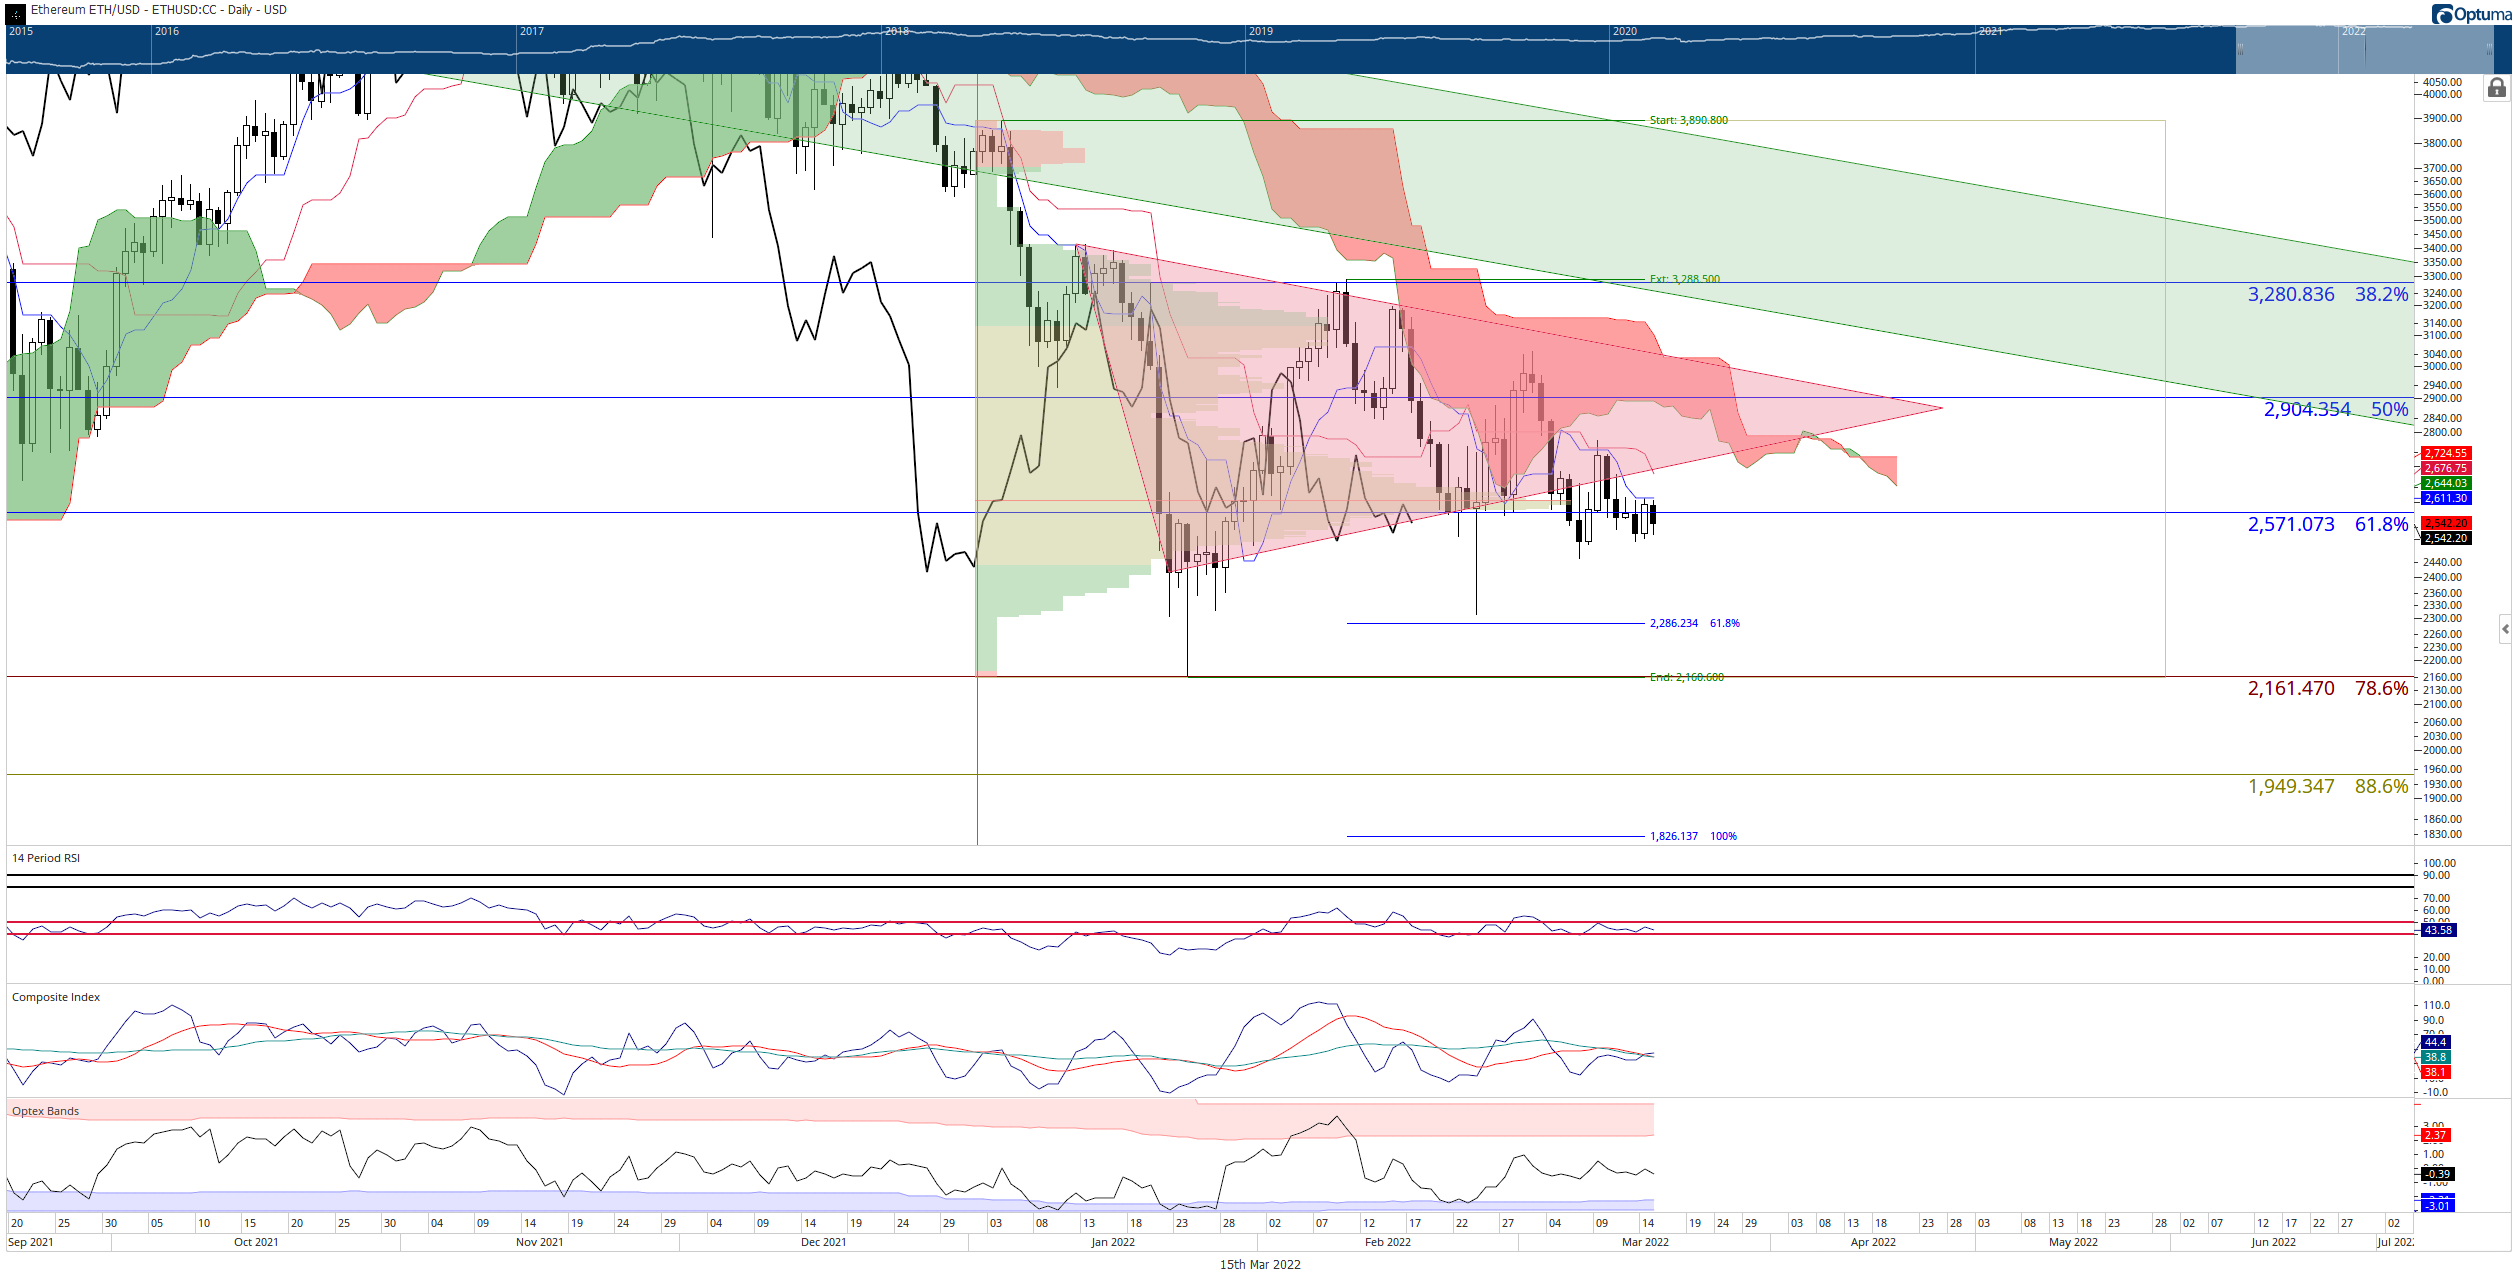
Ethereum price action, like Bitcoin’s, is overwhelmingly bearish on the daily Ichimoku chart. The overall structure and conditions of ETH mirror nearly all of Bitcoin’s, save one. Ethereum shows a confirmed Ideal Bearish Ichimoku Breakout.
However, despite the Ideal Bearish Ichimoku Breakout, Ethereum price has failed to collapse. Interestingly, ETH has triggered an Ideal Bearish Ichimoku Breakout eleven times since March 3. Nevertheless, bears are unable or unwilling to push ETH over the ledge.
Regardless of why Ethereum price is still holding in the $2,500 value area, there are zero technical reasons why it displays any strength. In addition to the Ideal Bearish Ichimoku Breakout confirmation, ETH is below the 2022 Volume Point Of Control, remains below the bearish pennant, and is now below the 61.8% Fibonacci retracement of the all-time high to the low of the strong bar on the weekly chart at $2,570.
ETH/USD Daily Ichimoku Kinko Hyo Chart
Downside risks for Ethereum price are likely limited to the June 2021 and July 2022 lows near the $1,800 value area.
Upside potential is probably capped at the top of the Ichimoku Cloud (Senkou Span B) and the upper trendline of the bearish pennant, both at $2,900.
XRP price could go either way; bulls and bears now wait
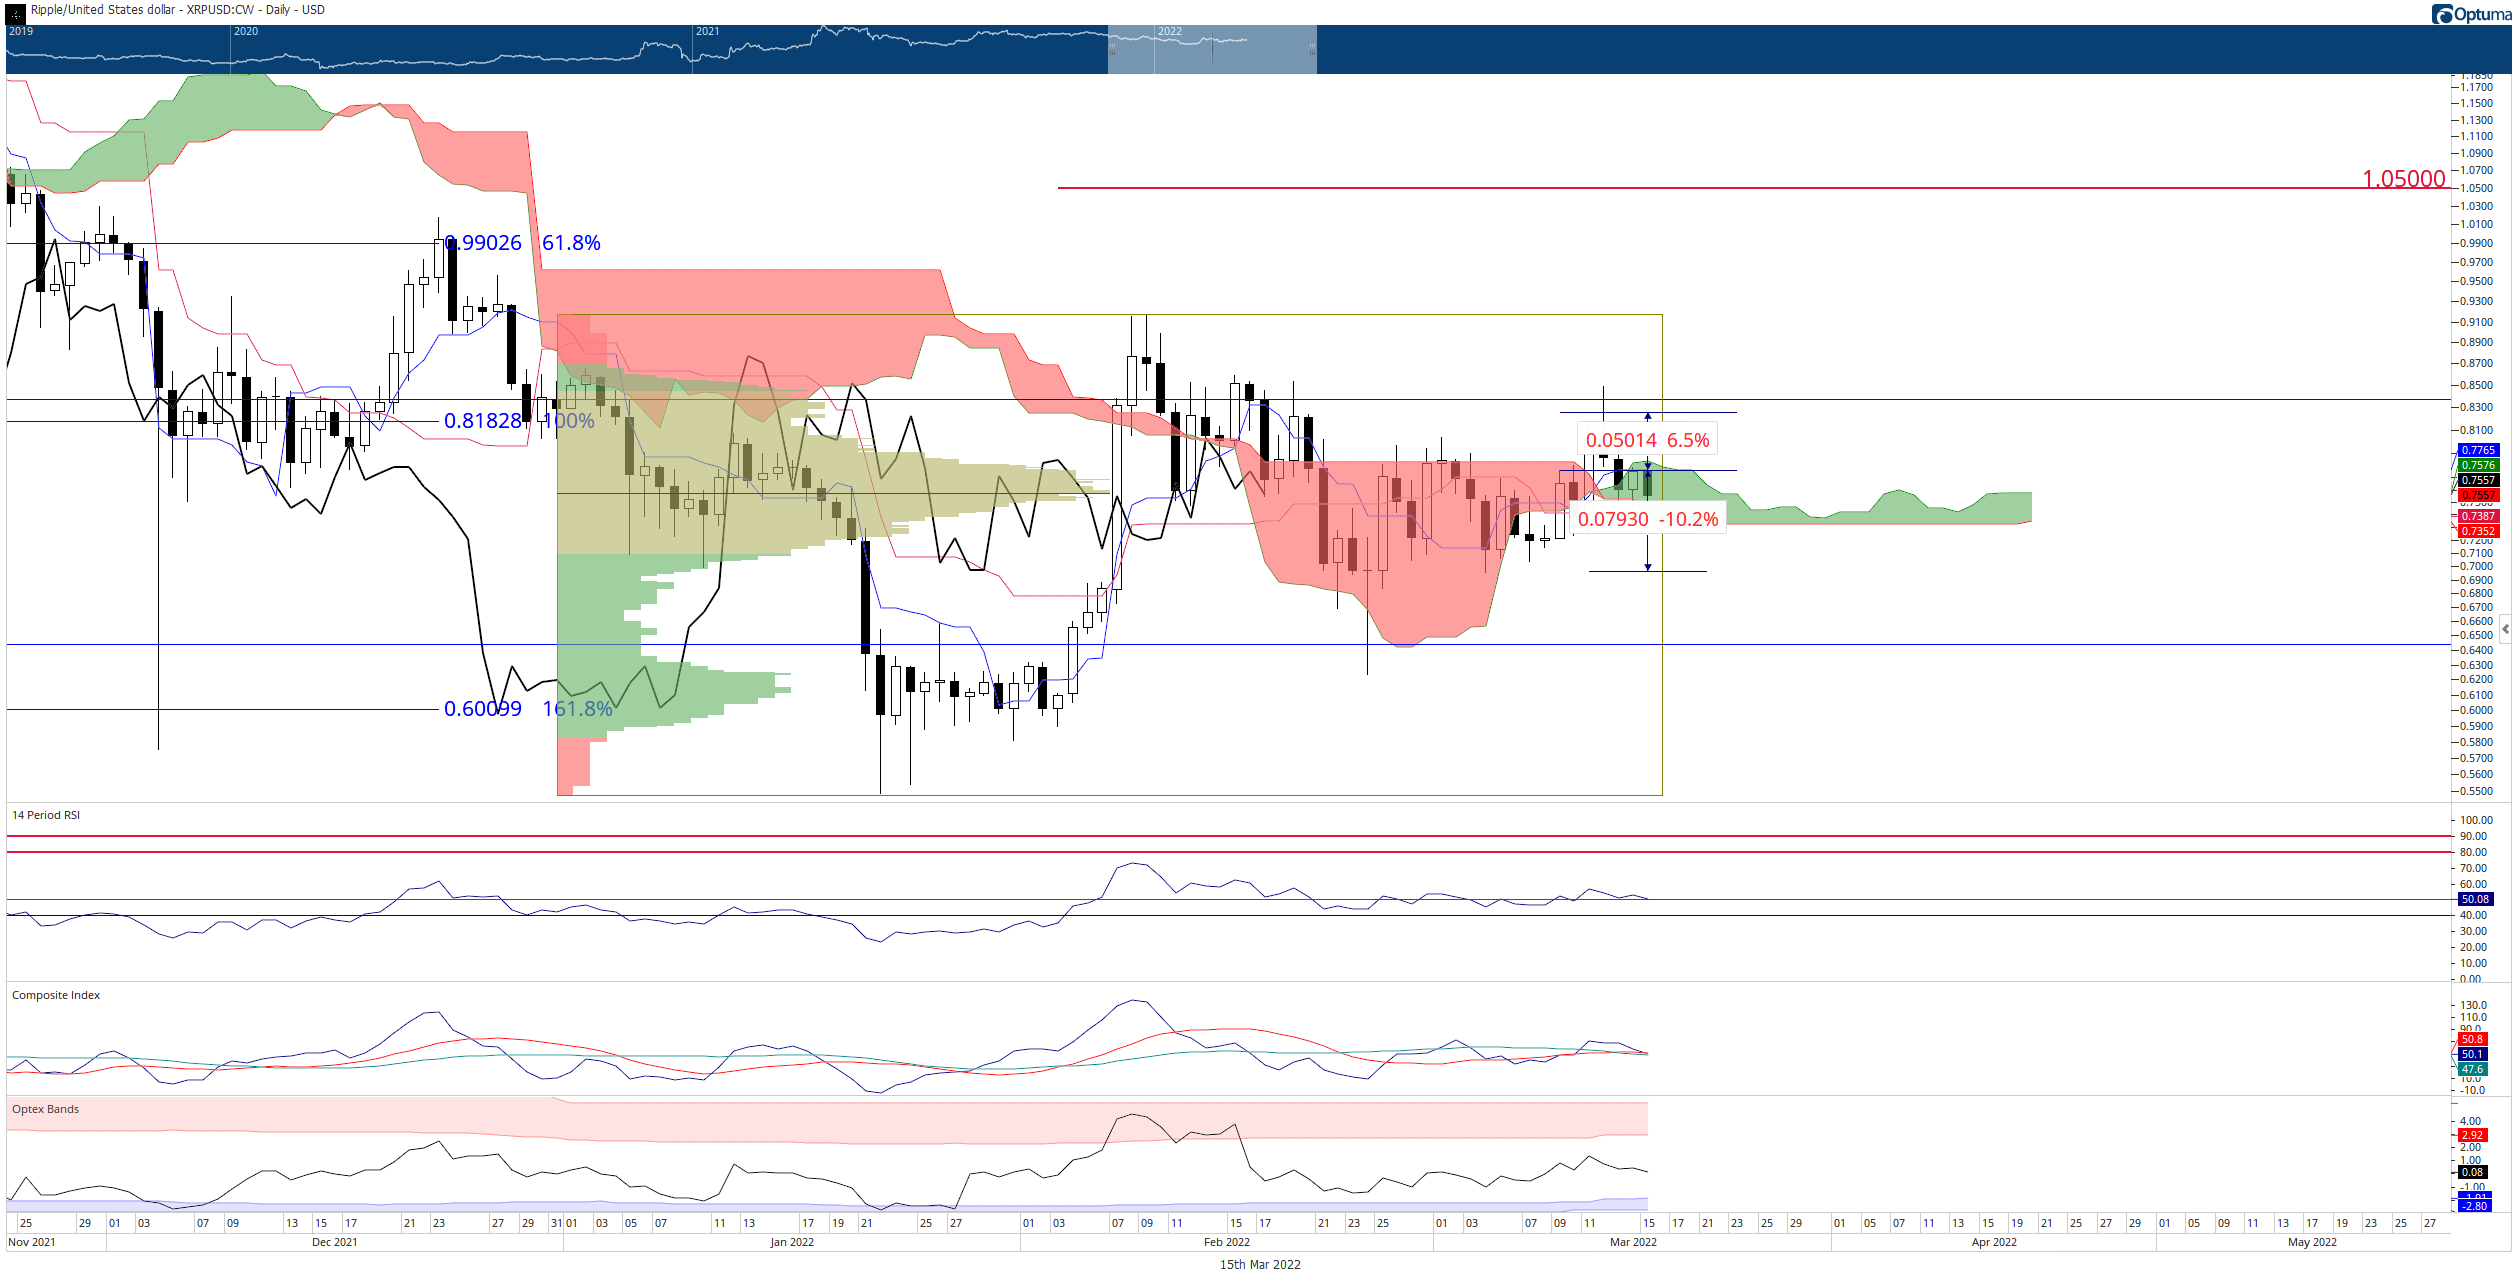
XRP price action shows very different trading conditions compared to BTC and ETH. The daily Ichimoku chart shows XRP stuck inside the Cloud. The $0.78 is the primary resistance level and contains the Tenkan-Sen and top of the Ichimoku Cloud (Senkou Span A). $0.73 contains the Kijun-Sen and bottom of the Cloud (Senkou Span B).
While the Cloud does represent volatility and indecision, there is a bias that has a higher probability of playing out than the other. The two strongest levels in the Ichimoku system, the Kijun-Sen and Senkou Span B, represent where bears need to close XRP price below to trigger an Ideal Bearish Ichimoku Breakout. However, the Chikou span would need to be in open space, meaning XRP needs a daily close at or below $0.695 – or 10% below the Tuesday open.
XRP/USD Daily Ichimoku Kinkon Hyo Chart
On the long side, the path is much easier. The Tenkan-Sen and Senkou Span A represent the weaker levels. To trigger an Ideal Bullish Ichimoku Breakout, XRP price needs a daily close at or above $0.825 – or 6.5% above the Tuesday open.
Upside potential for XRP price in the near term is likely limited to the $1.05 value area, and downside risks are limited to the $0.50 range.
Author

Jonathan Morgan
Independent Analyst
Jonathan has been working as an Independent future, forex, and cryptocurrency trader and analyst for 8 years. He also has been writing for the past 5 years.



