Solana Price Forecast: SOL declines amid bearish signals, blockchain remains stable under DDoS attack
- Solana drops over 1% on Tuesday, risking the $126 support level with the third straight bearish candle.
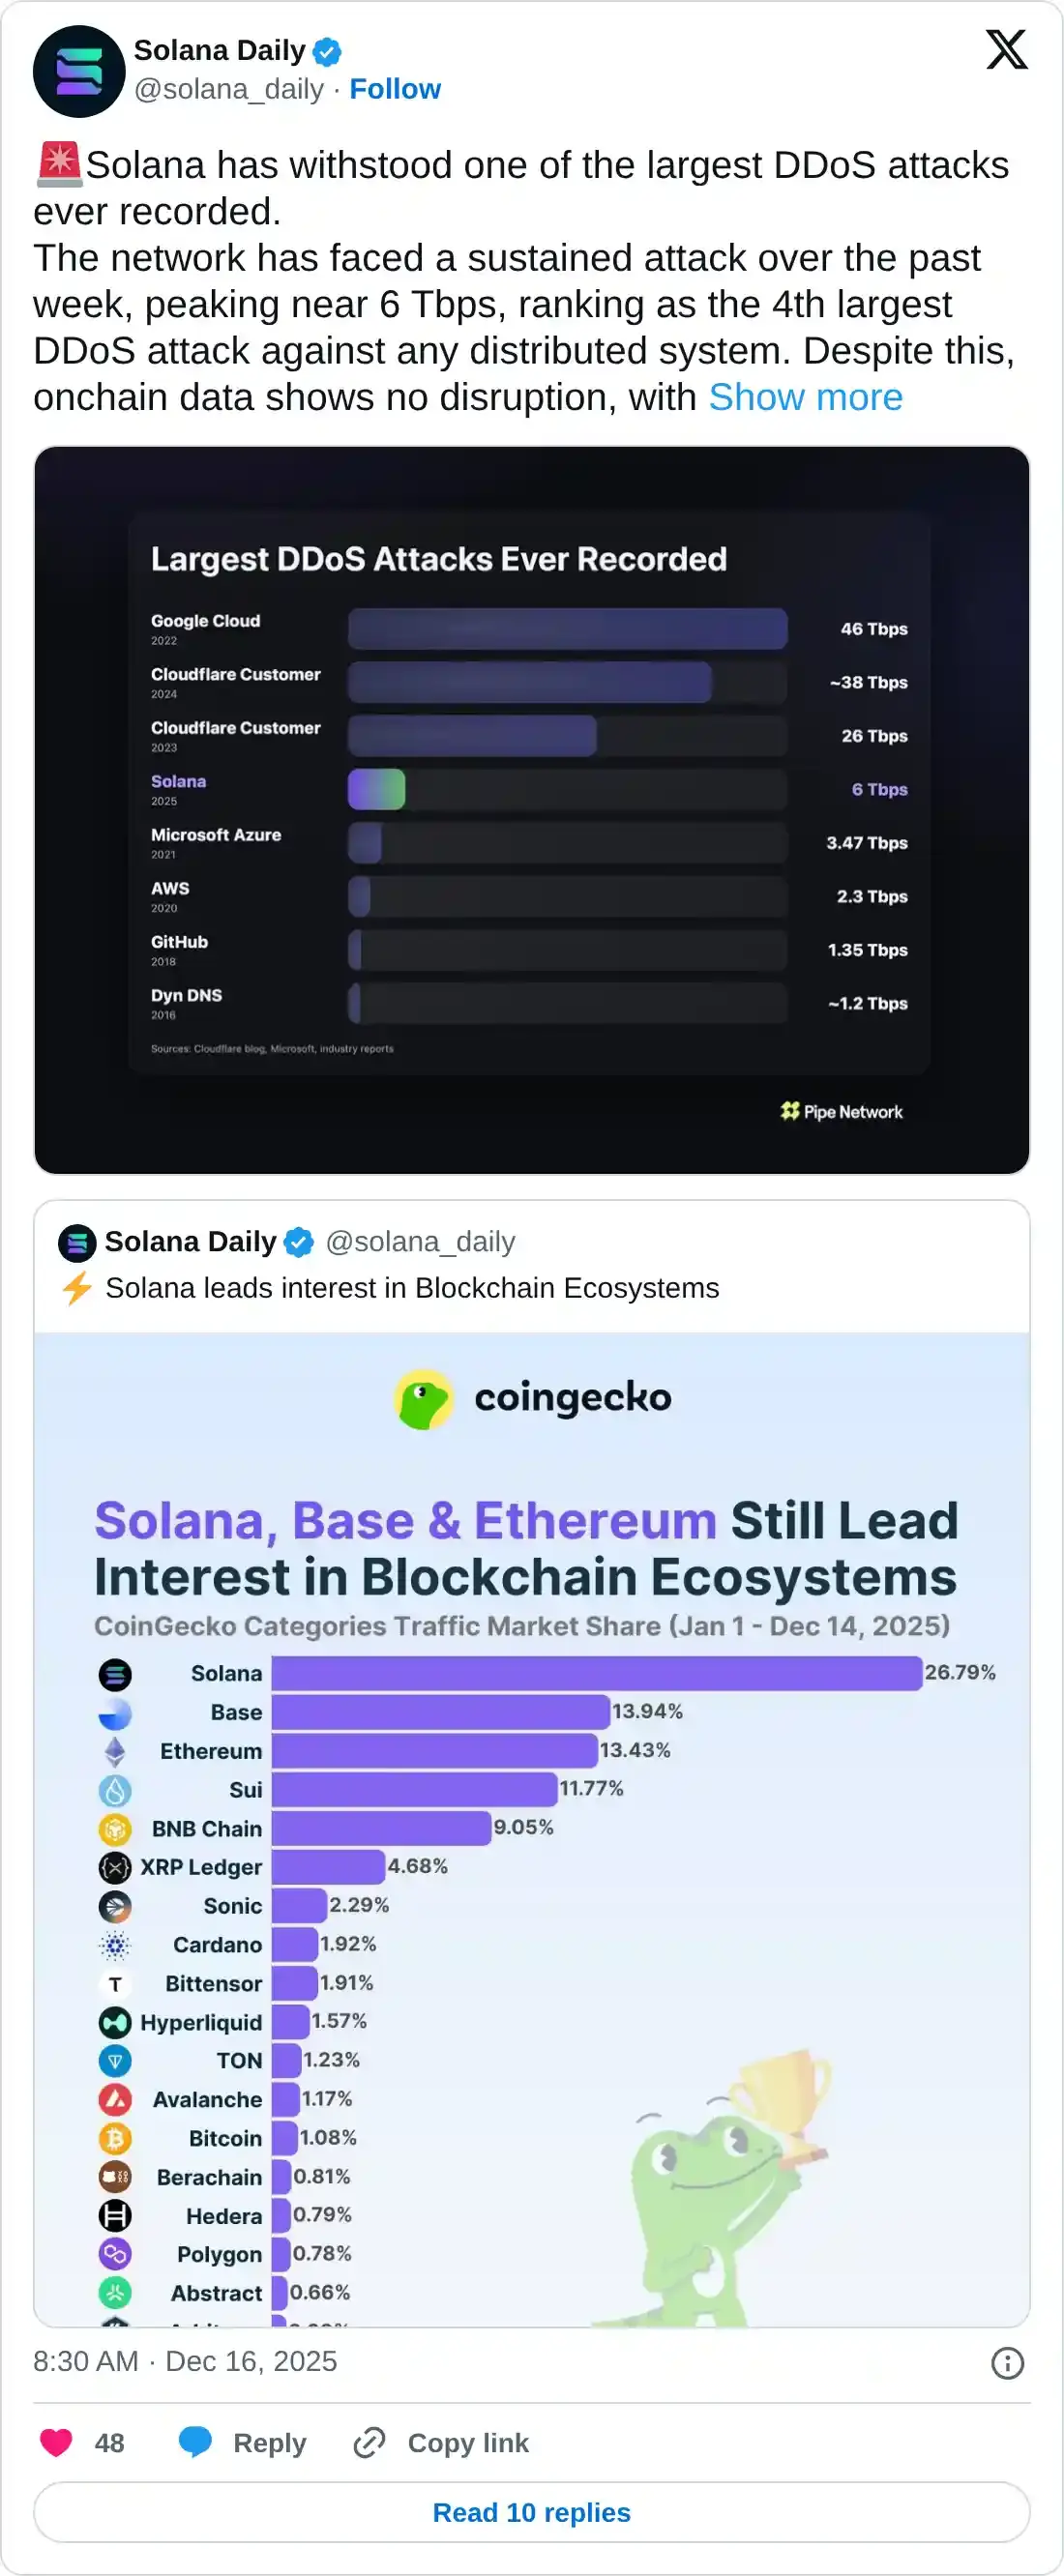
- The Solana blockchain remains stable amid an ongoing DDoS attack reaching 6 Tbps, with no signs of technical delays or disruptions.
- Derivatives data flashes bearish signal as SOL futures Open Interest and funding rate decline.

Solana (SOL) remains under bearish pressure, extending its decline for the third consecutive day with over 1% loss at press time on Tuesday. An ongoing Distributed Denial of Service (DDoS) attack on the Solana blockchain, peaking at 6Tbps, remains ineffective so far but continues to add pressure on traders’ sentiment. Additionally, the derivatives market sentiment is bearish, as Open Interest falls and funding rates turn negative.
Solana blockchain unfazed by DDoS attack
The Solana blockchain has held strong amid an ongoing DDoS attack over the past week, peaking at 6 Terabytes per Second (Tbps) and transferring over billions of packets per second. Typically, a DDoS attack attempts to crash an application by overwhelming it with requests.
Solana’s resilience amid one of the largest DDoS attacks in history and the Amazon Web Services (AWS) global outage in October strengthens its position among decentralized blockchains.
Solana loses retail strength as selling pressure mounts
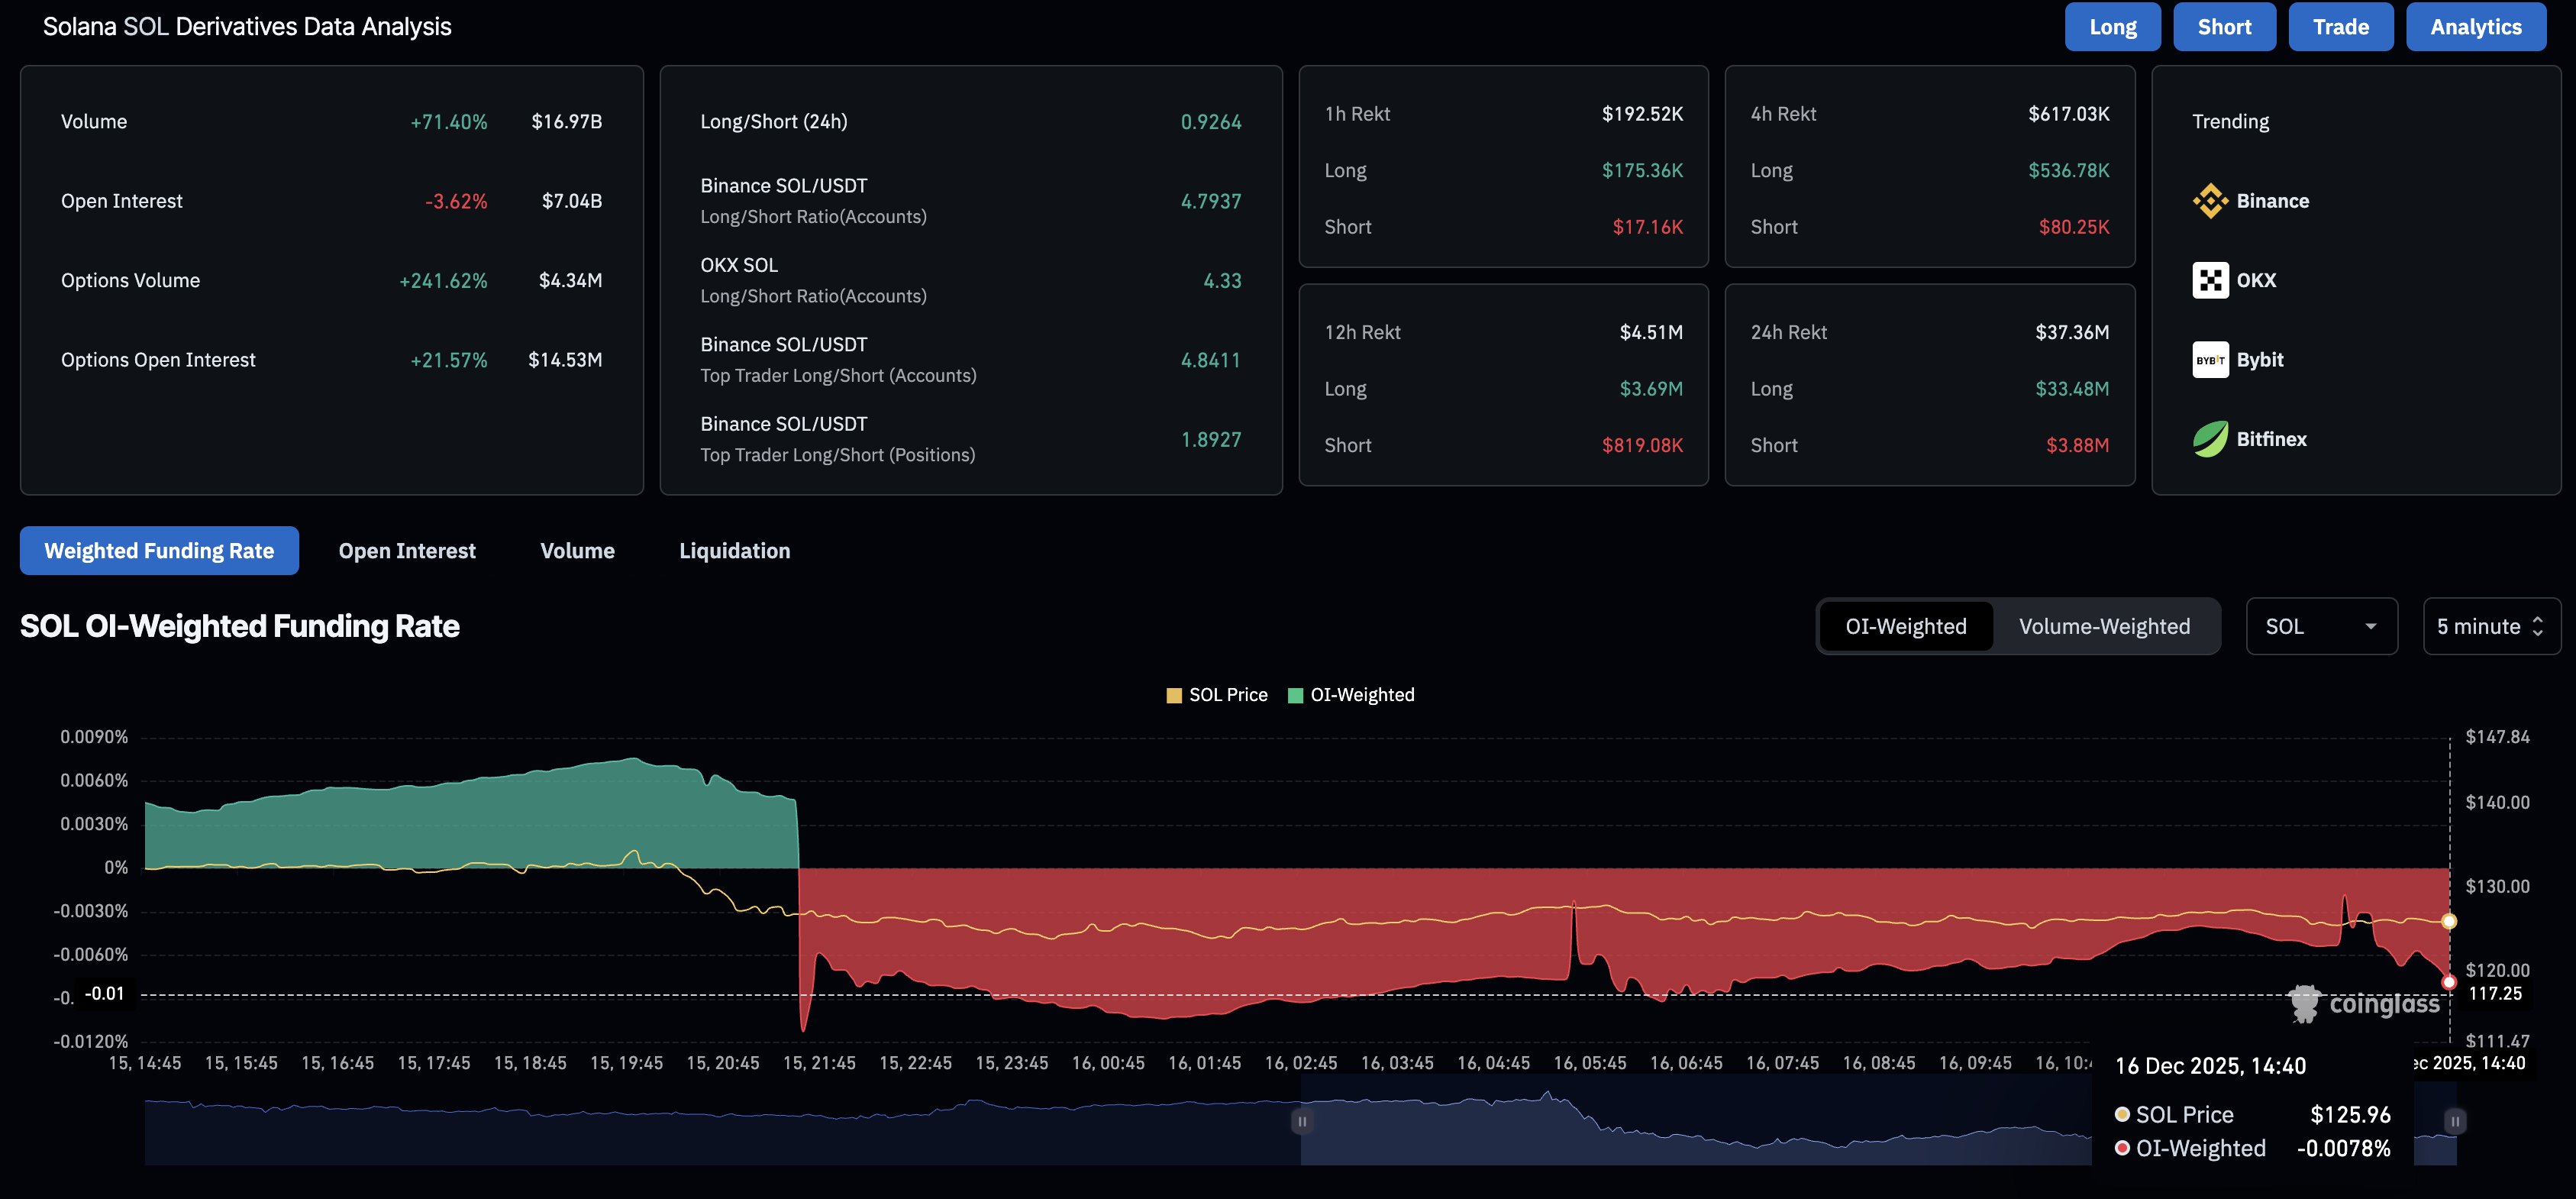
Sentiment in the derivatives market surrounding Solana is shifting bearish amid broader pressure in the cryptocurrency market. CoinGlass data shows that SOL futures Open Interest (OI) is down 3.62% over the last 24 hours to $7.04 billion, indicating a reduction in the notional value of active Solana perpetual contracts.
Along the same lines, the OI-weighted funding rate of -0.0078% indicates intense selling pressure, as bears are paying a premium to hold short positions.
Technical outlook: Will Solana extend its correction below $100?
Solana trades near the $126 support level, marked by the June 22 low, that has held multiple price drops in November. The ongoing bearish streak in SOL warns of a decisive close below this level to confirm the downside breakout.
In such a case, the high-speed blockchain token risks a steeper correction to the S1 Pivot Point at $107, then to the $100 mark, and finally to the S2 Pivot Point at $80.
Solana is struggling under rising bearish pressure, according to the momentum indicators on the daily chart. The Relative Strength Index (RSI) at 37 continues to decline, approaching the oversold boundary at 30.
Meanwhile, the Moving Average Convergence Divergence (MACD) line converges with the signal line, threatening a crossover that would confirm a rise in bearish momentum. The rise of a red histogram bar below the zero line would confirm the bearish crossover in the MACD indicator.
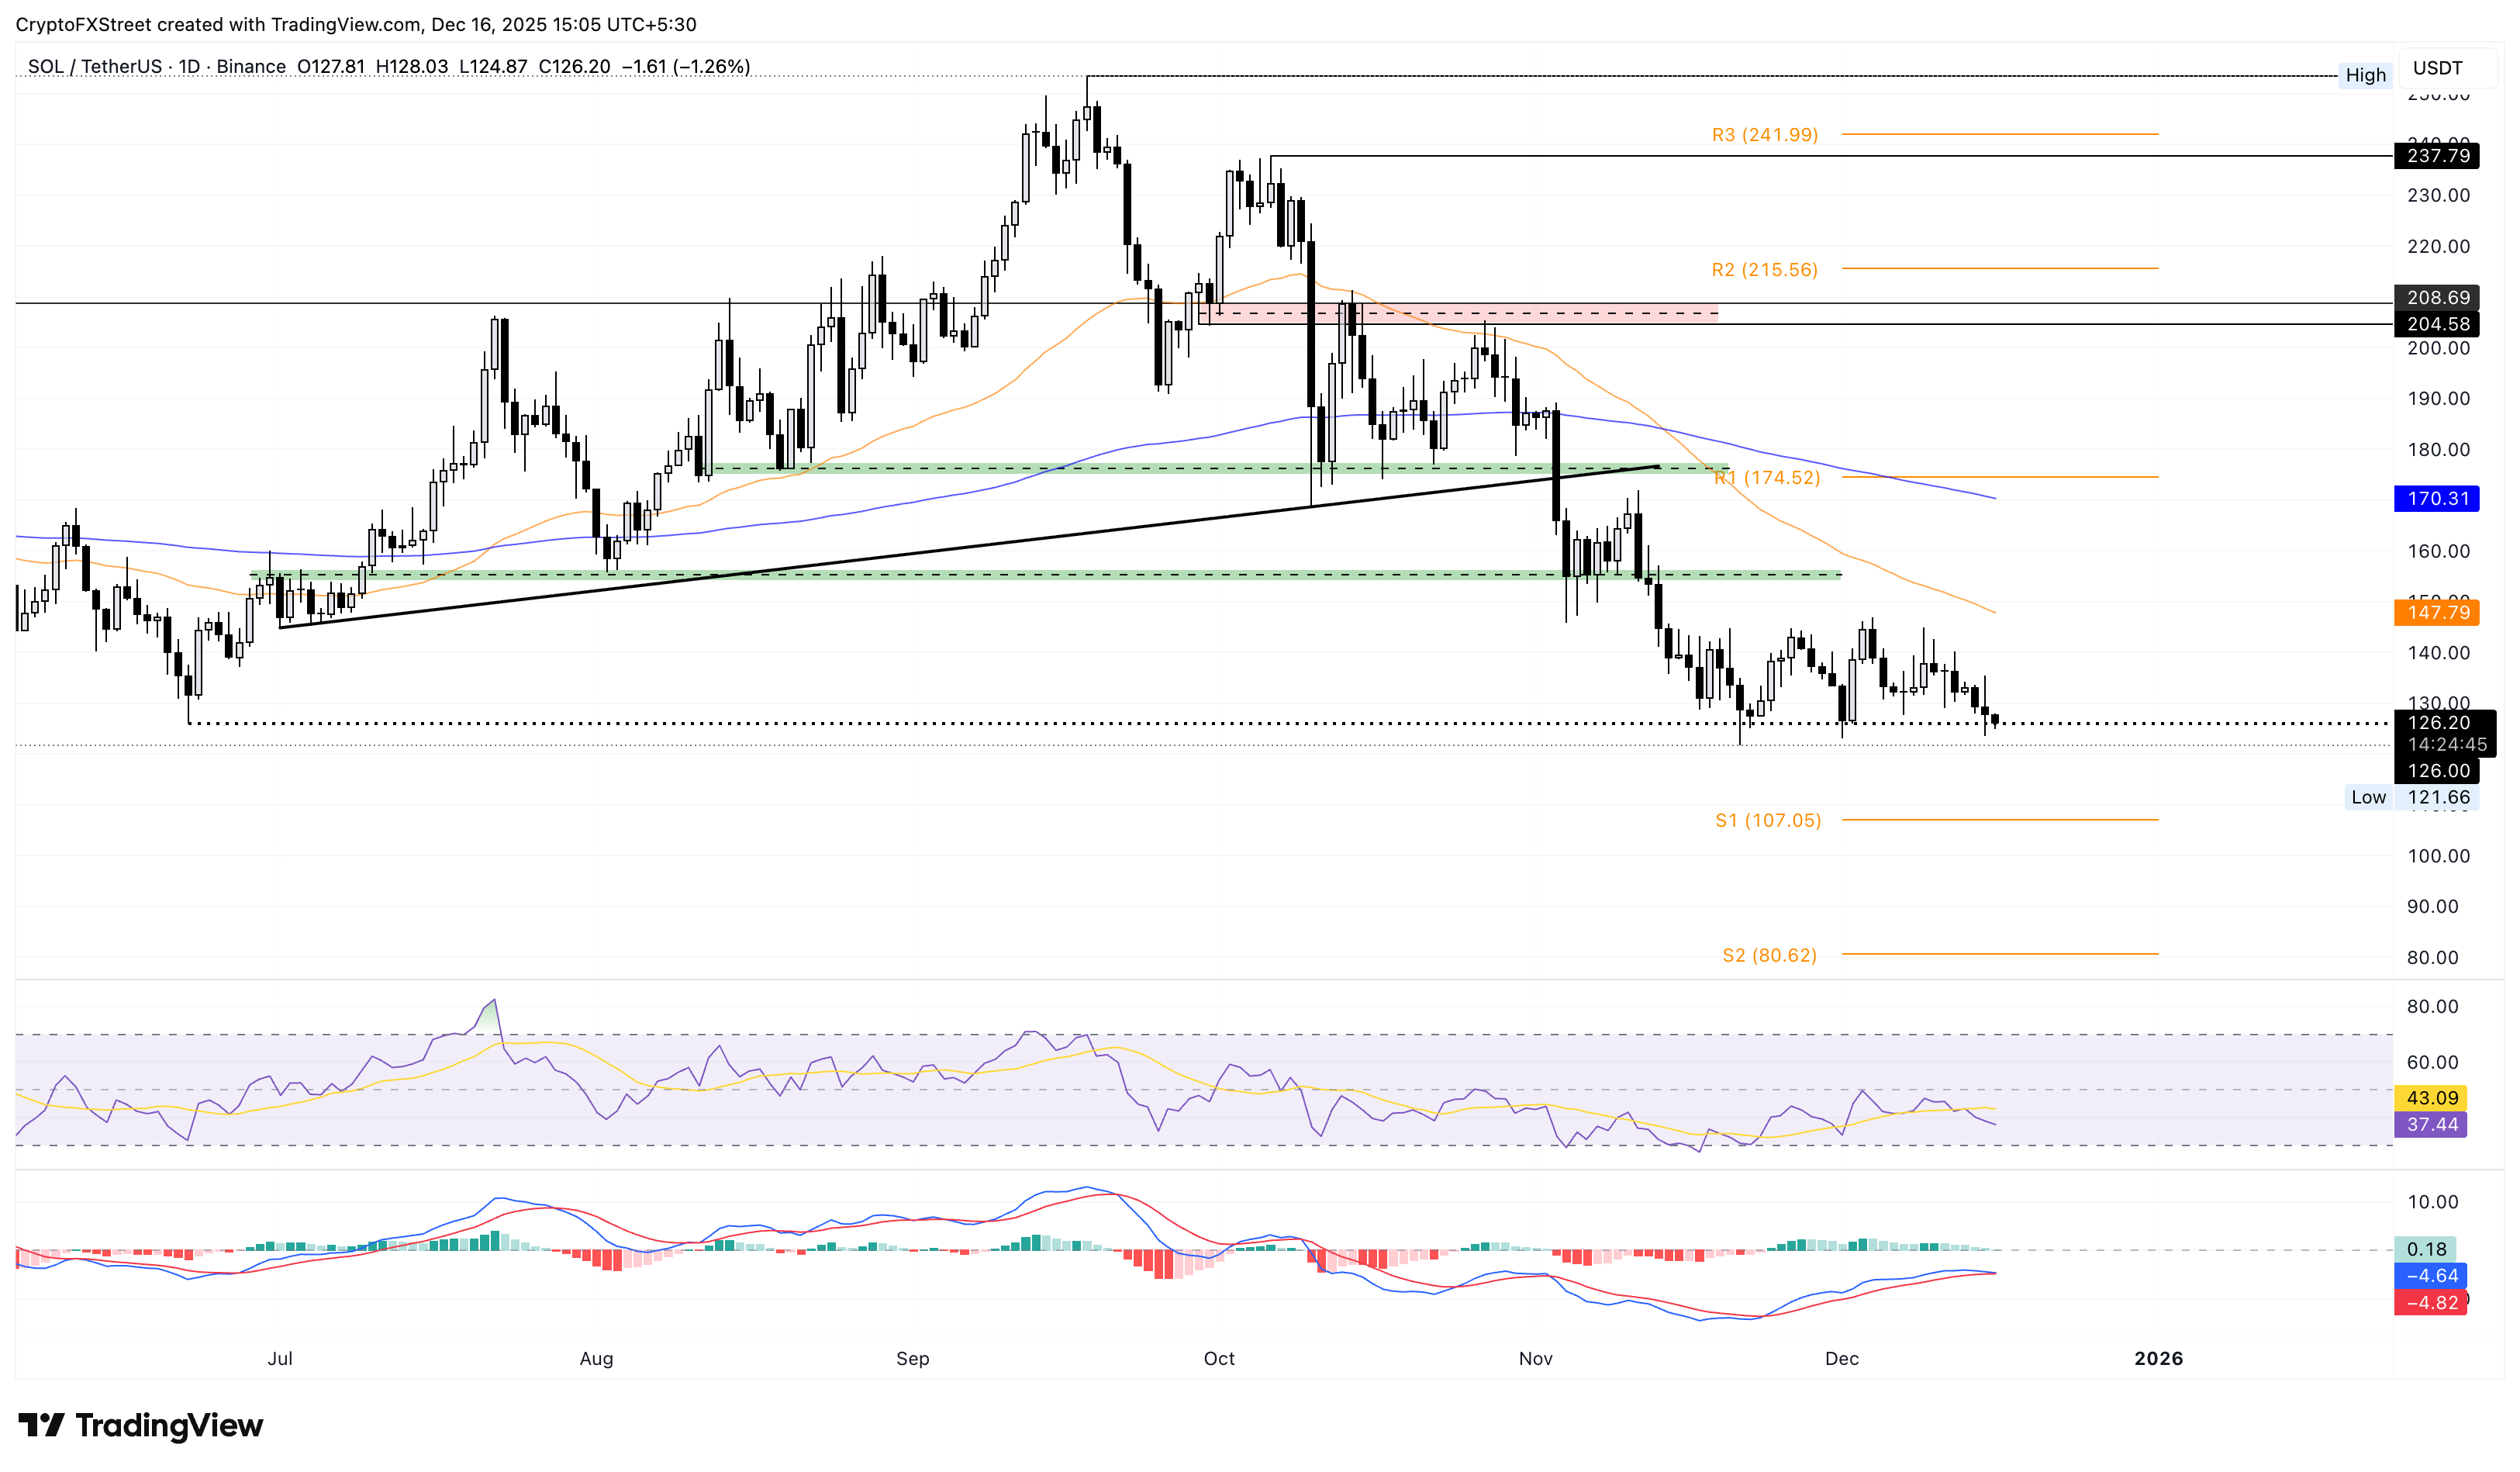
Still, a potential bounce back in SOL from $126 could aim for the declining 50-day Exponential Moving Average at $147.
Author

Vishal Dixit
FXStreet
Vishal Dixit holds a B.Sc. in Chemistry from Wilson College but found his true calling in the world of crypto.



