Top 3 Price Prediction Bitcoin, Ethereum, Ripple: Crypto markets in disarray
- Bitcoin price loses momentum as it slides back into consolidation along the $36,398 to $38,895 demand zone.
- Ethereum price slides below a symmetrical triangle, hinting at a move below $2,000.
- Ripple price remains bullish as bulls eye a retest of $1 psychological level.

Bitcoin price continues to tag the immediate demand area, weakening it. Despite the sudden bursts in buying pressure, BTC seems to be in consolidation mode. Ethereum price has triggered a bearish outlook while Ripple price shows signs of heading higher.
Also read: Gold Price Forecast: Lower lows hinting at a steeper decline
Bitcoin price moves with no sense of direction
Bitcoin price dips into the $36,398 to $38,895 demand zone for the fourth time without producing any higher highs. This price action is indicative of a consolidation and is likely to breach lower. A daily candlestick close below $36,398 will invalidate the demand zone and knock BTC to retest the weekly support level at $34,752, which is the last line of defense.
A breakdown of this barrier will open the path for bears to crash Bitcoin price to $30,000 or lower. Here, market makers will push BTC below $29,100 to collect liquidity resting below the equal lows formed in mid-2021.
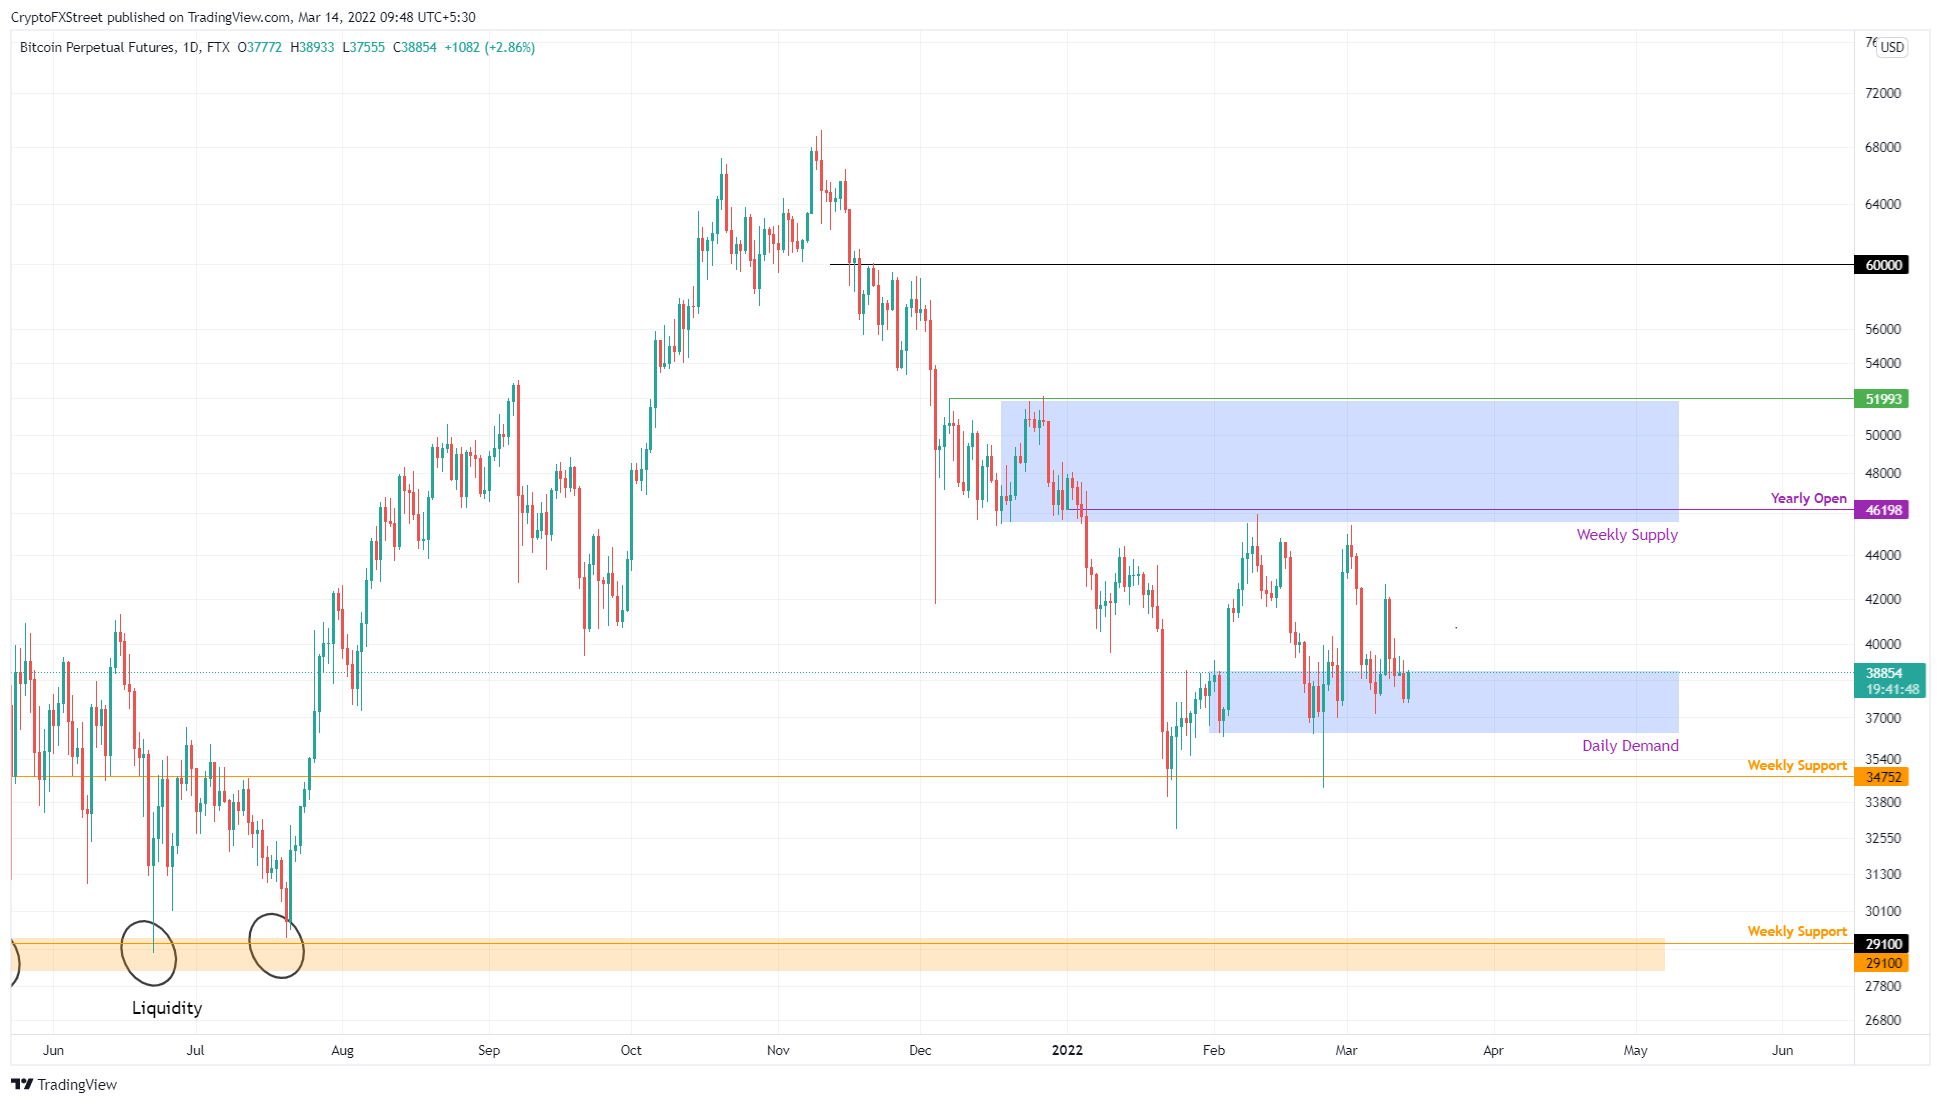
BTC/USD 1-day chart
While things look inauspicious for Bitcoin price, a strong bounce off the said demand zone that retests the weekly supply zone, ranging from $45,550 to $51,860, will provide some relief for bulls.
Ethereum price favors bears
Ethereum price action from January 22 to March 4 created three lower highs and higher lows, which, when connected via trend lines, resulted in a symmetrical triangle formation. This technical formation forecasts a 26% move obtained by measuring the distance between the first swing high and swing low to the breakout point.
On March 6, ETH breached below, signaling a bearish breakout, which puts the theoretical target at $1,962. A breakdown of the weekly support level at $2,541 is vital; a breakdown of this barrier will expedite the move lower.
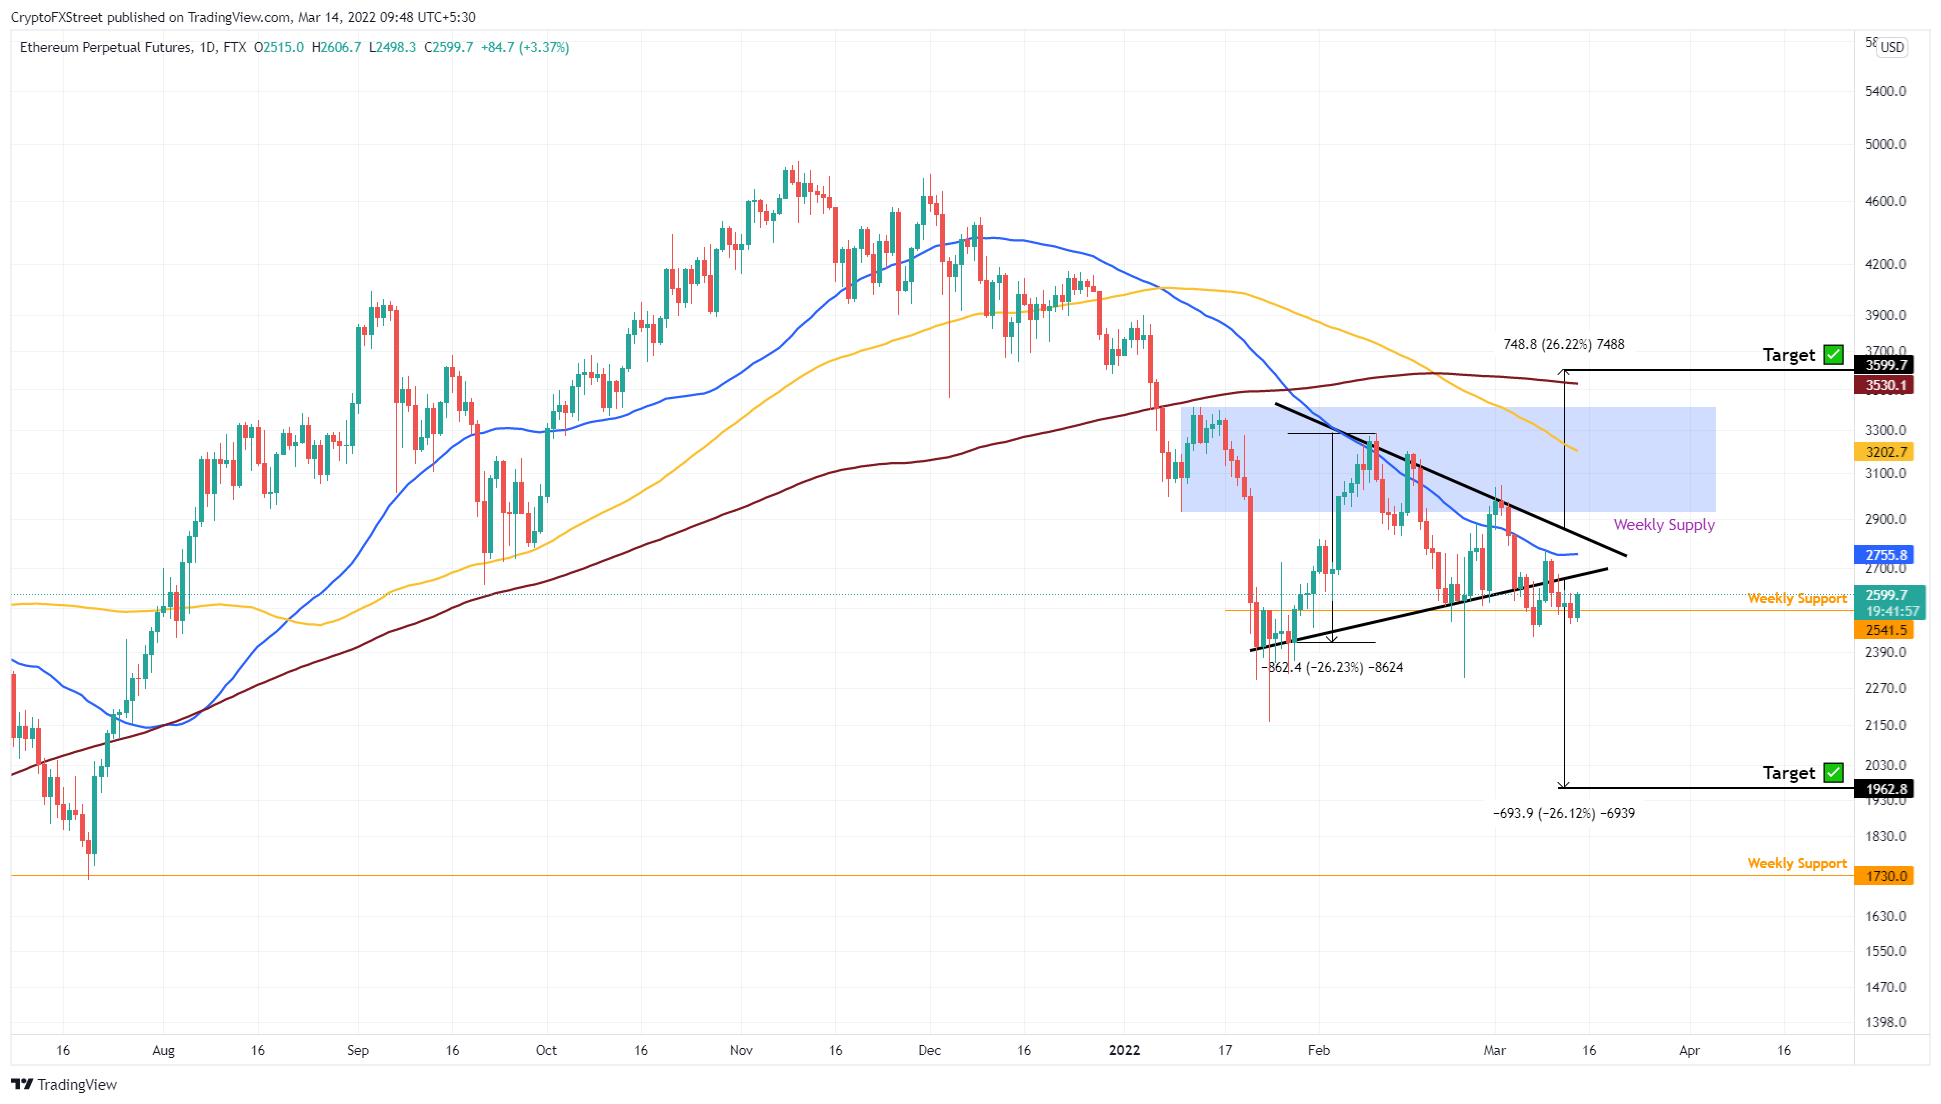
ETH/USD 1-day chart
Regardless of the recent onslaught of bearishness, Ethereum price needs to produce a daily candlestick close above $3,413 to invalidate the bullish thesis. Such a development will also open the possibility of kick-starting a potential uptrend.
Ripple price maintains its bullish momentum
Ripple price traverses a bull flag continuation pattern, a breakout from which hints at a continuation of the uptrend. This technical formation contains an impulsive move higher followed by a consolidation in the form of a pennant.
The 55% rally between February 3 and 8 formed a bullish flag pole continuation pattern, and the consolidation that ensued in the form of lower highs and higher lows created the pennant. Together, the bullish setup forecasts a 31% ascent for XRP price, obtained by adding the flag pole’s height to the breakout point from the pennant.
On March 11, Ripple price broke out from the pennant, signaling the start of the 31% uptrend to $1. So far, the retest seems to be holding up well, so investors can expect the remittance token to continue its journey higher to the $1 psychological level.
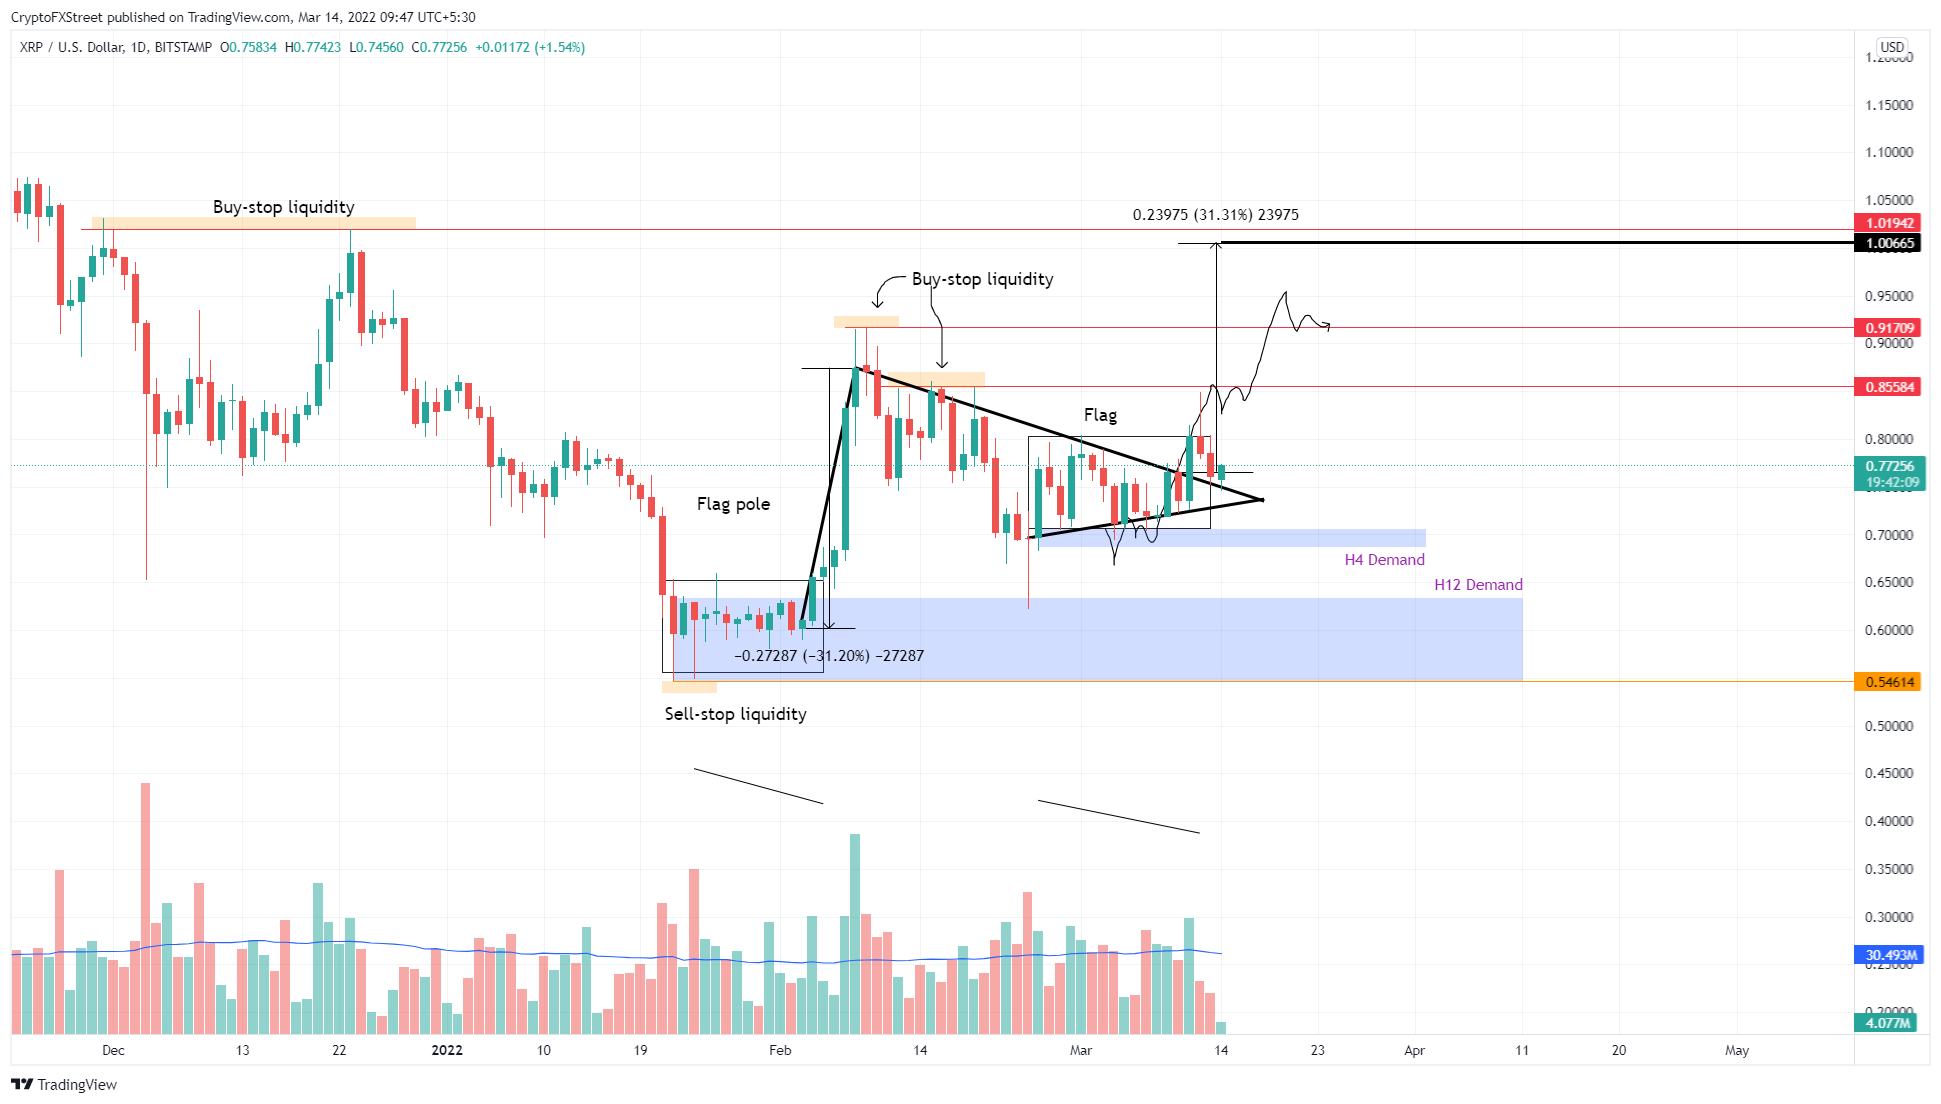
XRP/USD 1-day chart
A daily candlestick close below the immediate demand zone, ranging from $0.689 to $0.705, will create a lower low and invalidate the bullish thesis for Ripple price.
In such a case, XRP has the twelve-hour demand zone, extending from $0.546 to $0.633 to support any residual selling pressure.
Author

Akash Girimath
FXStreet
Akash Girimath is a Mechanical Engineer interested in the chaos of the financial markets. Trying to make sense of this convoluted yet fascinating space, he switched his engineering job to become a crypto reporter and analyst.


