Top 3 Price Prediction Bitcoin, Ethereum, XRP: Crypto bull phase could start in 10 days
- Bitcoin price fails to break lower, denying bears another opportunity for profit.
- Ethereum price continues to consolidate in the $2,500 value area.
- XRP price is currently at the easiest time and price level to begin a new uptrend.

Bitcoin price continues to display bearish structure on the daily chart, but sellers remain tentative. Ethereum price was unable to make a clear break above or below a critical Fibonacci level. XRP price has very little above in the form of resistance, preventing an explosive move higher.
Bitcoin price action is close to triggering a monster bear trap that could see BTC hit $50,000
Bitcoin price has been a source of frustration for bulls and bears alike. However, the continued weakness displayed by the confirmed Ideal Ichimoku Breakout has not resulted in mass shorting for bears. On the contrary, bulls have steadily crept up with higher lows. Nevertheless, rejection against key resistance levels remains.
The frustration for bulls is that many major price spikes have confirmed an Ideal Bullish Ichimoku Breakout and then recovering from the initial sell-off. The resulting whipsaw above and below key resistance and support has left participants haggard, with many now sitting on the sidelines waiting for a clear direction.
There is buying opportunity for Bitcoin price on its Point and Figure chart. The hypothetical long trade setup is a buy stop order at $40,500, with a stop loss at $38,500 and a profit target at $52,500. The trade setup represents a 6:1 reward for the risk setup. A trailing stop of two to three boxes would help protect any implied profit made post entry.
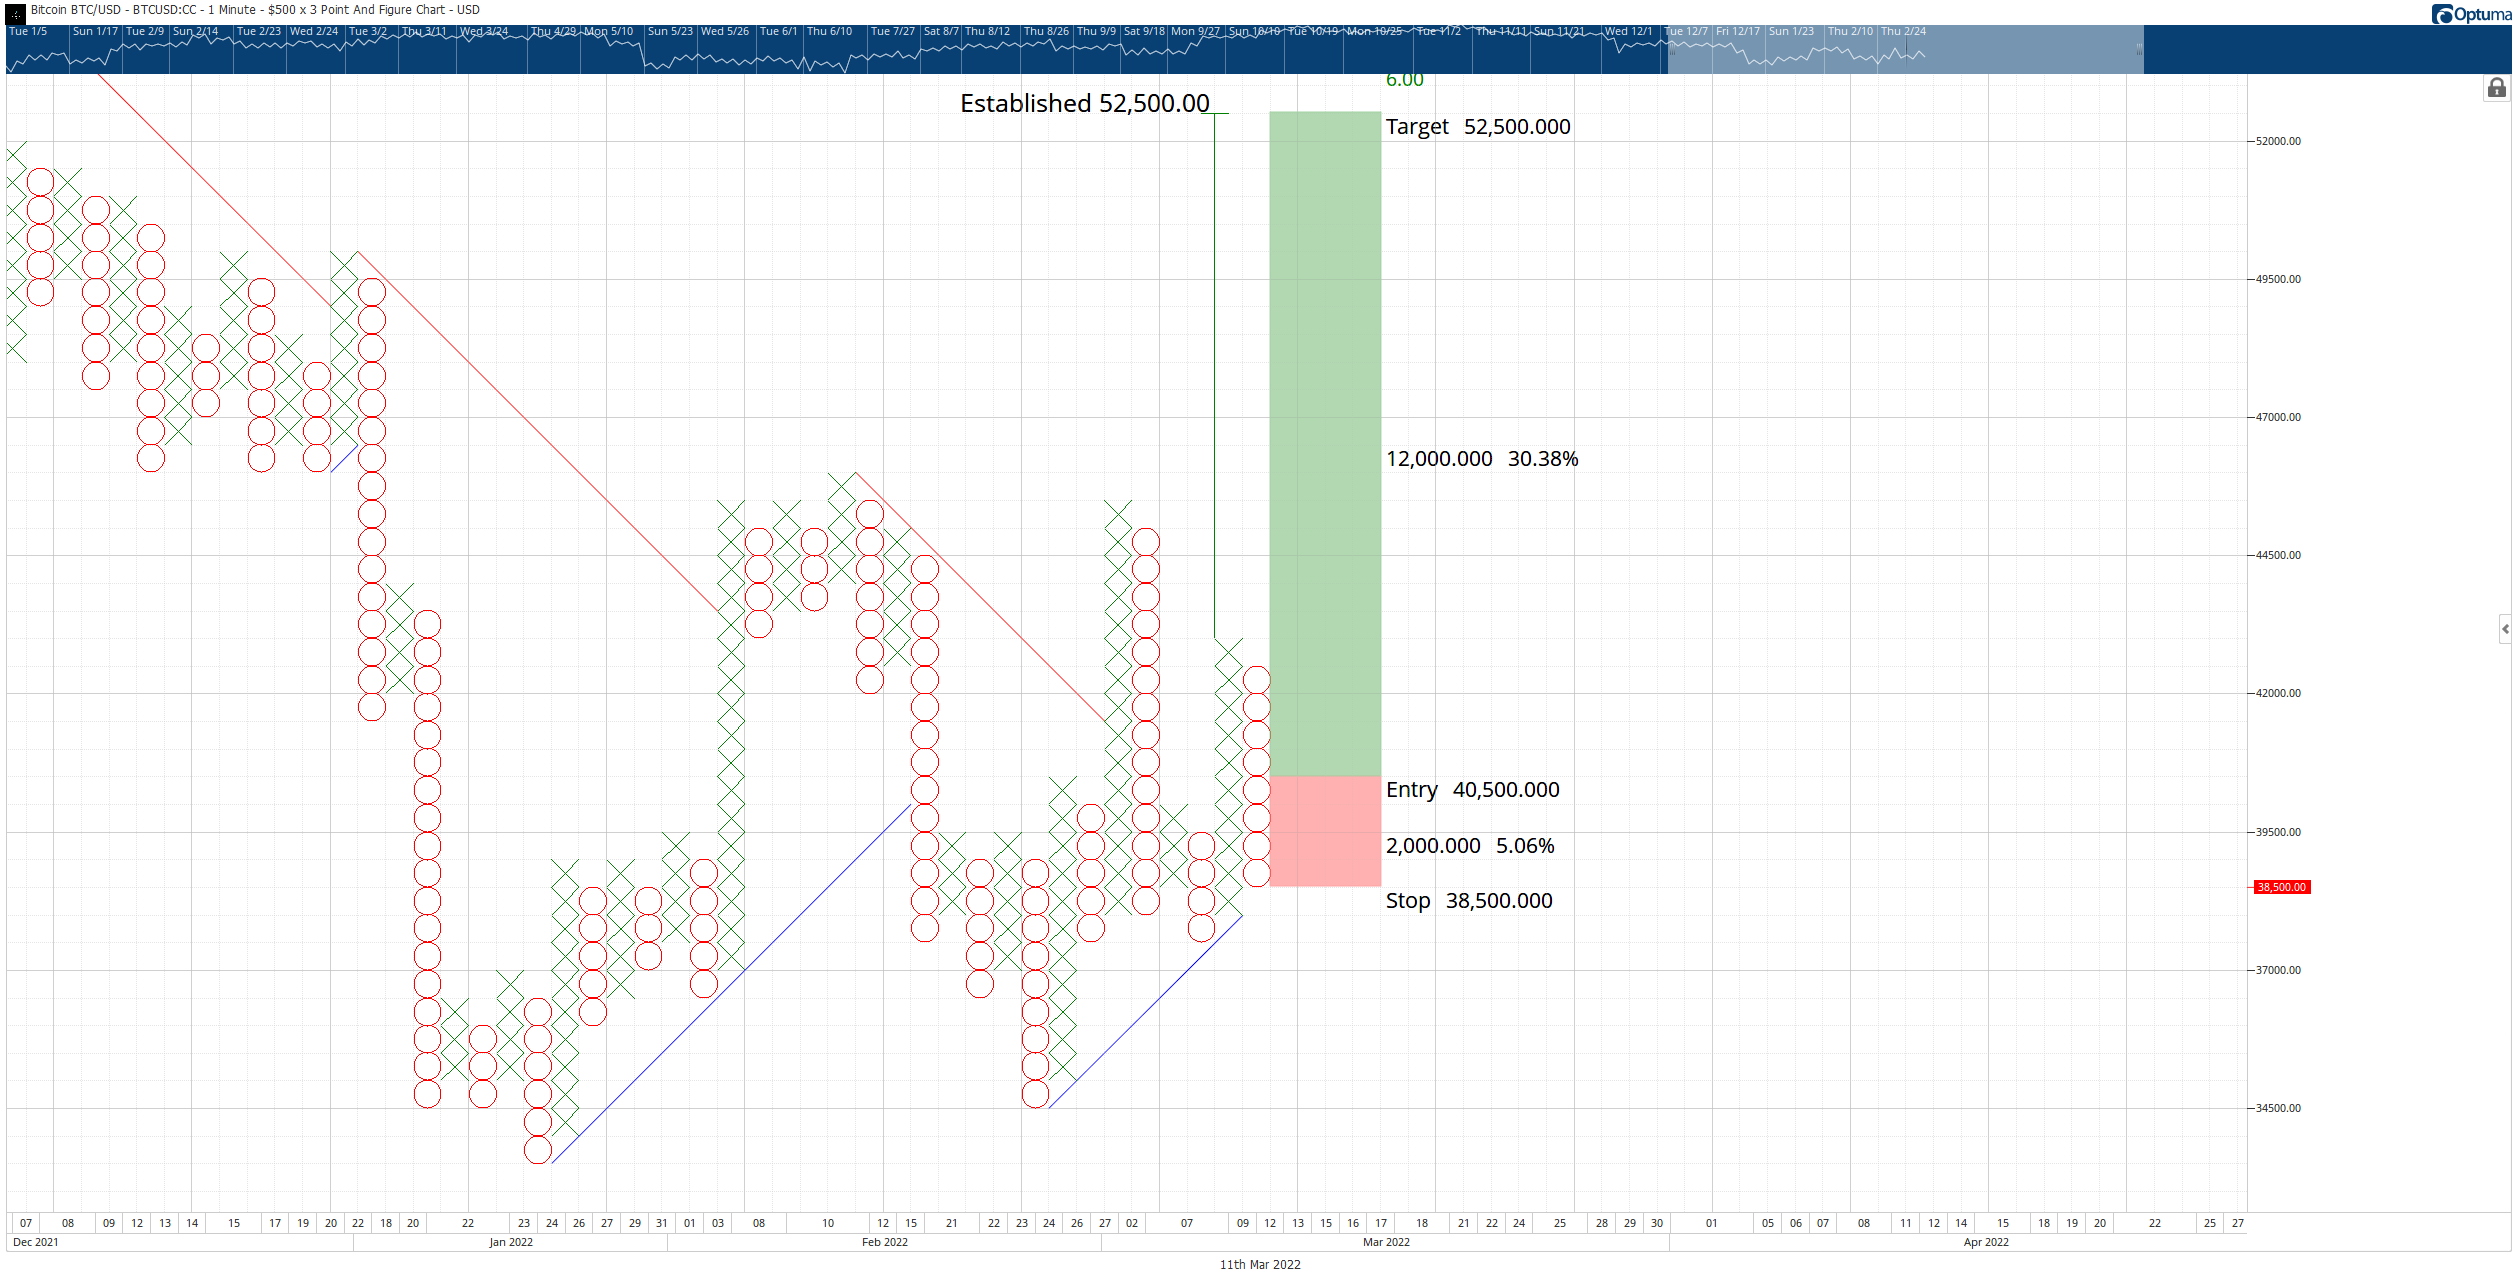
BTC/USD $500/3-box Reversal Point and Figure Chart
The hypothetical trade setup for Bitcoin price is invalidated if BTC moves to $37,000 before the entry is triggered.
Ethereum price presents buying opportunity before breaking out towards $3,800
Ethereum price action presents an aggressive buying opportunity on the daily Ichimoku chart. The theoretical long entry is a buy stop order above the Kijun-Sen at $2,760, a stop loss below the March 7 close, and a profit target at the top of a prior bull flag at $3,800. The caveat with the entry is that it must be done on the daily close, and the daily close must be at or slightly above the $2,760 level.
The trade is invalidated if Ethereum price closes below $2,400. Any near-term bullish outlook would be invalidated in that scenario as ETH would likely begin another leg lower. The projected low that ETH could hit is the $1,825 value area.
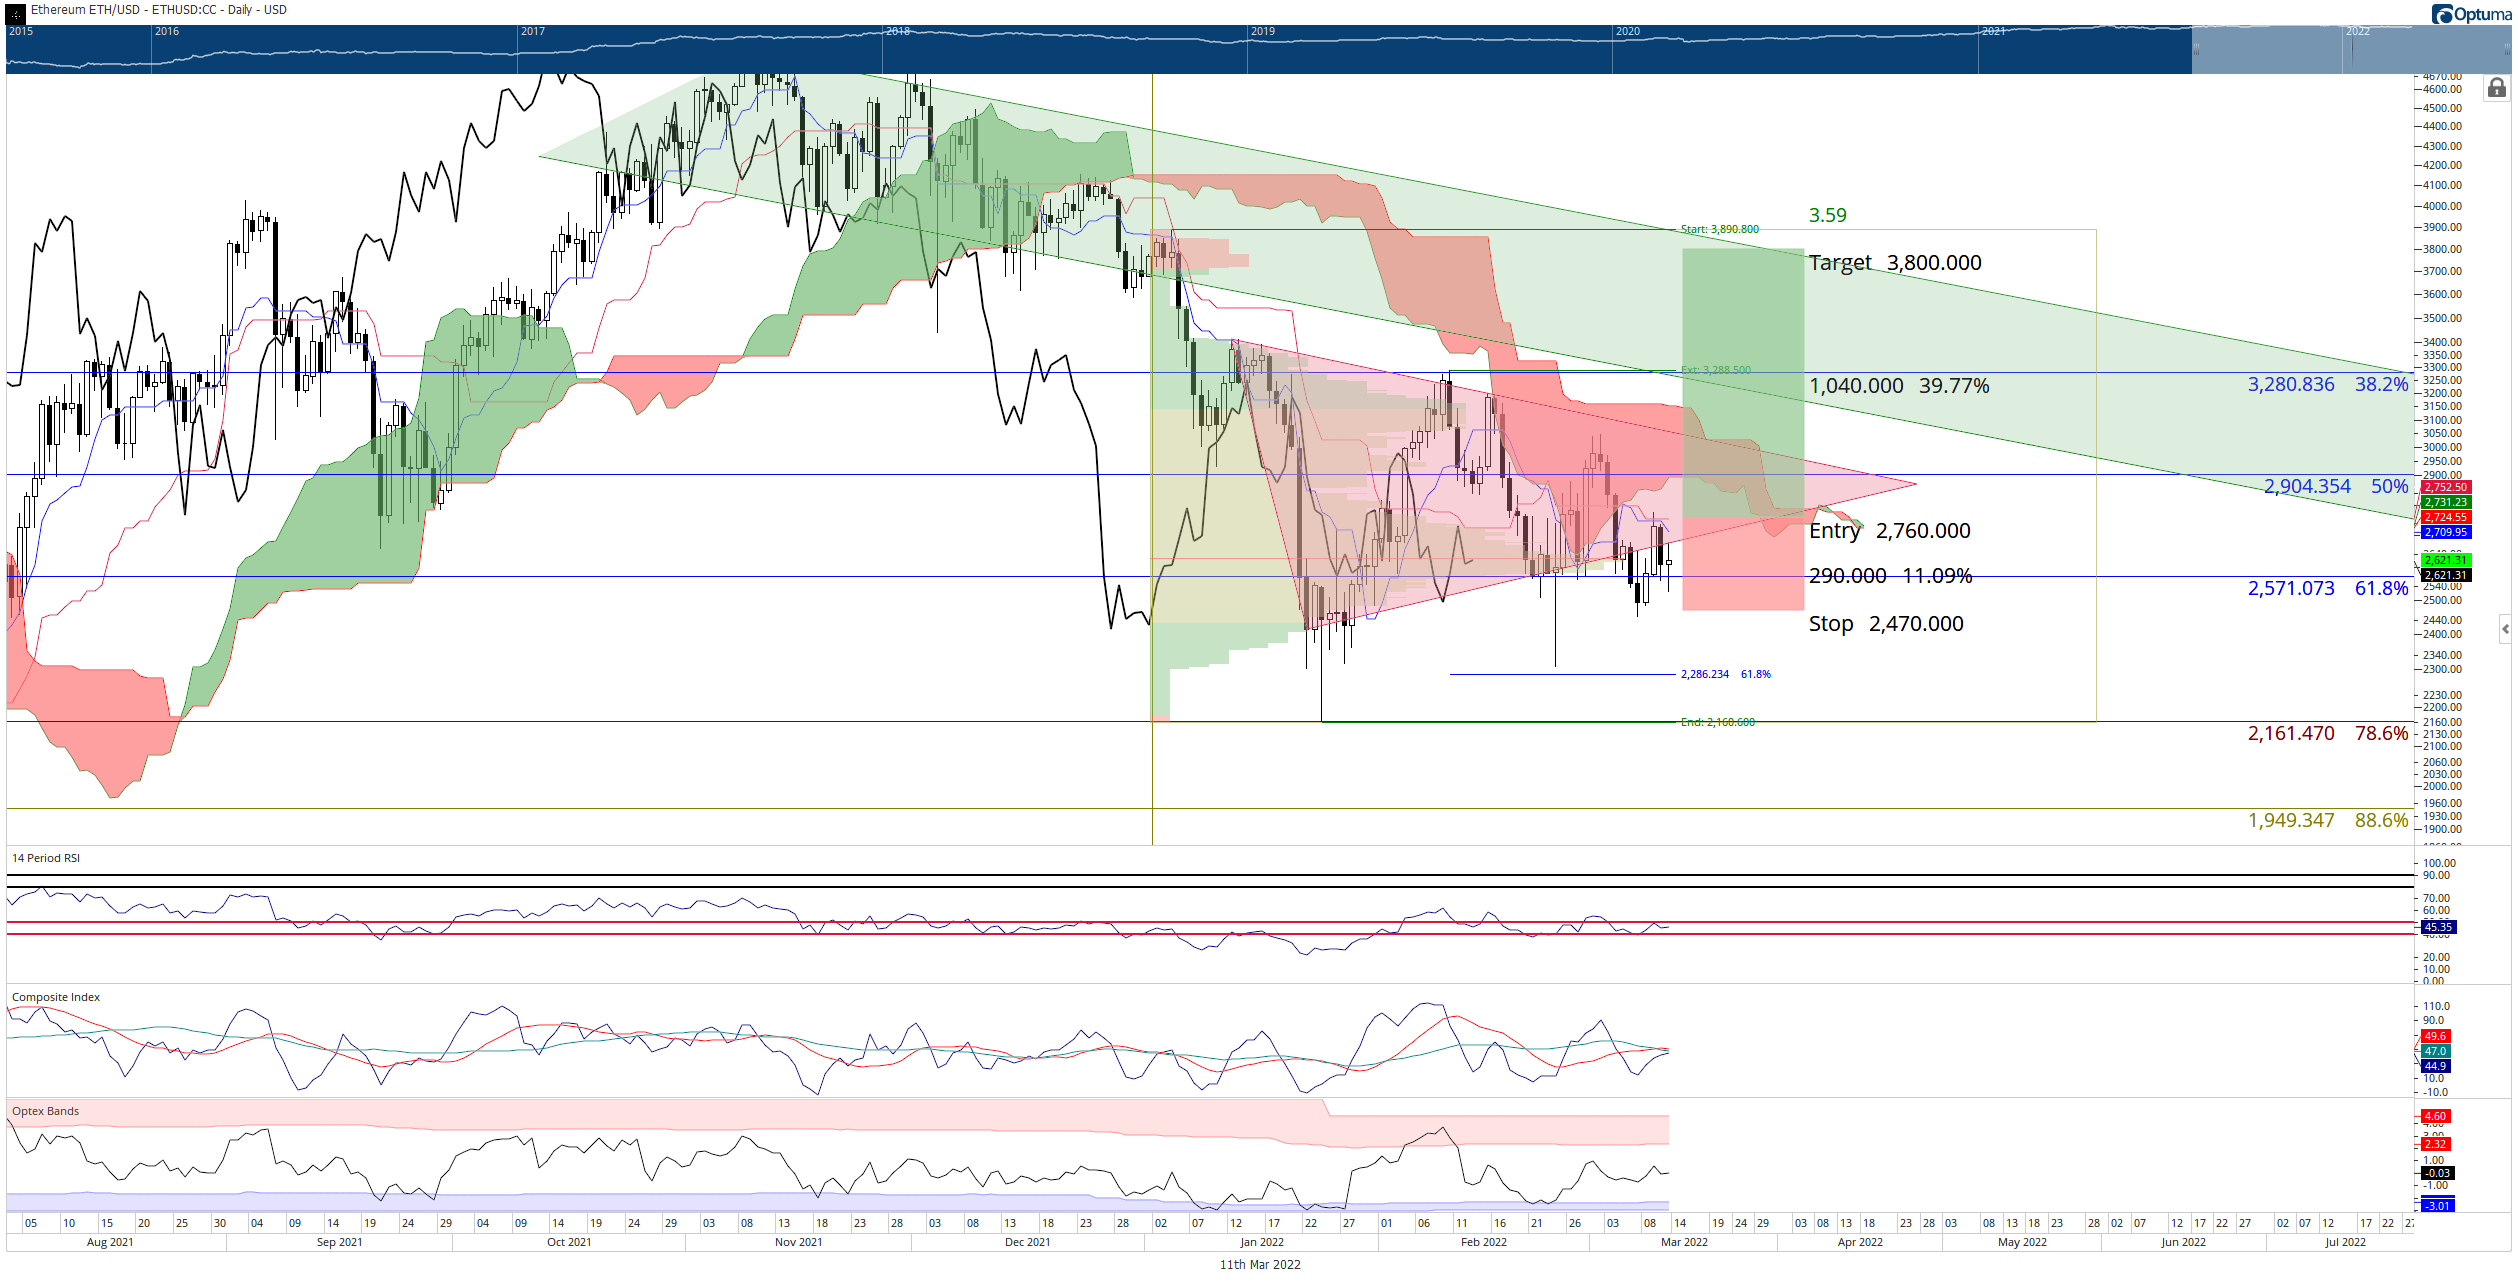
ETH/USD Daily Ichimoku Kinko Hyo Chart
From a time cycle perspective, Ethereum price and the broader cryptocurrency market have a high probability of creating a new bullish expansion phase between now and the Gann Seasonal date of March 21. Historically, cryptocurrencies begin large rallies around that date if the preceding price action was in a downtrend.
XRP price needs buyers to initiate the largest bull it has seen in nearly a year
XRP price action, like Bitcoin’s and Ethereum’s, has confirmed several major bearish breakout setups on the daily Ichimoku chart. And just like BTC and ETH, sellers have been unable or unwilling to press the advantage to move Ripple lower.
XRP is currently just a hair above the Tenkan-Sen and Kijun-Sen, but below the Ichimoku Cloud. However, where XRP price is relative to the Ichimoku Cloud is extremely important. Above XRP is a Kumo Twist.
A Kumo Twist is a type of time cycle within the Ichimoku Kinko Hyo system that can often signal where a major/minor swing high or low may develop, especially if an instrument has been trending strongly into the period of a Kumo Twist. Fortunately for XRP price, the twist itself is also where the Ichimoku Cloud is at its weakest – support and resistance are almost non-existent at the price level of the Kumo Twist.
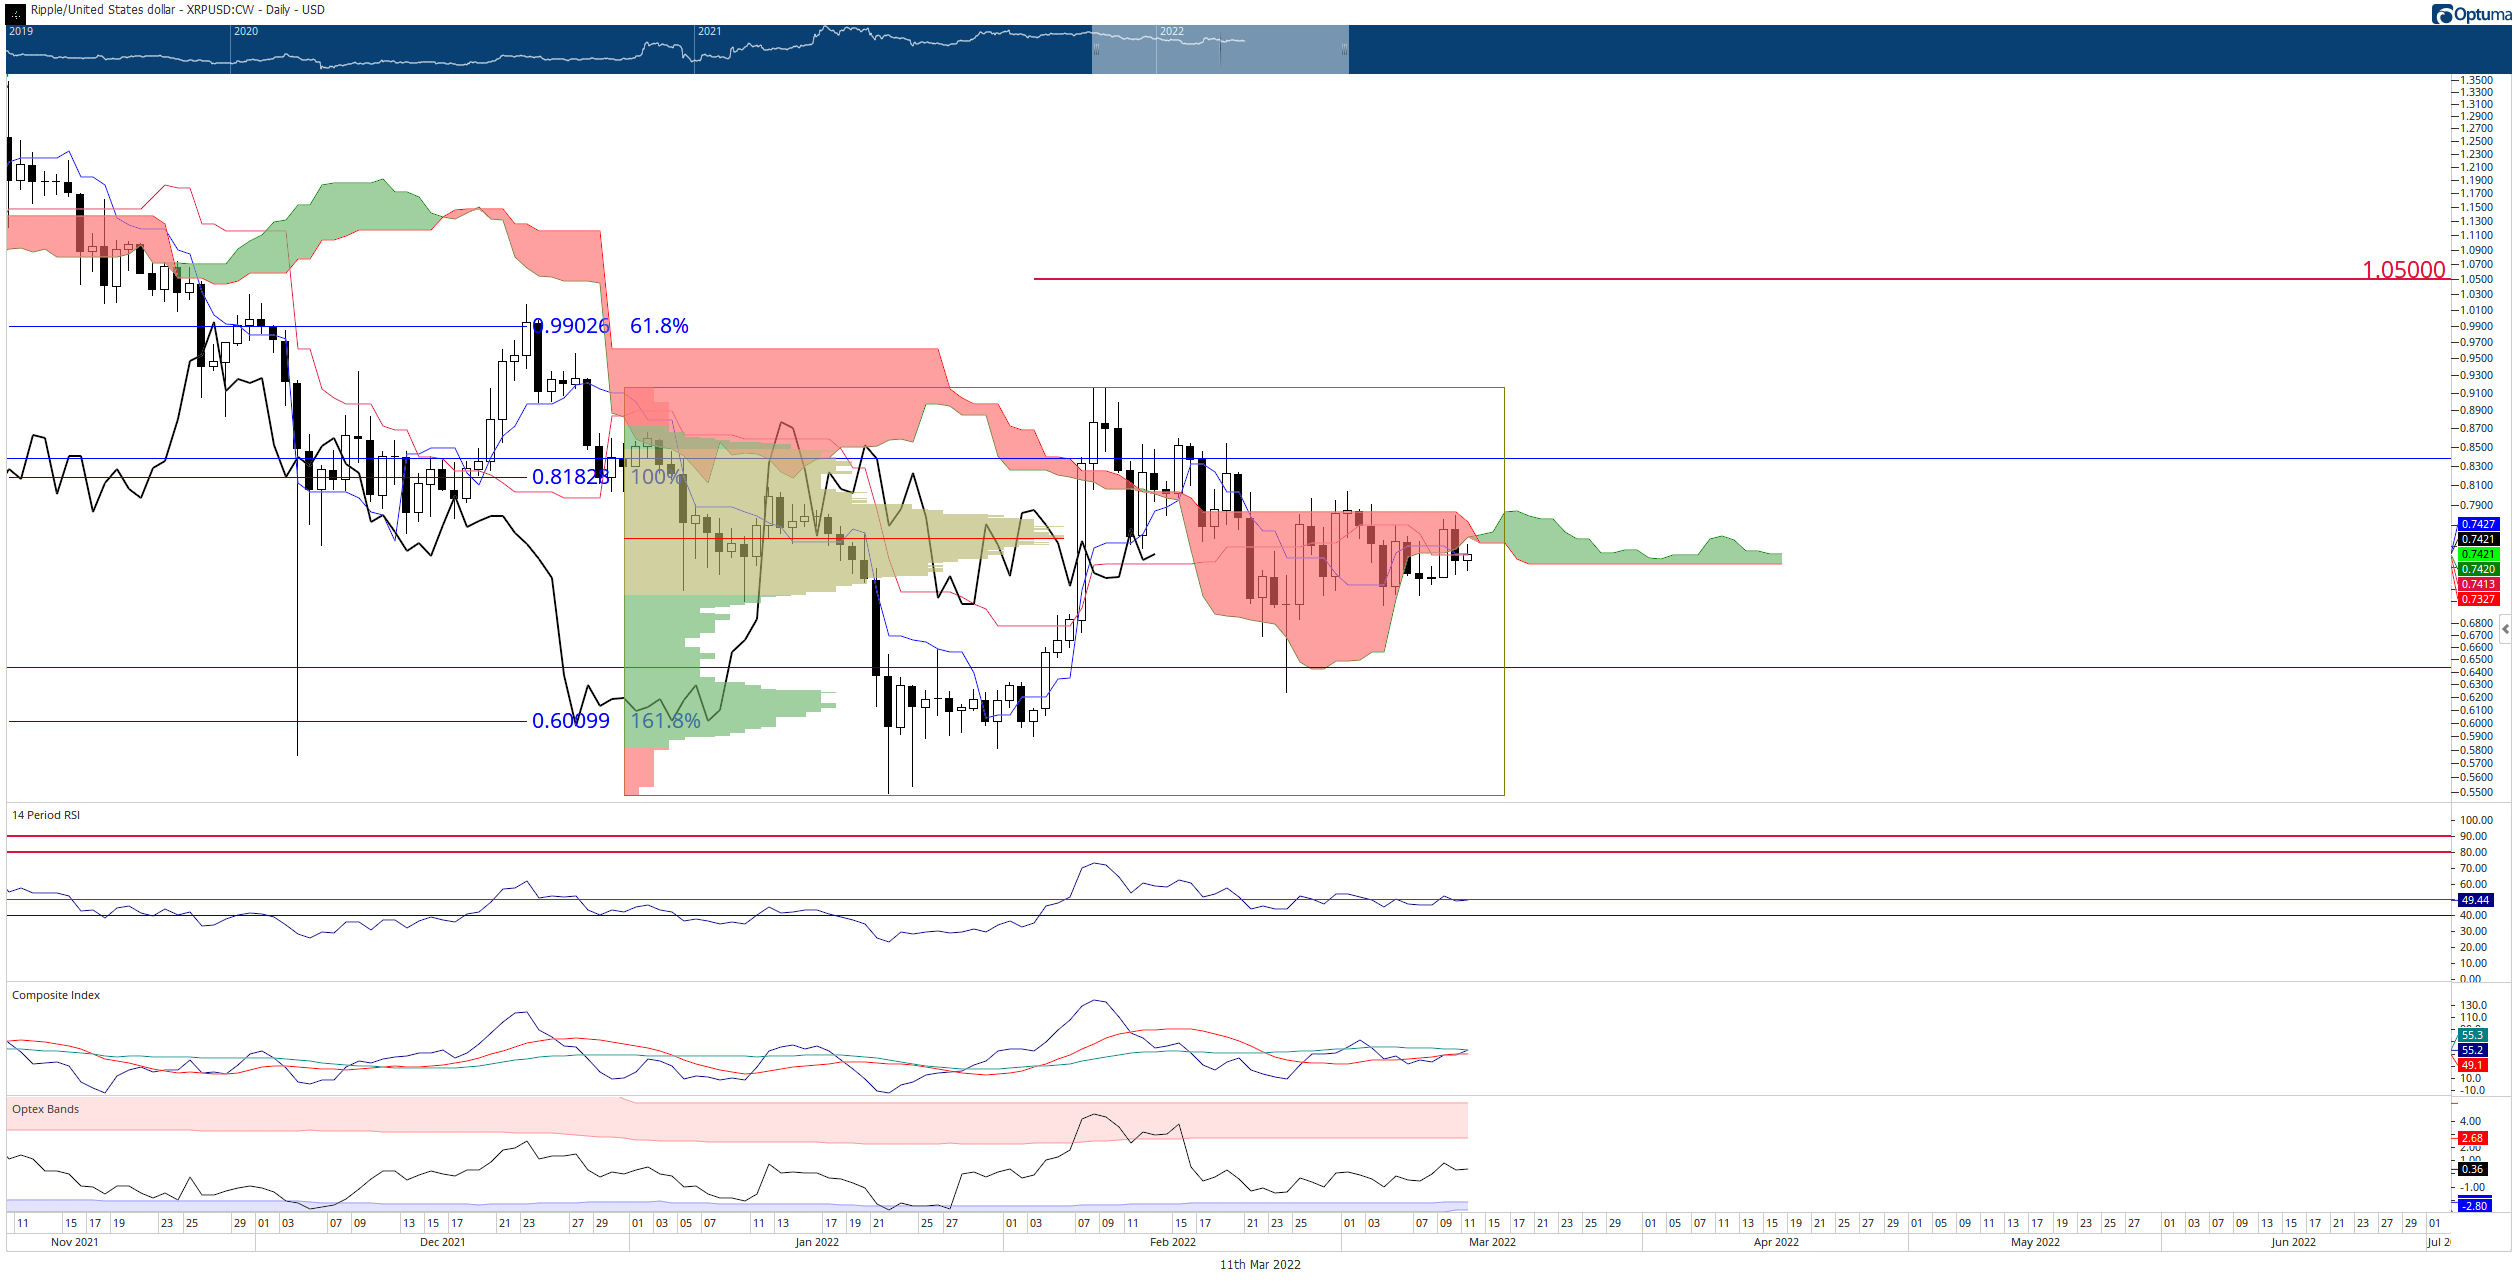
XRP/USDT Daily Ichimoku Kinko Hyo Chart
Additionally, when prices trade near a Kumo Twist, that instrument can move very easily through it. When that occurs, the Kumo Twist acts almost as an accelerant for price action, often creating dramatic and powerful moves. For XRP price, this means there is a high probability that it could blast above the $0.75 value area and generate a massive spike towards the $1 value area.
Author

Jonathan Morgan
Independent Analyst
Jonathan has been working as an Independent future, forex, and cryptocurrency trader and analyst for 8 years. He also has been writing for the past 5 years.



