Top 3 price prediction Bitcoin, Ethereum, Ripple: XRP can be the green light among the massive red ones
- XRP shows a closer pattern to the end of the recent falls.
- Ethereum and Bitcoin are delayed and can still spend some weeks moving down.
- The market is looking for lower levels to buy and any excuse is good.

The crypto market seems determined to be able to offer excellent price levels to buy on Black Friday. At mid-morning of the European session, the news of a new malicious attack that has managed to steal Ethereums worth $49 million from the UpBit exchange crypto jumped.
In the previous days, no major asset had managed to beat key resistance levels, and only one trigger was needed to get the downtrend back on track.
I think it is important to note that professional investors and traders do not perceive the current downturn as a threat.
The charts provided by Bakkt on the trading volume of his Bitcoin futures shows how institutions significantly increased their open long positions in the hardest days of the recent crash.

The public wants to buy cryptos at a reasonable price, and the declines of the last few days are an opportunity. Bitcoin, Ethereum, Litecoin or EOS are attracting the attention of fresh money, while XRP is again penalized by the uncertainty of its relationship with the parent company Ripple Ltd.
ETH/BTC Daily Chart
A very long term bearish trend line is expected at the 0.23 level, which, if exceeded, would open up a bullish market for the high potential profit pair.
Above the current price, the first resistance level is at 0.0208, then the second at 0.022 and the third one at 0.023.
Below the current price, the first support level is at 0.020, then the second at 0.019 and the third one at 0.018.
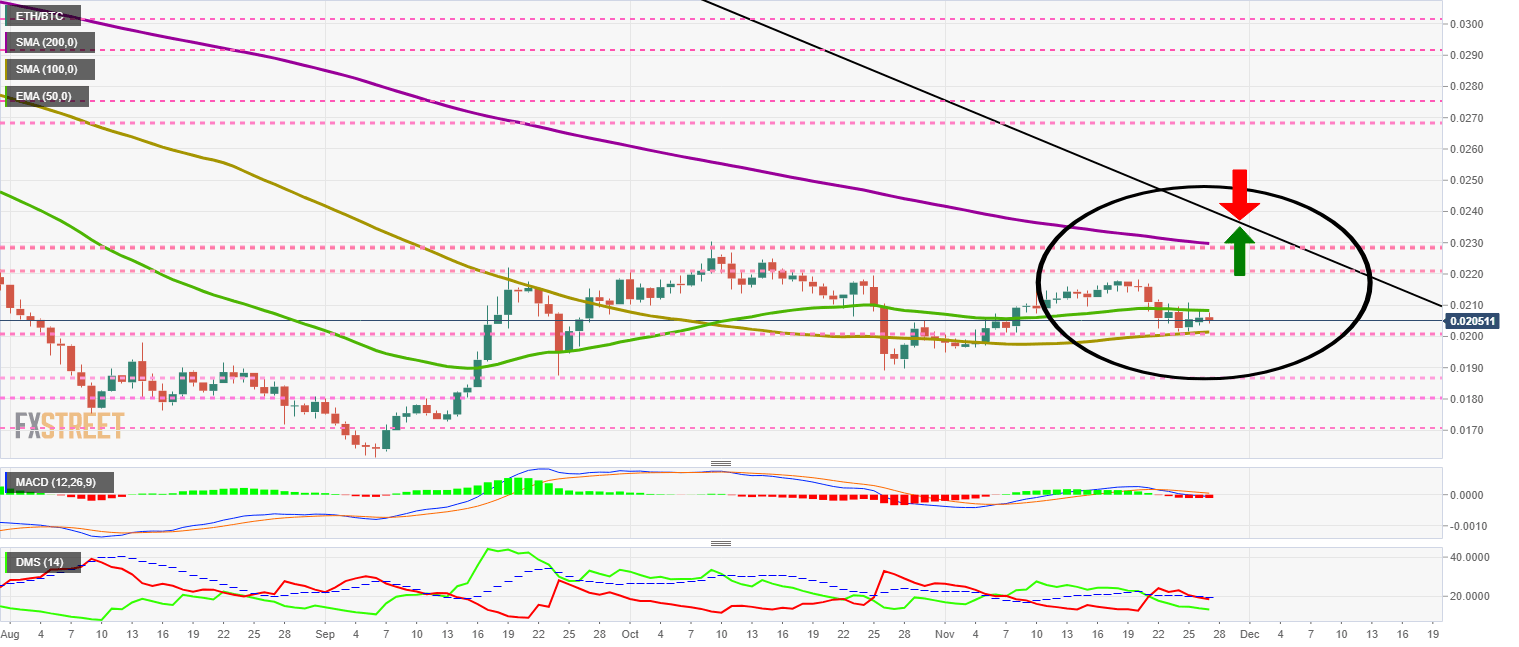
The MACD on the daily chart remains in the positive territory of the indicator and therefore keeps the momentum of the bullish momentum intact.
The DMI on the daily chart shows us how the bears lose the support of the ADX line and activate a pattern of leadership change. The bulls, for now, ignore it and do not lend themselves to exchange leadership with the bears.
BTC/USD Daily Chart
The BTC/USD pair is currently trading at the $7,100 price level and takes advantage of a new security breach in exchange as an excuse to look for lower prices that may attract fresh money.
The bearish scenario has its limit at the $5,000 level, where the most aggressive traders will plant their best orders.
Above the current price, the first resistance level is at $7,120, then the second at $7,400 and the third one at $7,500.
Below the current price, the first support level is at $6,750, then the second at $6,500 and the third one at $6,350.
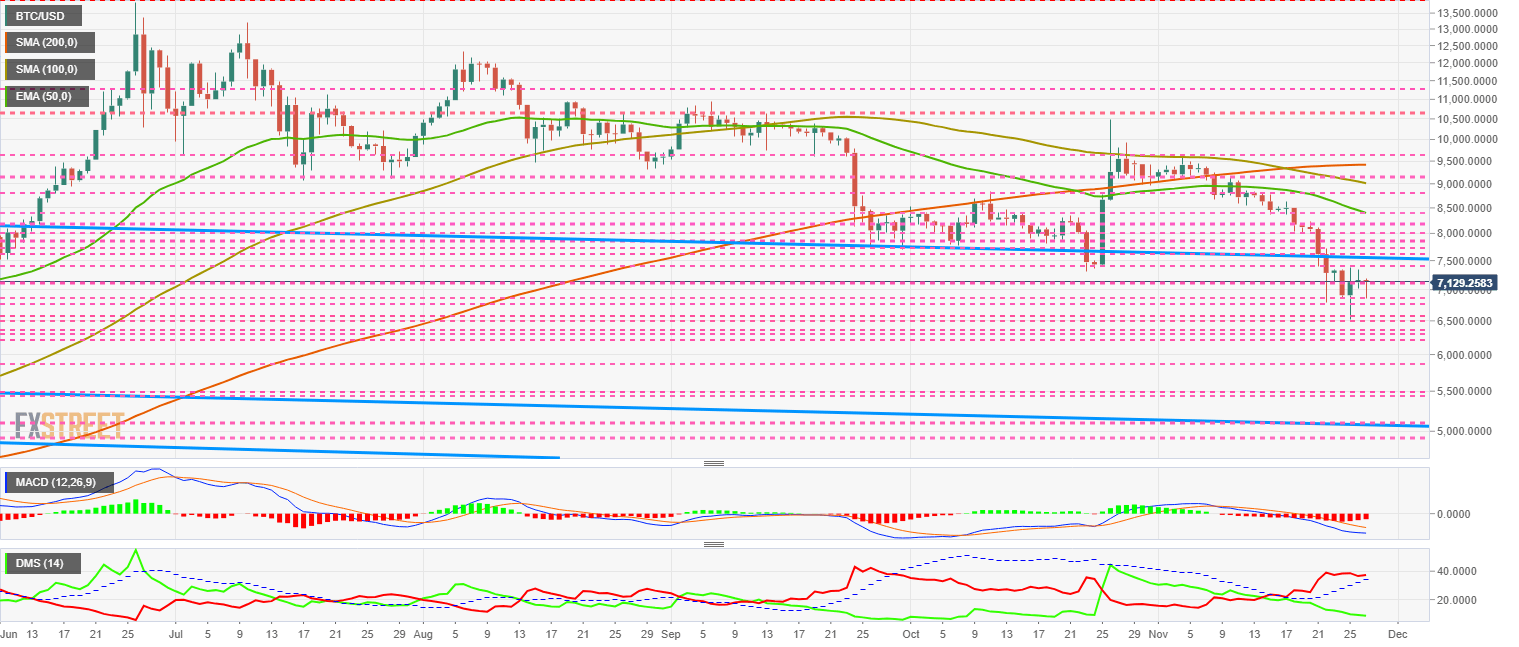
The MACD on the daily chart shows the formation of a terminal pattern. We can say that it is at the mid-point of development, which leads us to project the critical phase of this bearish movement within a couple of weeks.
The DMI on the daily chart shows the bulls at minimum levels not seen since late September. The bears pause and seek support in the ADX line. If this dynamic support holds, we will see a new significant downtrend.
ETH/USD Daily Chart
The ETH/USD pair is currently trading at the $146.2 price level. The $140 price congestion support holds for the moment, but only a surprise twist of events can prevent the Ethereum from visiting the $115-$120 zones.
Despite the recent news with which I open this article, the ETH/USD pair is not turning out to be the most cautious, reinforcing the idea that the theft is only an excuse to go down.
The ETH/USD pair is very deviated from average levels, both on moving averages and on indicators. This situation could lead to a robust upward bounce at the first bullish excuse.
Above the current price, the first resistance level is at $150, then the second at $155 and the third one at $160.
Below the current price, the first support level is at $140, then the second at $130, and the third one at $125.
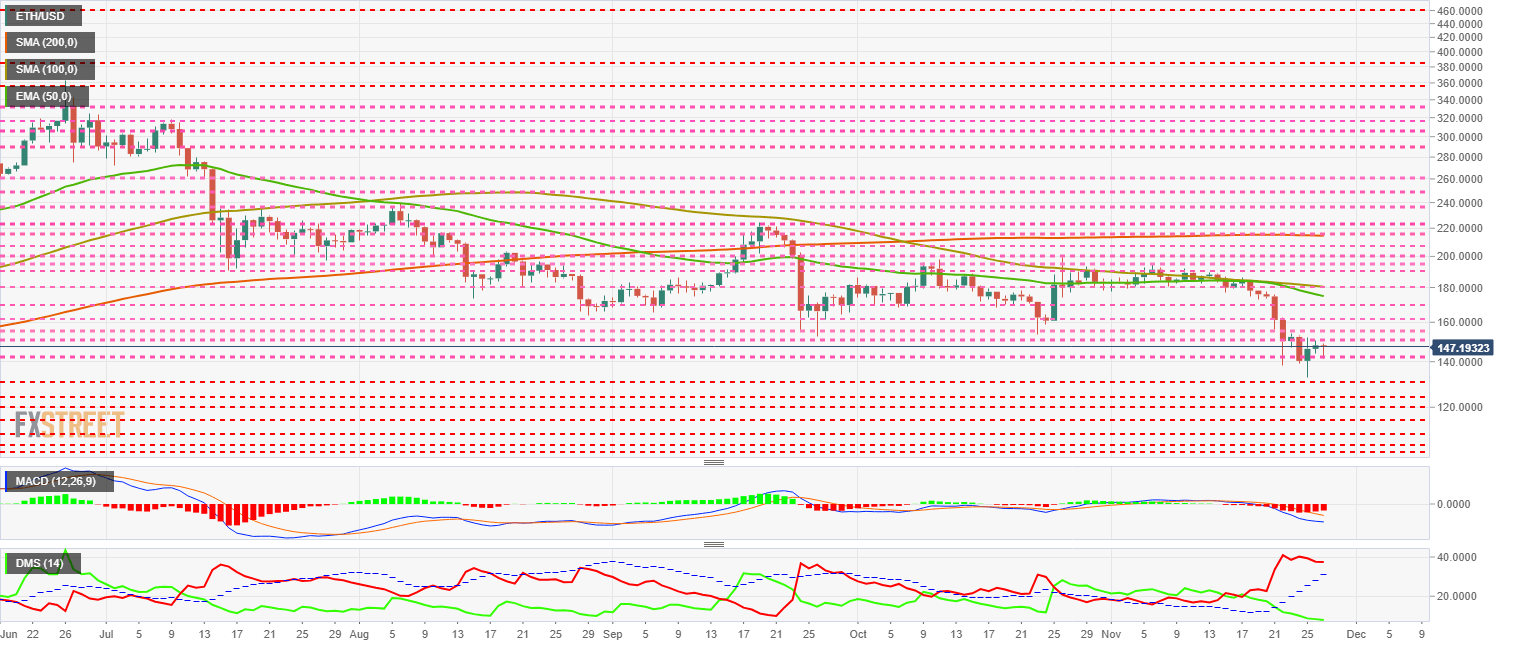
The MACD on the daily chart shows an active bearish profile and, similar to the case of the BTC/USD pair, projects a continuation of the bearish trend in the short term.
The DMI on the daily chart shows the bulls at ground levels, not seen since December 2018. The bears also did not see bearish trend strength levels since December 2018.
XRP/USD Daily Chart
The XRP/USD is currently trading at the $0.219 price level. XRP shows a stronger resilience to the new bearish wave than Bitcoin or Ethereum.
As we will see in the analysis of indicators, XRP can be the first to evolve to the rise of the three components of the Top3.
Above the current price, the first resistance level is at $0.22, then the second at $0.24 and the third one at $0.25.
Below the current price, the first support level is at $0.19, then the second at $0.17 and the third one at $0.165.

The MACD shows a much more extensive development than we see in the Bitcoin and Ethereum pairs. In the last few days, it seems that the indicator begins to lose the bearish slope.
The DMI on the daily chart clearly shows how the bears lose the support of the ADX line, while the bulls react quickly and are already leaning upwards. This structure is very conducive to a possible upturn.
Get 24/7 Crypto updates in our social media channels: Give us a follow at @FXSCrypto and our FXStreet Crypto Trading Telegram channel
Author

Tomas Salles
FXStreet
Tomàs Sallés was born in Barcelona in 1972, he is a certified technical analyst after having completing specialized courses in Spain and Switzerland. He expanded his technical training following the guidance of great experts on the financial markets.


