Top 3 Price Prediction Bitcoin, Ethereum, Ripple: Time to rally? IMF hints crypto is “next step of money”
- The IMF has published a video highlighting the qualities of cryptocurrencies as a future evolution of money.
- Price declines accelerate as bears begin to take control of the market.
- Positive sentiment is increasing despite the falls, and is once again entering a zone of extreme optimism.

On August 23, the International Monetary Fund (IMF) released a short video in which – no more and no less – it supported Blockchain technology as the possible "money of the future".
Despite existing risks of the cryptocurrency ecosystem and its limited acceptance, the IMF highlights the cost reduction, security and speed in international transactions.
What are cryptocurrencies? https://t.co/ggONlLkA2r pic.twitter.com/yYpj3Jf37E
— IMF (@IMFNews) August 23, 2020
Possibly. the IMF is doing its job and starting to create an argumentative base for the implementation of digital currencies issued by central banks (CBDC) soon.
The crypto market saw the falls accelerating on Tuesday, and the charts show that the prices reached the first support levels, which will define what can happen in the next sessions.
Bitcoin, Ethereum and Ripple are moving around significant support areas while the buying and selling forces are facing each other to elucidate who will lead the price.
Below the current levels are the leading moving average – and it would be wise to avoid getting between them. Price movements between these moving averages are often erratic and constantly changing in direction.

The market sentiment level has risen by one point, which is surprising when red was the predominant color yesterday. The indicator that by alternative.me is around 76 and goes back into the zone of extreme greed, something negative for the market in the short term.
ETH/BTC Daily Chart
ETH/BTC is currently trading at 0.03367 and is returning to price congestion support at 0.0332, below which is the 50-day exponential moving average.
Above the current price, the first resistance level is at 0.035, then the second at 0.0372 and the third one at 0.0381.
Below the current price, the first support level is at 0.0332, then the second at 0.0316 and the third one at 0.030.
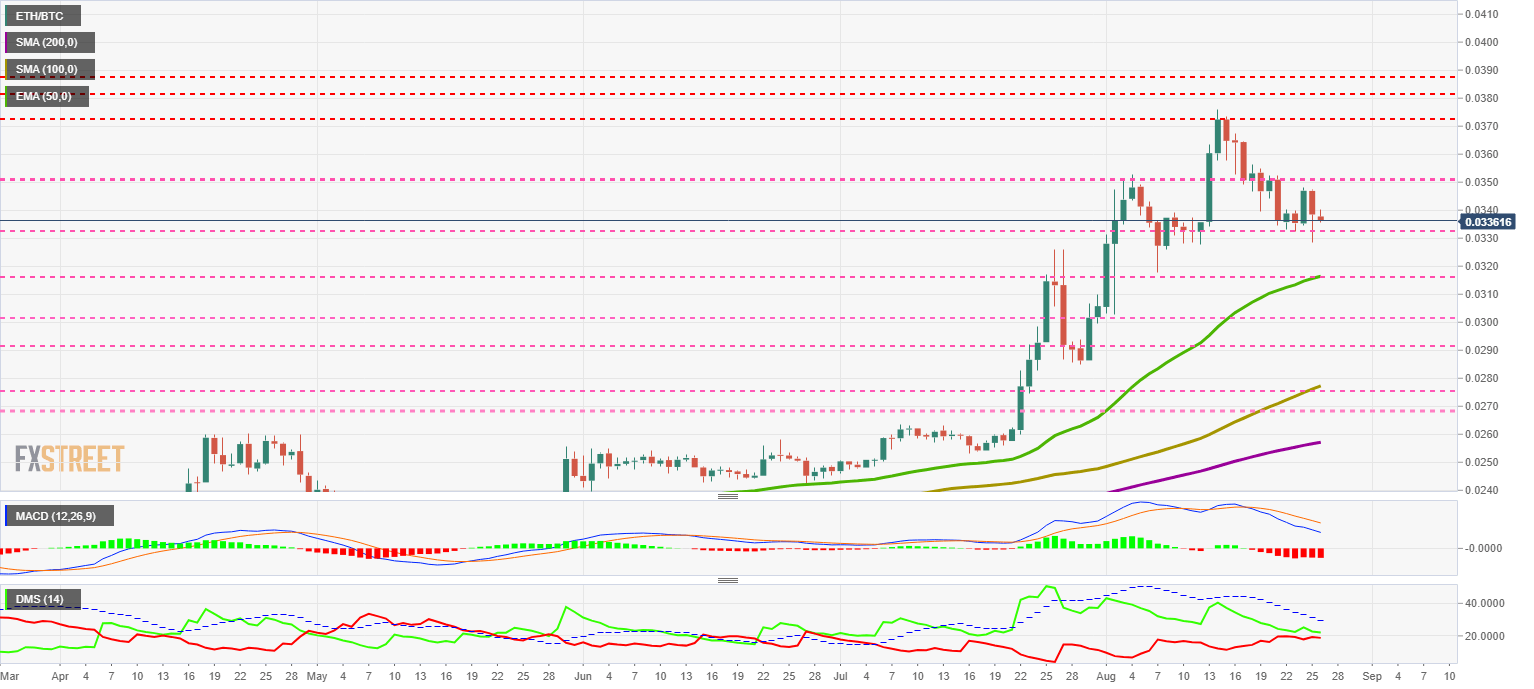
The MACD on the daily chart continues the downward trend in a powerful way. The first destination for the averages that make up the indicator is the zero level, a neutral zone that traditionally serves as support.
The DMI on the daily chart shows both sides of the market about to meet, which will add volatility to the price of the ETH/BTC pair.
BTC/USD Daily Chart
BTC/USD is currently trading at the price level of $11,340 trying to hold above the congestion support of the price at $11,300 and the 50-day exponential moving average.
Above the current price, the first resistance level is at $12,400, then the second at $14,000 and the third one at $17,200.
Below the current price, the first support level is at $11,300, then the second at $10,980 and the third one at $10,650.

The MACD on the daily chart continues to move downward but less intensely than its peers, a typical pattern in the crypto market. This recurring behavior means that Bitcoin does better than Altcoins in the bear market.
The DMI on the daily chart shows the bears above the bulls, although there is so little advantage on the sell-side that can be left in a quick draw.
ETH/USD Daily Chart
ETH/USD is currently trading at $382.3. A few cents down and the next destination will be the 50-day exponential moving average.
Above the current price, the first resistance level is at $440, then the second at $460 and the third one at $485.
Below the current price, the first support level is at $380, then the second at $355 and the third one at $323.
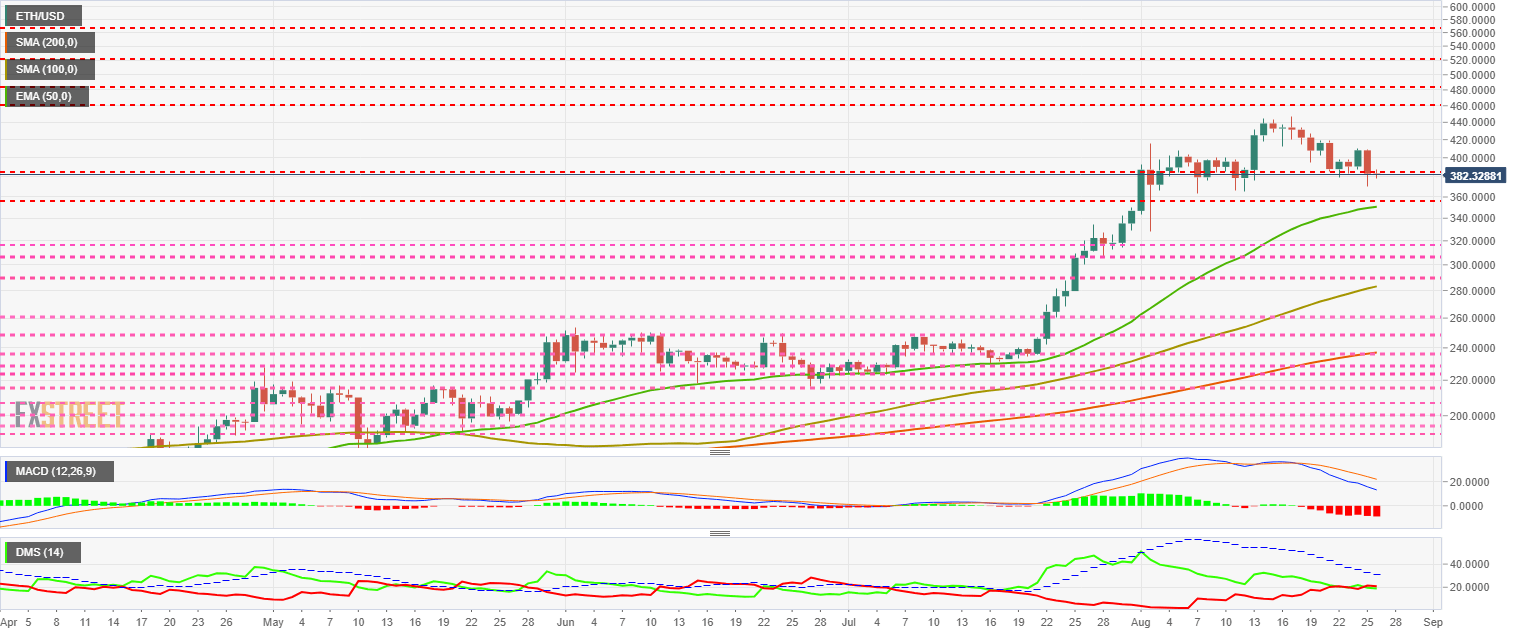
The MACD on the daily chart expands the bearish profile, both in terms of slope and in terms of the separation between the moving averages. The downward movement should accelerate in the next two days.
The DMI on the daily chart shows how bulls and bears are aggressively fighting for the lead, with constant changes in leadership. Today the sell-side is in command.
XRP/USD Daily Chart
XRP/USD is currently trading at $0.2758 and is dangerously close to the lower limit of the price range in recent weeks. The primary target is the 50-day EMA is at the $0.26 price level.
Above the current price, the first resistance level is at $0.283, then the second at $0.288 and the third one at $0.30.
Below the current price, the first support level is at $0.265, then the second at $0.26 and the third one at $0.253.
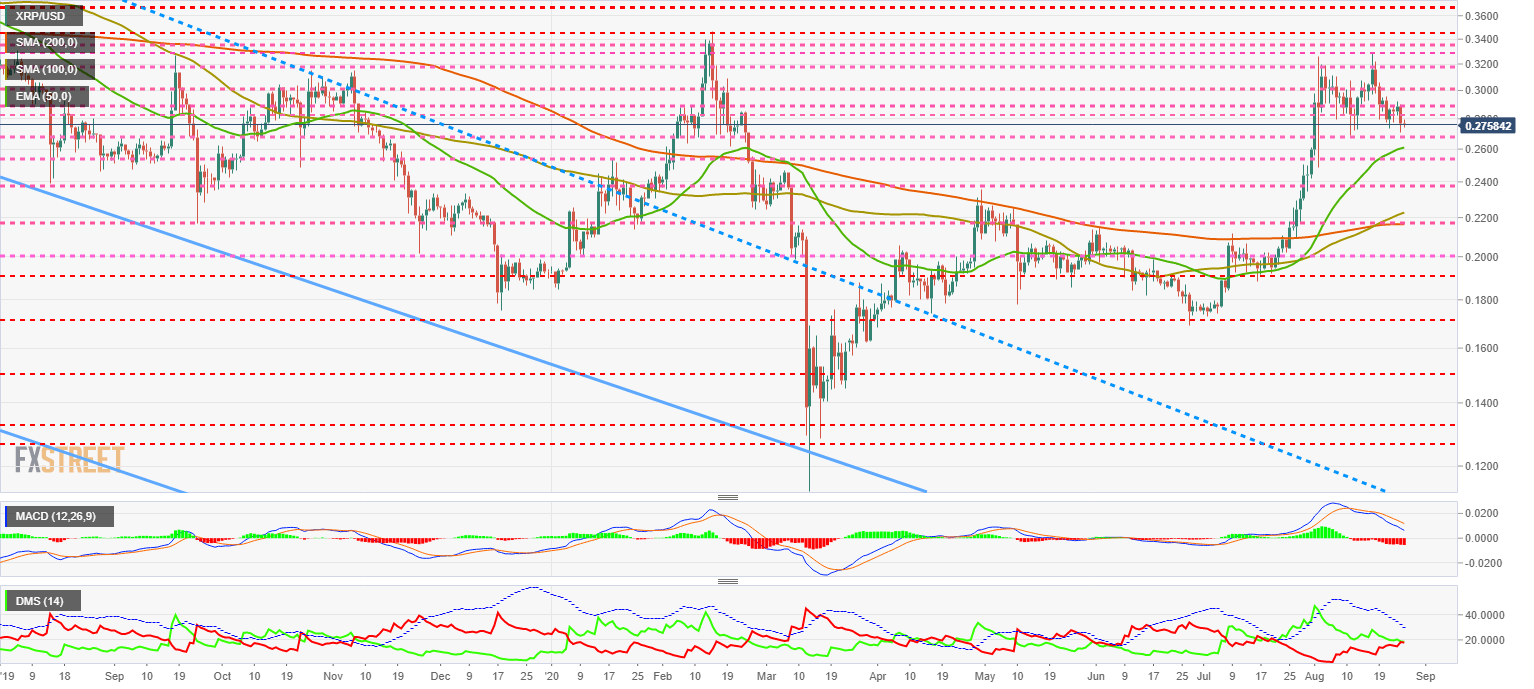
The MACD on the daily chart shows an increase in the bearish profile of the moving averages that make up this indicator. The speed of the downward movement should increase in the next few days.
The DMI on the daily chart shows the first confrontation between bulls and bears since July 20th.
Author

Tomas Salles
FXStreet
Tomàs Sallés was born in Barcelona in 1972, he is a certified technical analyst after having completing specialized courses in Spain and Switzerland. He expanded his technical training following the guidance of great experts on the financial markets.


