Top 3 Price Prediction Bitcoin, Ethereum, Ripple: One, two, Freddy's coming for you
- Downward pressure is increasing in a complacent market.
- Bitcoin, Ethereum and Ripple flirt with critical support levels in the short term.
- One side of the market expects to earn more, the other to buy cheaper.

One, two, Freddy's coming for you.
Three, four, better lock your door.
Five, six, grab your crucifix.
Seven, eight, gonna stay up late.
Nine, ten, never sleep again.
Source: A Nightmare on Elm Street
Wednesday’s trading saw few significant changes among the main protagonists of the segment. Nothing has changed in the numbers, although technically it has evolved towards the confrontation between the two forces that dispute the control of the price.
The desire to continue with the upward movement is still considerably high, as shown by the sentiment indicator that alternative.me compiles. The market sentiment indicator has dropped to 75 and remains at there – just below the border of the "extreme greed" zone.
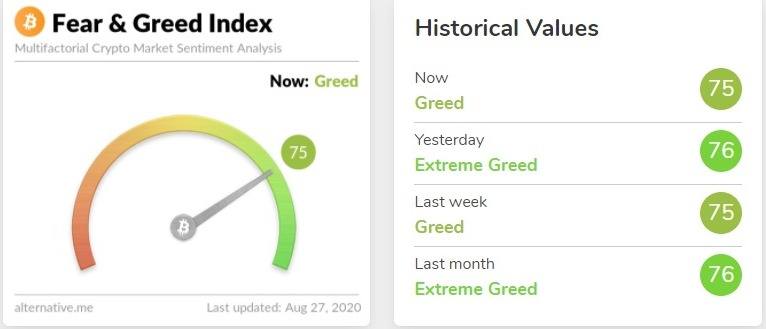
Source: alternative.me
However, the crypto market has a devilish way of managing tempos that consumes the patience of many position traders. It is a slow market in mid-term changes of direction, in contrast to the speed it acquires when it gains trend strength.
To better understand the emotional cycle that this pattern of behavior causes, we see an exciting presentation published by CRYPTO₿IRB (@crypto_birb) on Twitter:
hope / optimism $BTC pic.twitter.com/vUkXY7iV24
— CRYPTO₿IRB (@crypto_birb) August 27, 2020
This graphic applies to all timeframes and time expectations. From a long term point of view, one could say that markets are at point 2 – hope. Nevertheless, in the short term, a probable scenario is that the situation is at 7 – complacency.
As we have seen above, the level of sentiment remains substantially high even though it is evident that the market has lost its upward momentum, and the bears are about to take control of the leading cryptos.
If this scenario is correct, the crypto market has a few weeks of significant fluctuations in the traders’ sentiment level ahead of it – an excellent opportunity for those who can take advantage of people' fears.
ETH/BTC Daily Chart
ETH/BTC is currently trading at 0.0338 and is rising slightly but not too far from the critical support level of 0.0332.
Above the current price, the first resistance level is at 0.0351, then the second at 0.0365 and the third one at 0.0372.
Below the current price, the first support level is at 0.0332, then the second at 0.0315 and the third one at 0.0301.
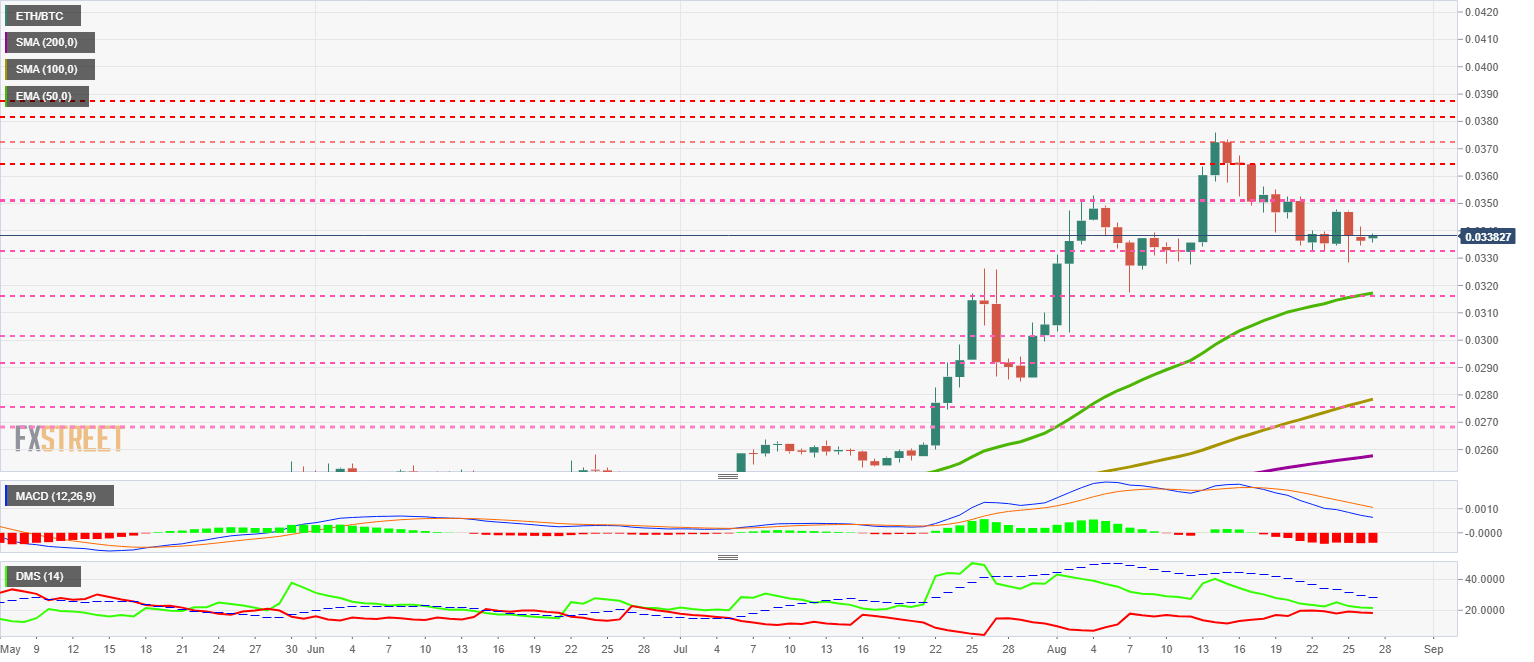
The MACD on the daily chart shows the same profile as on Wednesday, with a significant downward slope and vast line distance. There are no indications of a possible change in direction.
The DMI on the daily chart shows both sides of the market following each other in a short distance. It is improbable that bulls and bears will give up the showdown when they are so close.
BTC/USD Daily Chart
BTC/USD is currently trading at $11,385 and is still playing make-believe. The continuity of the lateral range is gradually eroding the patience of traders who take risky positions.
Above the current price, the first resistance level is at $12,250, then the second at $14,000 and the third one at $17,160.
Below the current price, the first support level is at $11,250, then the second at $10,950 and the third one at $10,650.
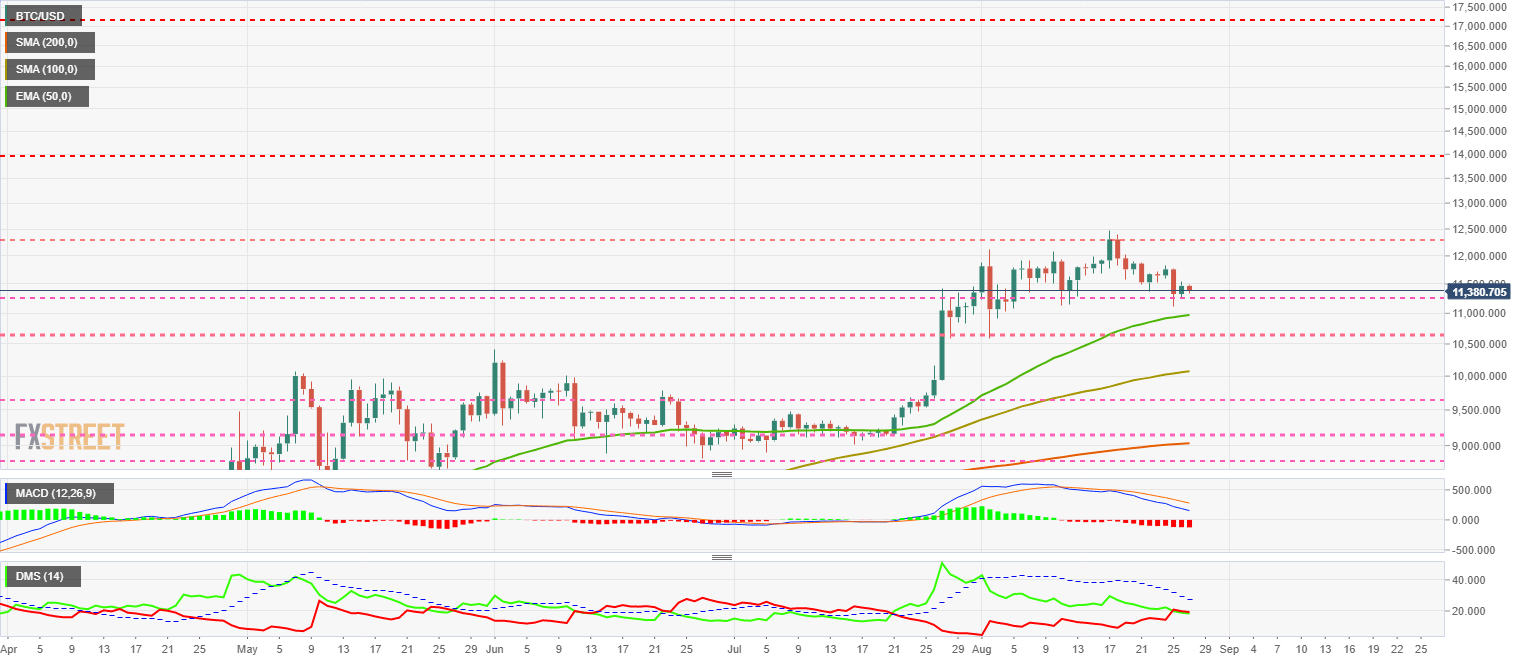
The MACD on the daily chart continues to develop the previous bearish profile unchanged. There are no signs of a significant upward movement, but we should expect a downward trend at some point.
The DMI on the daily chart shows bears moving above the bulls, but without a good lead to take control of the BTC/USD pair.
ETH/USD Daily Chart
ETH/USD is currently trading at the price level of $381.4 and is approaching the critical support level again at $340.
Below the current price, the first resistance level is at $380, then the second at $360 and the third one at $315.
Above the current price, the first support level is at $408.50, then the second at $440 and the third one at $460.
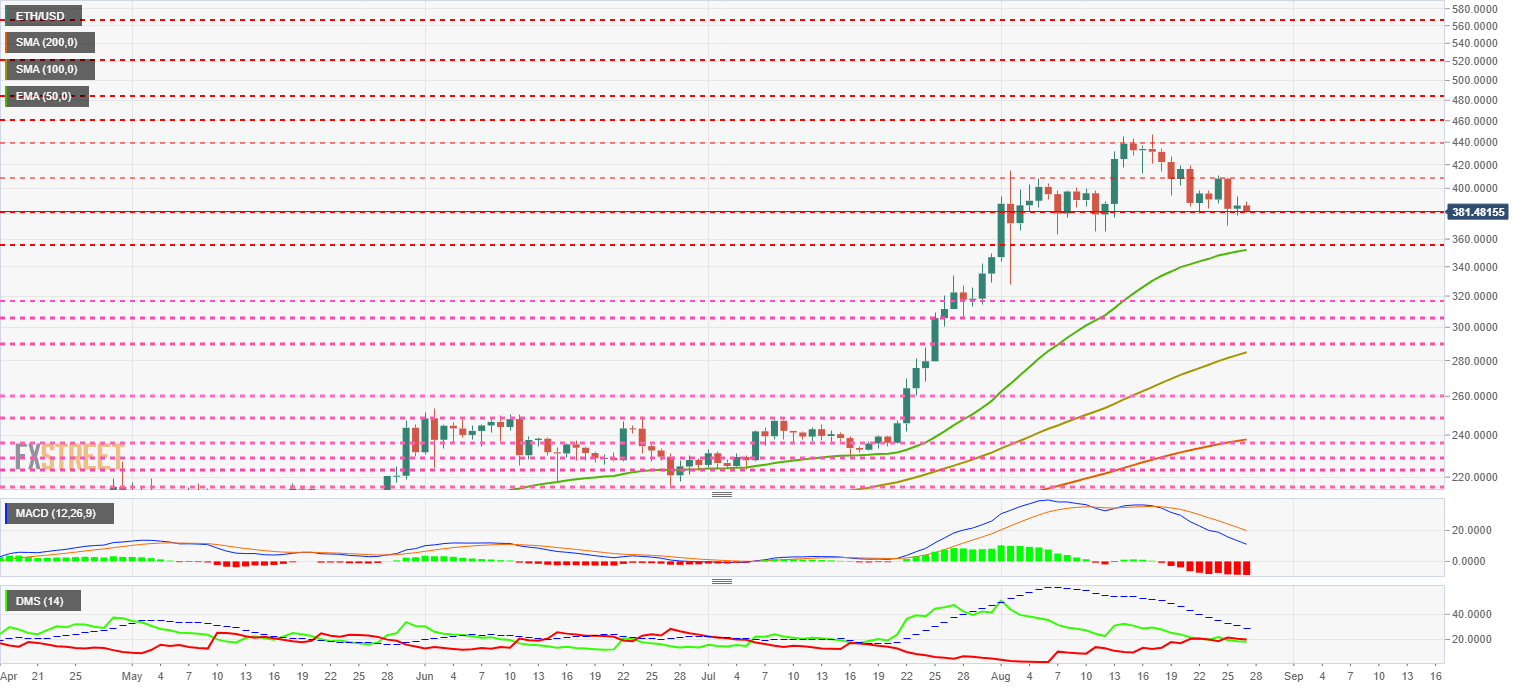
The MACD on the daily chart increases the bearish profile as the line spacing increases. It is rare for this type of shape in the MACD not reflected in the price with significant declines.
The DMI on the daily chart shows bears outperforming bulls, but without enough distance to give the selling side control of the ETH/USD pair.
XRP/USD Daily Chart
XRP/USD is currently trading at $0.2739 and joins the game of exhausting traders' patience by doing nothing.
Above the current price, the first resistance level is at $0.2850, then the second at $0.2900 and the third one at $0.3000.
Below the current price, the first level of support is at $0.2680, then the second at $0.2620 and the third one at $0.2545.
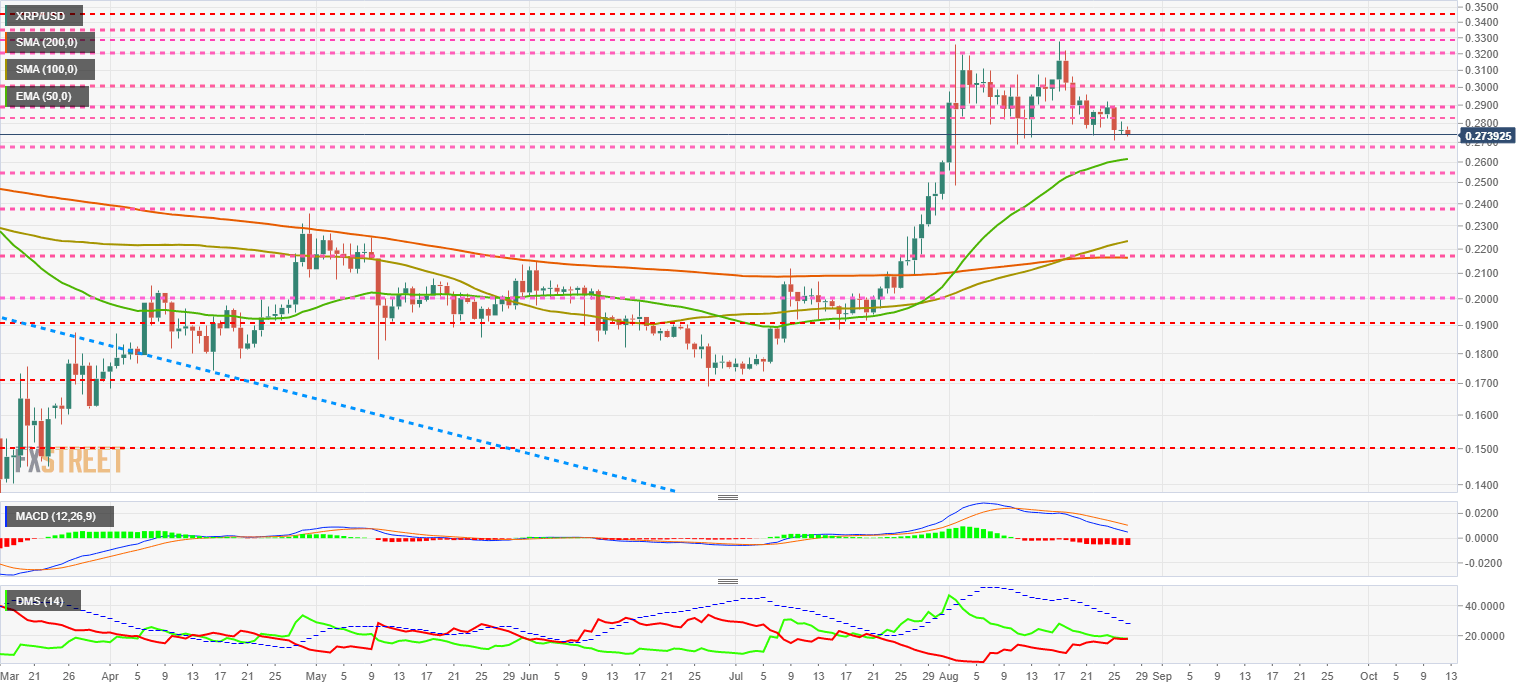
The MACD on the daily chart continues to develop the bearish cross, although it does so with less intensity than the BTC/USD and ETH/USD pairs.
The DMI on the daily chart shows bears retaining a slight advantage over bears. Although the buying side has controlled XRP/USD over the past few weeks, this is no longer the case.
Author

Tomas Salles
FXStreet
Tomàs Sallés was born in Barcelona in 1972, he is a certified technical analyst after having completing specialized courses in Spain and Switzerland. He expanded his technical training following the guidance of great experts on the financial markets.


