Top 3 Price Prediction Bitcoin, Ethereum, Ripple: No one wants to sell as BTC and ETH consolidate in time versus price
- Bitcoin price consolidates along the strategically important 200-day simple moving average (SMA) on lighter volume.
- Ethereum price and Relative Strength Index (RSI) flashing a bearish momentum divergence as the altcoin steadies above $3,000.
- XRP price tests psychologically important $1.00 after biggest daily gain since May 24.

Bitcoin price and Ethereum consolidate notable gains above critical resistance that has become support as XRP price reaches a short-term top and contemplates the next leg higher.
Bitcoin price bears continue to hibernate
Bitcoin price enters the weekend in a corrective phase that is being instructed by the 200-day SMA at $45,246 and the 50% retracement of the April-July correction at $46,849, releasing the overbought conditions on the daily BTC chart.
The 55.89% gain from July 21 ranks as one of the better 24-day periods since trading began, but more importantly, it is a gain that has marked temporary highs in BTC in the past. Nevertheless, Bitcoin price is not at a concerning deviation above the 50-day SMA, currently at $36,580, suggesting that the pause will not be deep and should keep the bears in hibernation.
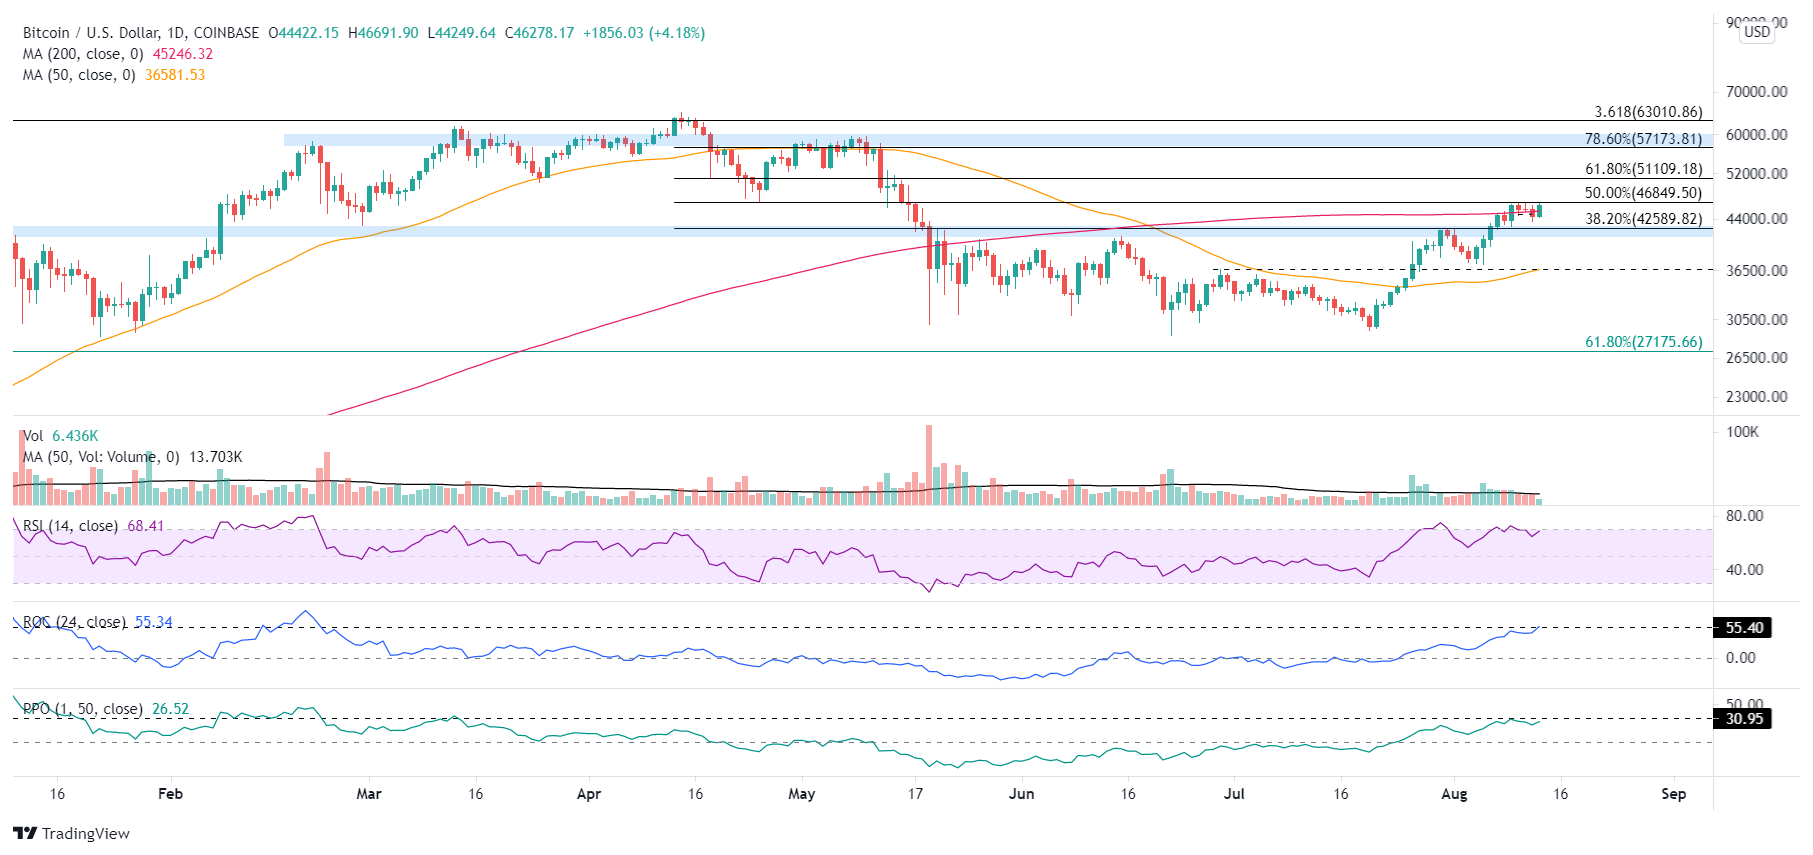
BTC/USD daily chart
Suppose BTC does incur heavier selling pressure. In that case, Bitcoin price should locate formidable support between $41,000 and $43,000, reinforced by the 50 six-hour SMA at $42,608, the 38.2% Fibonacci retracement at $42,589 and the trend line beginning at the July low at $42,370. Based on the bullish BTC narrative, the correction should not exceed 10-12% from the August 11 high of $46,781.
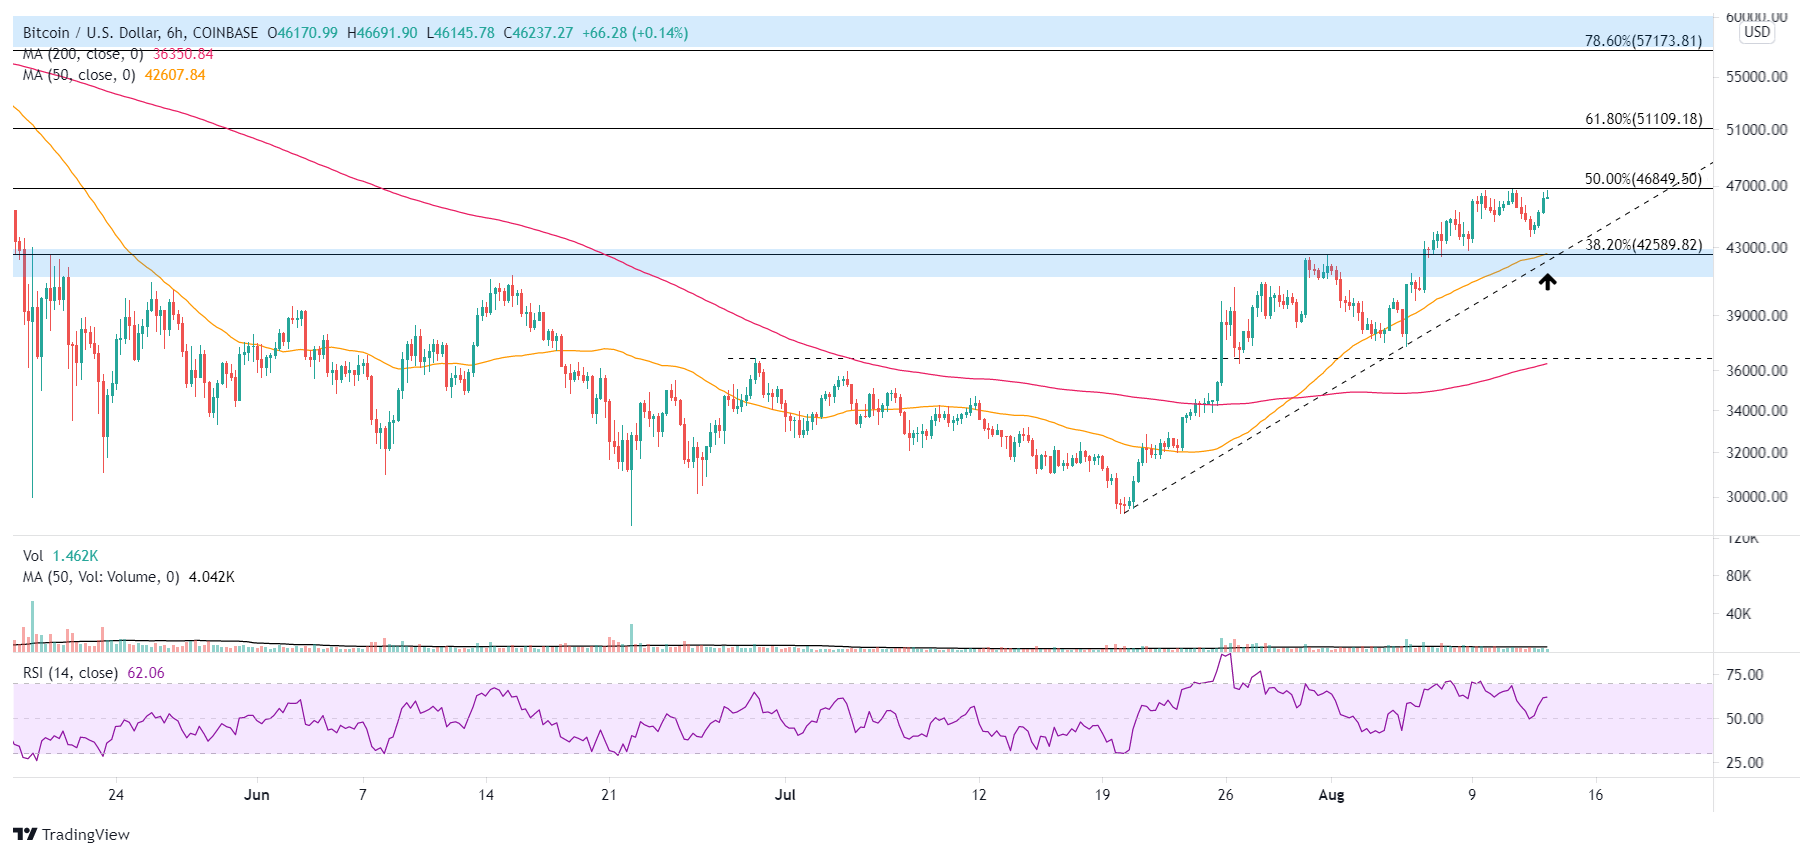
BTC/USD 6-hour chart
A daily close below $41,000 would prompt a much deeper BTC pullback, potentially down to the 50-day SMA at $36,581, which aligns closely with the June 29 high of $36,675 and equates to a 20% decline from the current Bitcoin price.
Bitcoin price is at an inflection point. It has overcome the challenges presented by the BTC price action beginning on May 19 but now balances between a correction in time versus price before resuming the rally higher.
Here, FXStreet's analysts evaluate where BTC could be heading next as it looks primed to retrace.
Ethereum price turns a deaf eye to the bears
Ethereum price has climbed 78.62% since July 21, matching the gains recorded near the May high and is similar to the levels that immediately preceded ETH declines from 2018-2020, hinting at an overbought condition.
Equally impressive is that Etherum price has logged only four negative sessions over the last 24 days, including one session that closed with a doji candlestick pattern and a loss of -$0.64. As a result, the developing pause may provide the first opportunity for ETH investors to add to or initiate positions. Still, it will ignore the bearish predictions of a punishing sell-off.
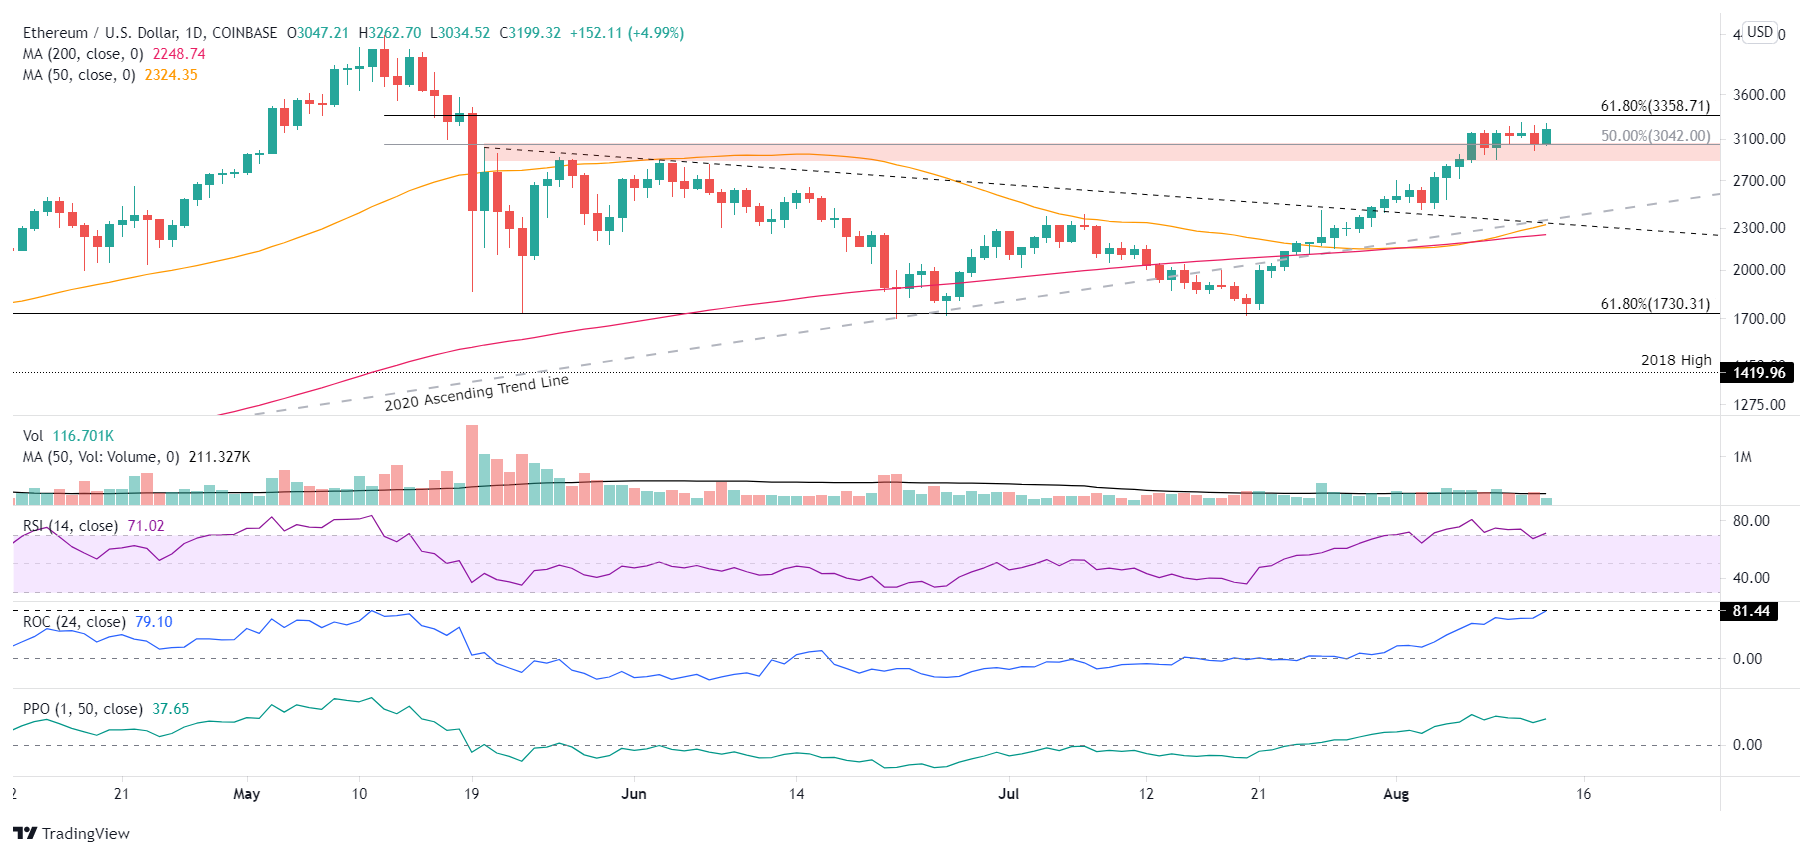
ETH/USD daily chart
The ETH consolidation should continue to attract demand between $2,900 and $3,050. The Ethereum price levels are associated with rebound highs following the May 19 and 23 collapses. The range is strengthened by the 50% retracement of the entire May-July correction at $3,042, the trend line from the July low around $3,000 and the 50 six-hour SMA at $2,895.
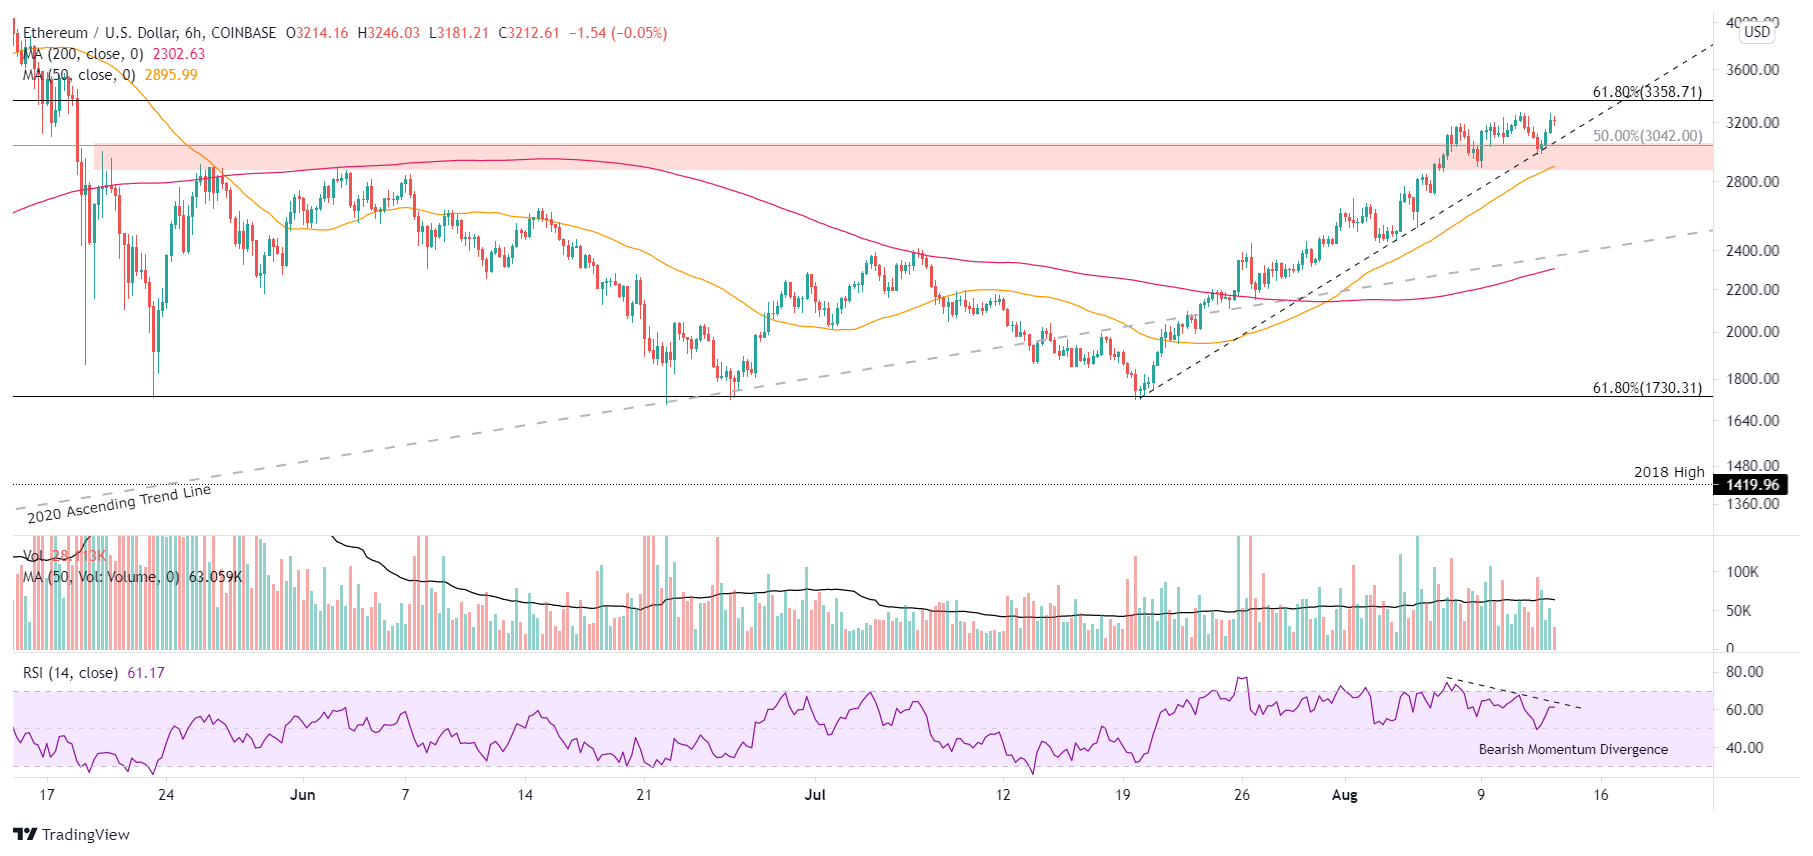
ETH/USD 6-hour chart
Ethereum price could immediately resume the rally, but from a longer-term perspective, it would be healthy for the ETH intermission to develop longer and deeper, clearing all the weak holders and establishing the basis for a final thrust to the all-time high of $4,384.
Here, FXStreet's analysts evaluate where ETH could be heading next as it tests a crucial resistance level.
XRP price contemplating the timing of the next leg higher
At the current XRP price, Ripple has climbed 93.57% since July 21, reached an overbought reading on the daily RSI and claimed the psychologically important $1.00 for the first time since the beginning of June.
In the short term, the $1.00-$1.06 range will be a challenge to overcome, but the impulsiveness of the Ripple rally since the breakout from the double bottom pattern projects that it will happen sooner rather than later.
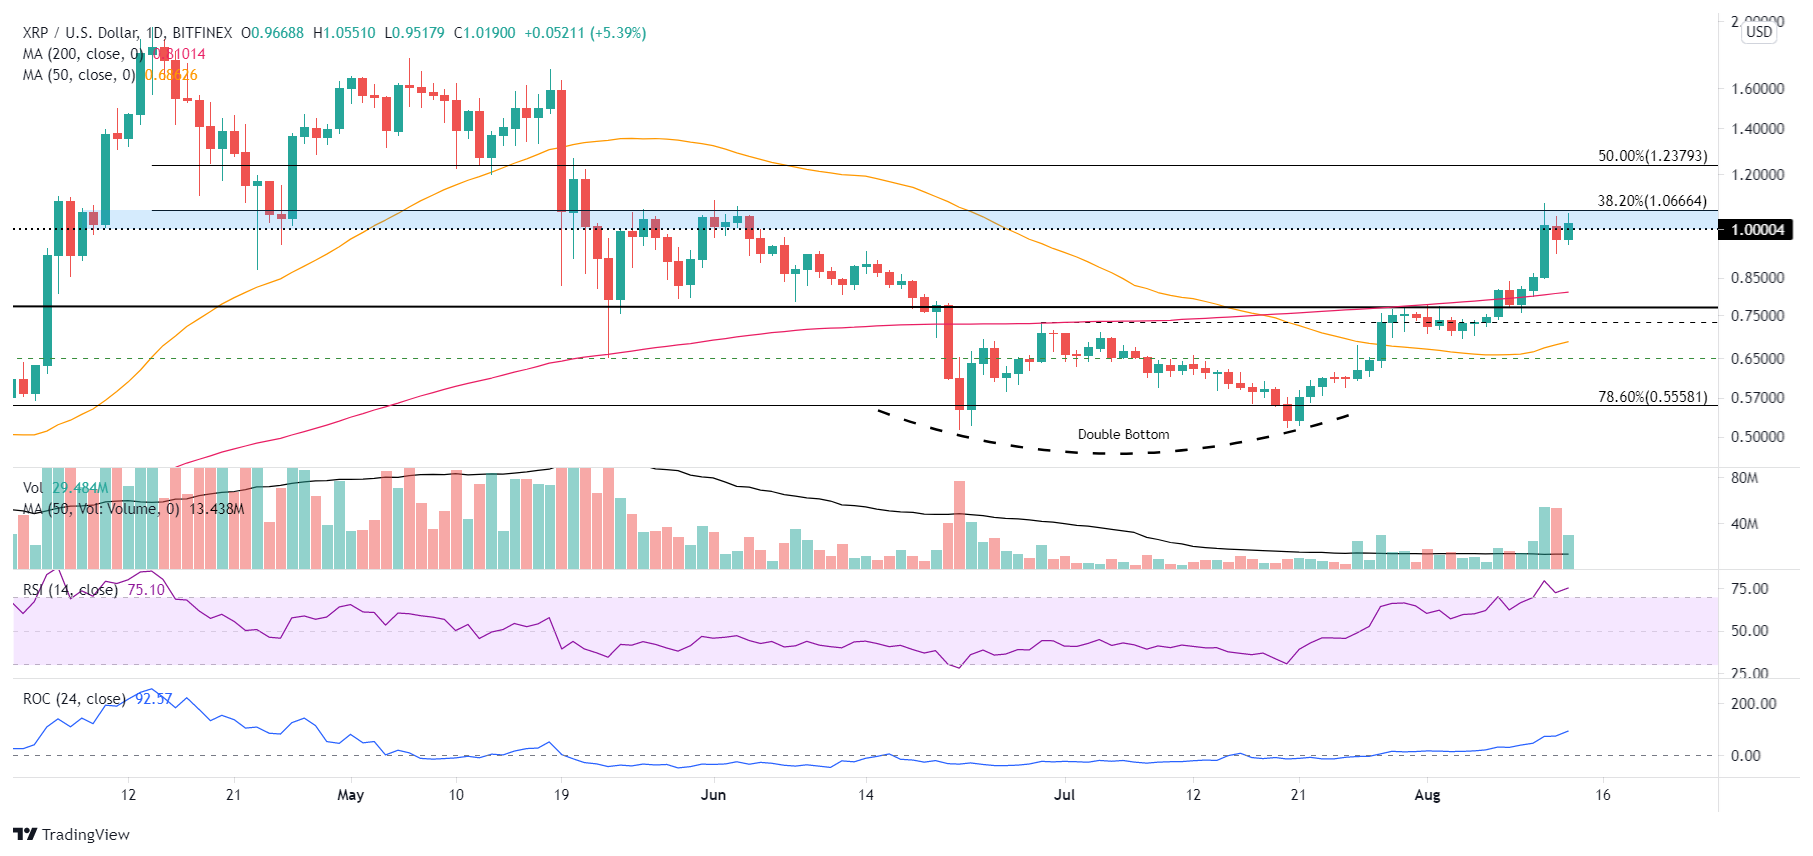
XRP/USD daily chart
XRP price may now be contemplating the timing of the next leg higher. Nevertheless, it is prudent not to overlook the ongoing legal battle with the SEC. If Ripple suffers a temporary defeat in the proceedings, it may negatively influence XRP price, potentially dramatically.
A news-driven Ripple reversal should strike substantial support at the 200-day SMA at $0.810 and the neckline of a multi-year inverse head-and-shoulders pattern around $0.770.
So far, the three crypto majors have proceeded with consolidations in time versus price, exemplifying the strength of the underlying bid in the cryptocurrency market and offering confirmation that credible lows have been printed.
Here, FXStreet's analysts evaluate where Ripple could be heading next as it attempts to resume the uptrend.
Author

Sheldon McIntyre, CMT
Independent Analyst
Sheldon has 24 years of investment experience holding various positions in companies based in the United States and Chile. His core competencies include BRIC and G-10 equity markets, swing and position trading and technical analysis.



