Top 3 Price Prediction Bitcoin, Ethereum, Ripple: How long can crypto markets keep rallying?
- Bitcoin price momentum slows down as it faces trouble crossing the $24,565 resistance level.
- Ethereum price reverses after failing to go over the $1,730 hurdle, hitting a retracement.
- Ripple price has sliced through the $0.381 blockade, but failing to sustain below it could result in a correction.

Bitcoin price shows signs of exhaustion after retesting a major hurdle. This development could result in a correction if bulls can't make a comeback. Ethereum price, despite the Merge narrative, remains correlated to BTC and could tumble if the big crypto does. Ripple price will promptly follow the two largest cryptos should they collapse.
Bitcoin price and trend reversal
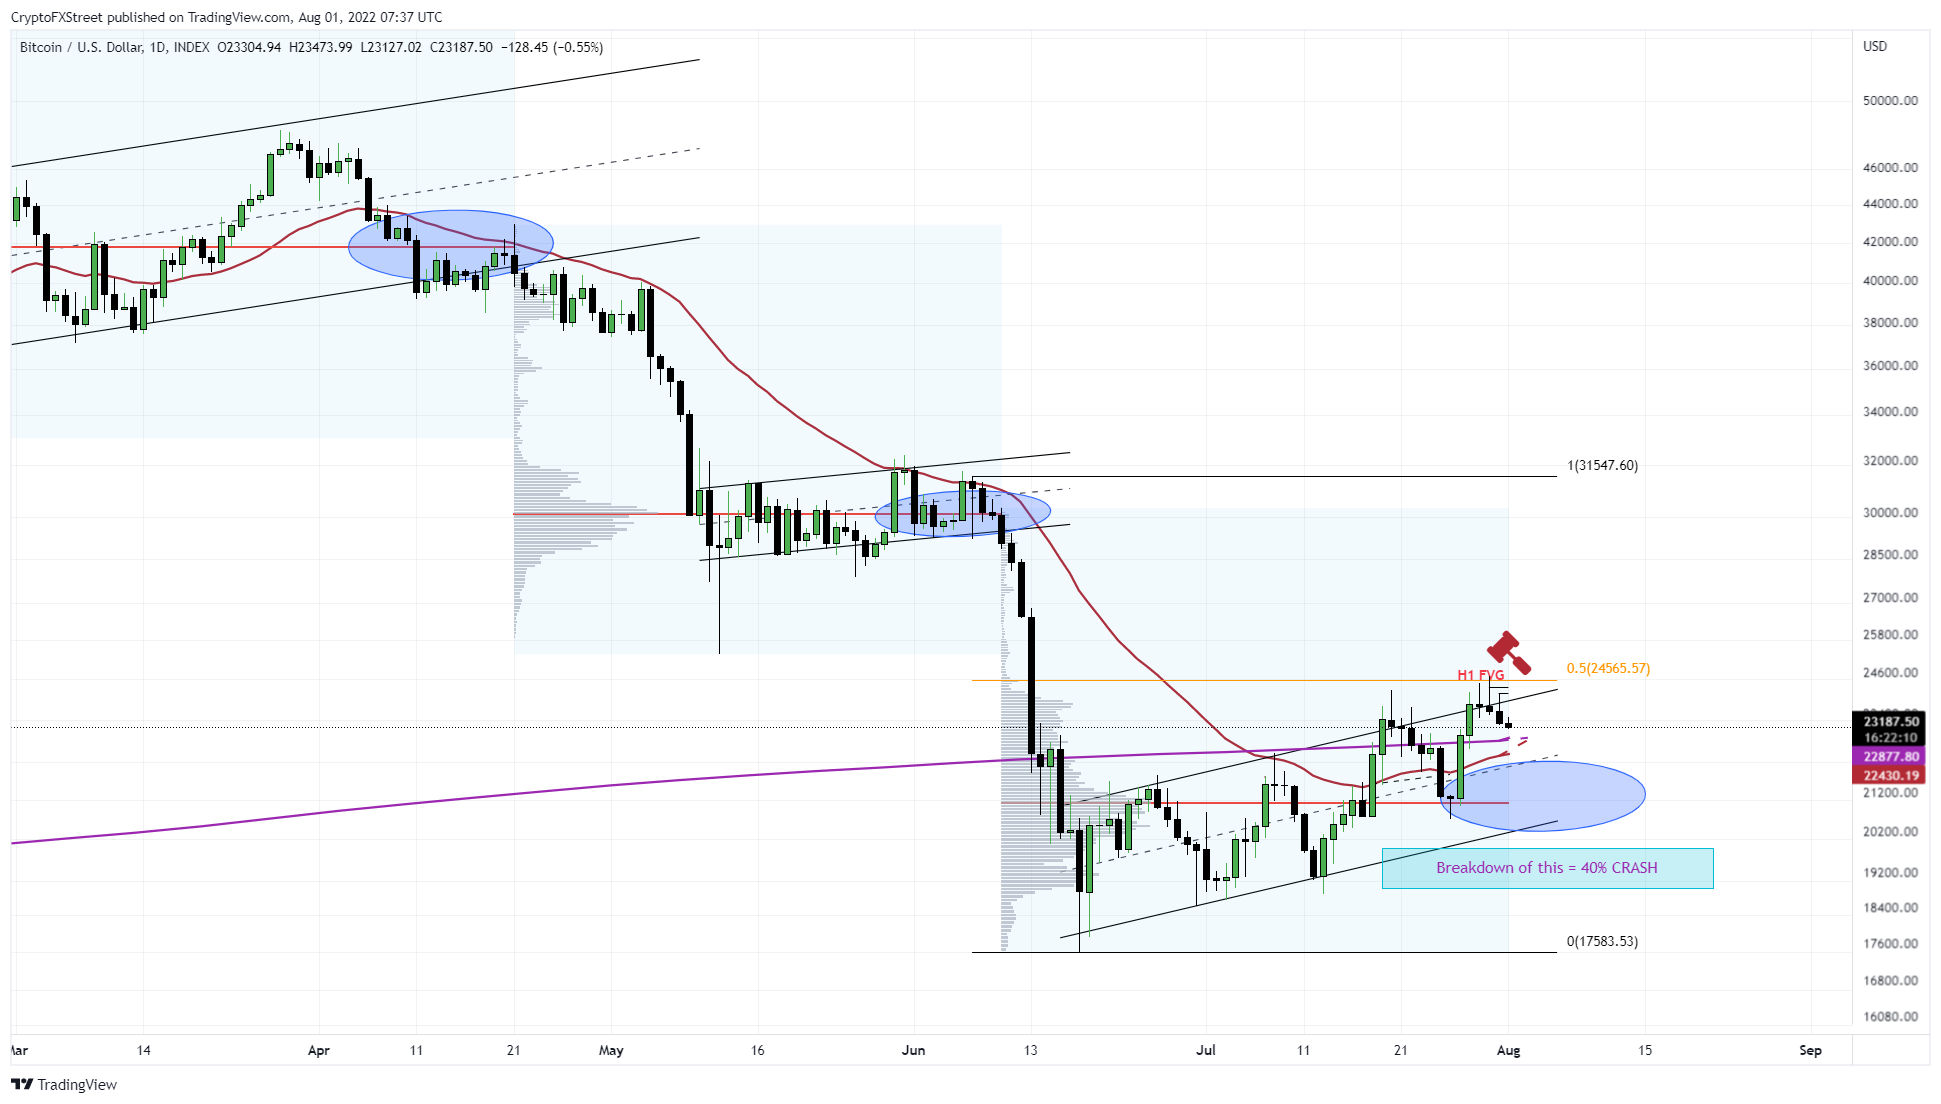
Bitcoin price has been rising and falling in channels since January 2022. Each time an ascending corrective channel has stalled and broken down it has led to an immense crash. The leg-ups have always consolidated around the point of control (POC), aka the highest traded level.
As of now, the volume profile shows that the POC is at $21,128. Hence, investors can expect a sudden spike in selling pressure at this level to push BTC down. A breakdown of this level places the big crypto at the mercy of an inflection point, which extends from $19,000 to $20,000.
If this support area also breaks down, investors can expect another flash crash that could push Bitcoin price anywhere from $13,000 to $12,000.
BTC/USD 1-day chart
While things are looking slow for Bitcoin price, a bounce off the confluence of the 200-week SMA and the 30-day EMA at roughly $22,700 could give buyers a chance to make a comeback. If BTC produces a daily candlestick close above $24,565 and flips this level into a support floor, the bearish thesis will face invalidation.
Ethereum price ready for a pullback
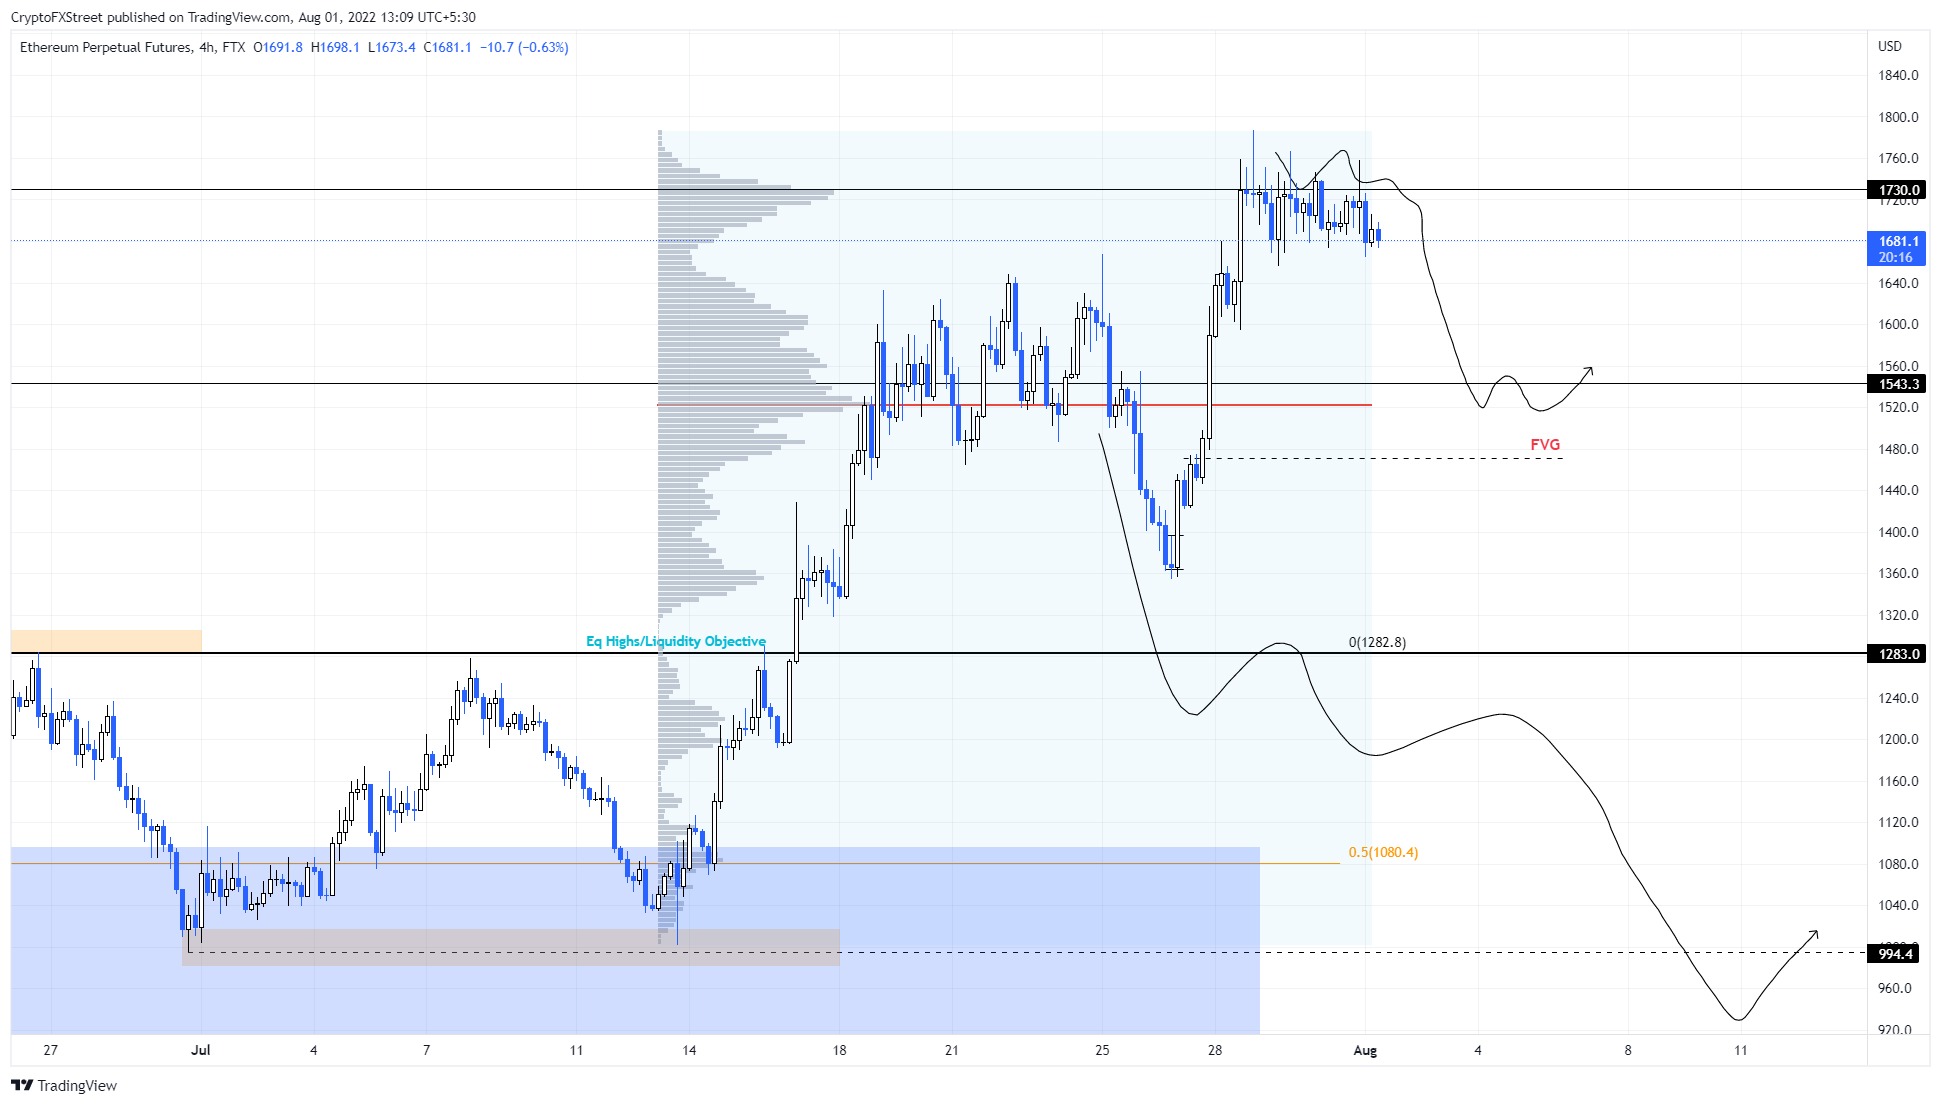
Ethereum price bulls clearly showed exhaustion as they retested the $1,730 hurdle for more than three days. Despite multiple attempts, ETH failed to move past this level, indicating a lack of buying pressure and a large stack of selling pressure.
Therefore, the next logical thing for Ethereum price to do is retrace. A 9.7% drop seems likely for ETH to retest the $1,543 support level. Interestingly, this level coincides roughly with the point of control, aka the highest volume trade.
The volume profile is drawn only for the recent run-up extending from July 13 to August 1. This allows investors to know if the uptrend was strong and backed with enough volume.
A breakdown of the $1,543 support floor could send ETH down to $1,350 and below this level, the volume profile thins out considerably, hinting at a steep decline to $1,080.
ETH/USD 4-hour chart
Regardless of the bearish signal, good news for the Merge enthusiasts could trigger a buying frenzy. If Ethereum price produces a daily candlestick close above $1,730, it will invalidate the bearish thesis and trigger a potential move to $2,000.
Ripple price at a make-or-break point
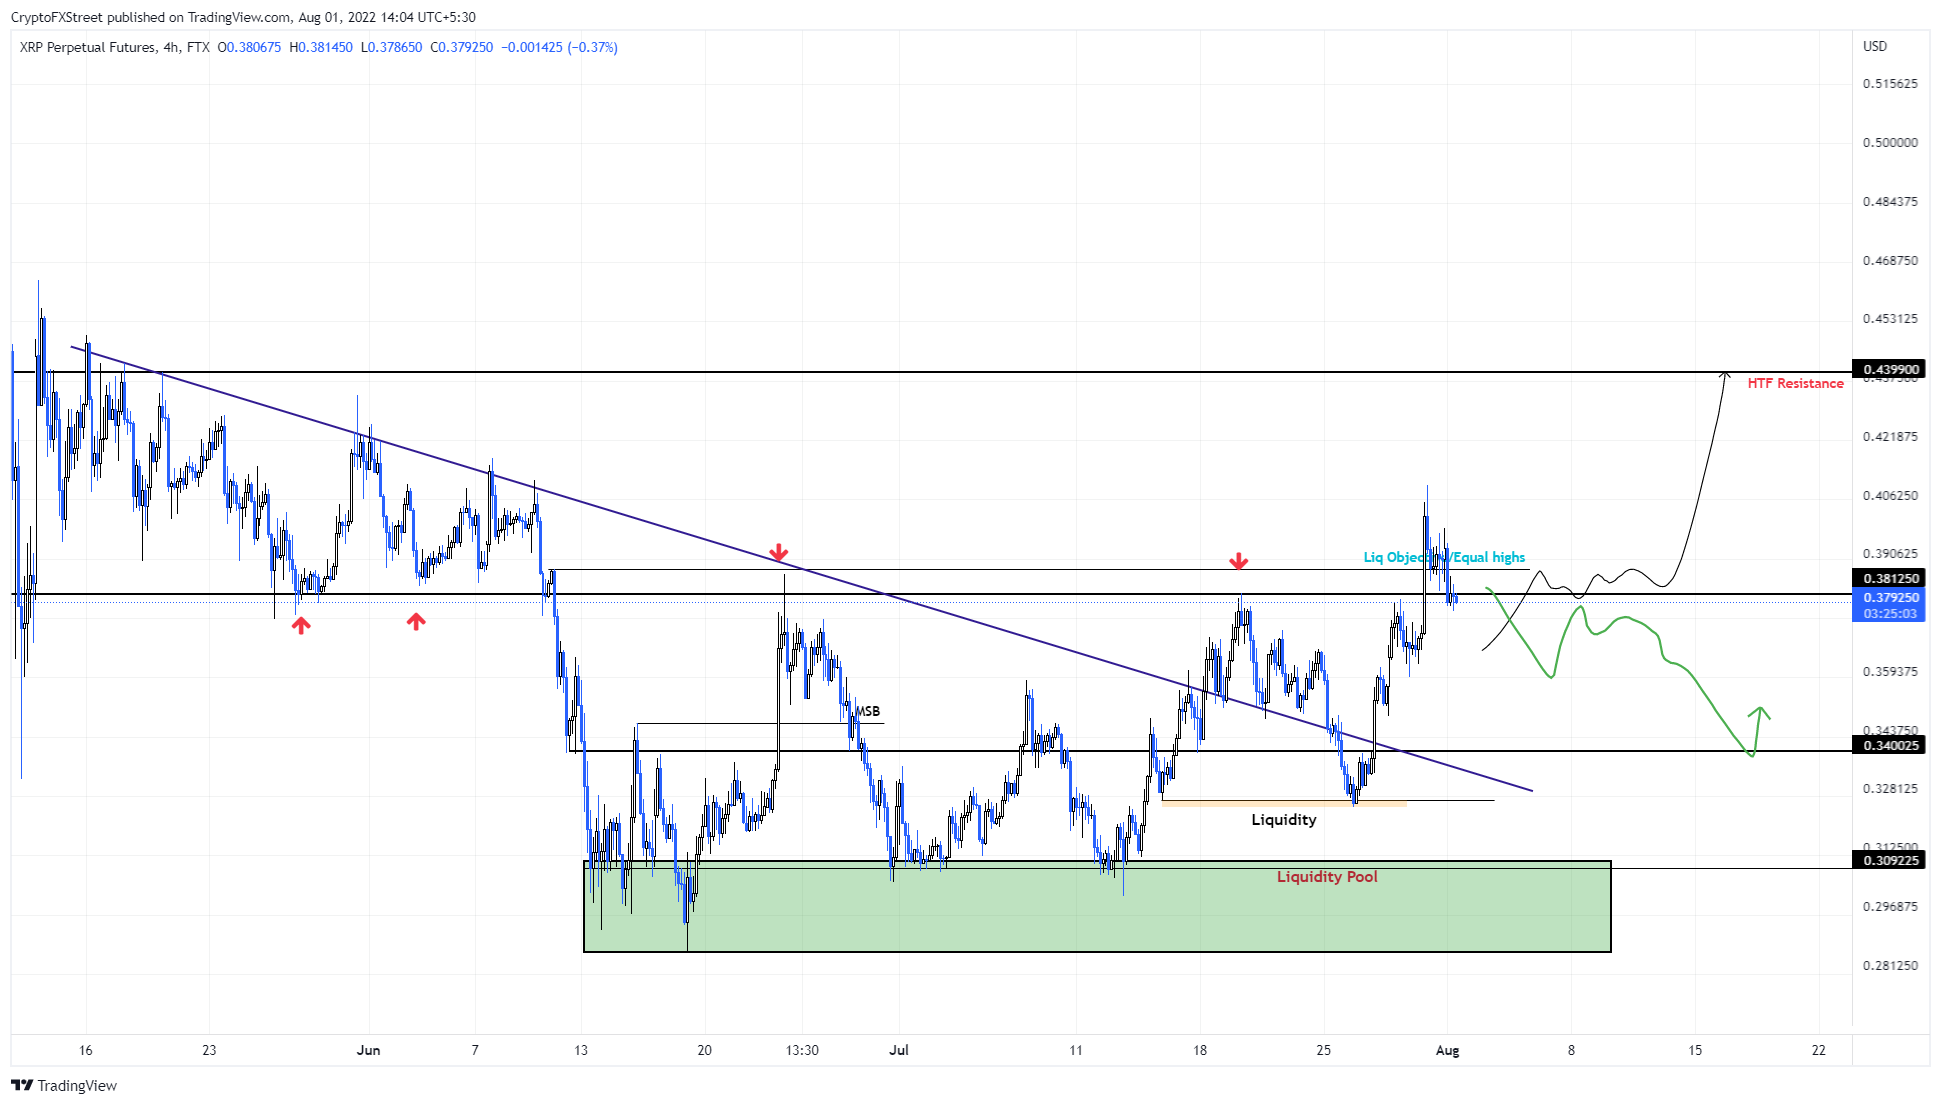
Ripple price rallied 13% on July 30 and collected the liquidity resting above the equal highs at $0.387. This upswing was impressive but lacked any momentum, and as a result, the XRP price is on its way to undoing these gains.
Additionally, the latest four-hour candlestick has closed below the $0.381 support level, suggesting that a further downtrend is likely to ensue. In such a case, investors can expect Ripple price to revisit the $0.340 support level.
XRP/USD 4-hour chart
On the other hand, if Ripple's price stays above the $0.381 barrier, it confirms its position as a support level and will also invalidate the bearish thesis. In such a case, the XRP price could open the path to revisit the $0.439 resistance level.
Author

Akash Girimath
FXStreet
Akash Girimath is a Mechanical Engineer interested in the chaos of the financial markets. Trying to make sense of this convoluted yet fascinating space, he switched his engineering job to become a crypto reporter and analyst.


