Top 3 Price Prediction Bitcoin, Ethereum, Ripple: Crypto markets prepare for a bullish October
- Bitcoin price shows signs of bullish breakout as it traverses a falling wedge.
- Ethereum price also displays an optimistic outlook as it forms a descending parallel channel.
- Ripple price is consolidating in hopes of forming a higher low and kick-starting an uptrend.

Bitcoin price is experiencing a momentary downswing as it sets up a falling wedge pattern. Similar to the big crypto, Ethereum price is also forming a bullish pattern. However, Ripple seems to be bouncing off a support floor without any technical formations in play.
Bitcoin price awaits breakout
Bitcoin price has been on a downward trend since September 7, but the asset is getting congested as it slopes lower. In total, BTC has set up roughly four lower highs and three lower lows since this point. Connecting these swing points using trend lines shows the formation of a falling wedge pattern.
This technical formation forecasts a 12% upswing to $51,925, obtained by measuring the distance between the first swing high and swing low and adding it to the breakout point.
Investors can assume BTC to bounce off the 50% Fibonacci retracement level at $41,126 and slice through the upper trend line at $44,192. This move would set up a higher low relative to the July 21 swing low, while the Relative Strength Index (RSI) creates a lower low on these dates. Such a development indicates the formation of a hidden bullish divergence, adding a tailwind to the bullish scenario from a falling wedge perspective.
The breakout from the pattern, while optimistic from a theoretical perspective, would not be the only requirement. The resistance levels at $44,893 and $46,856 will likely hinder the uptrend before arriving at the $49,766 target.
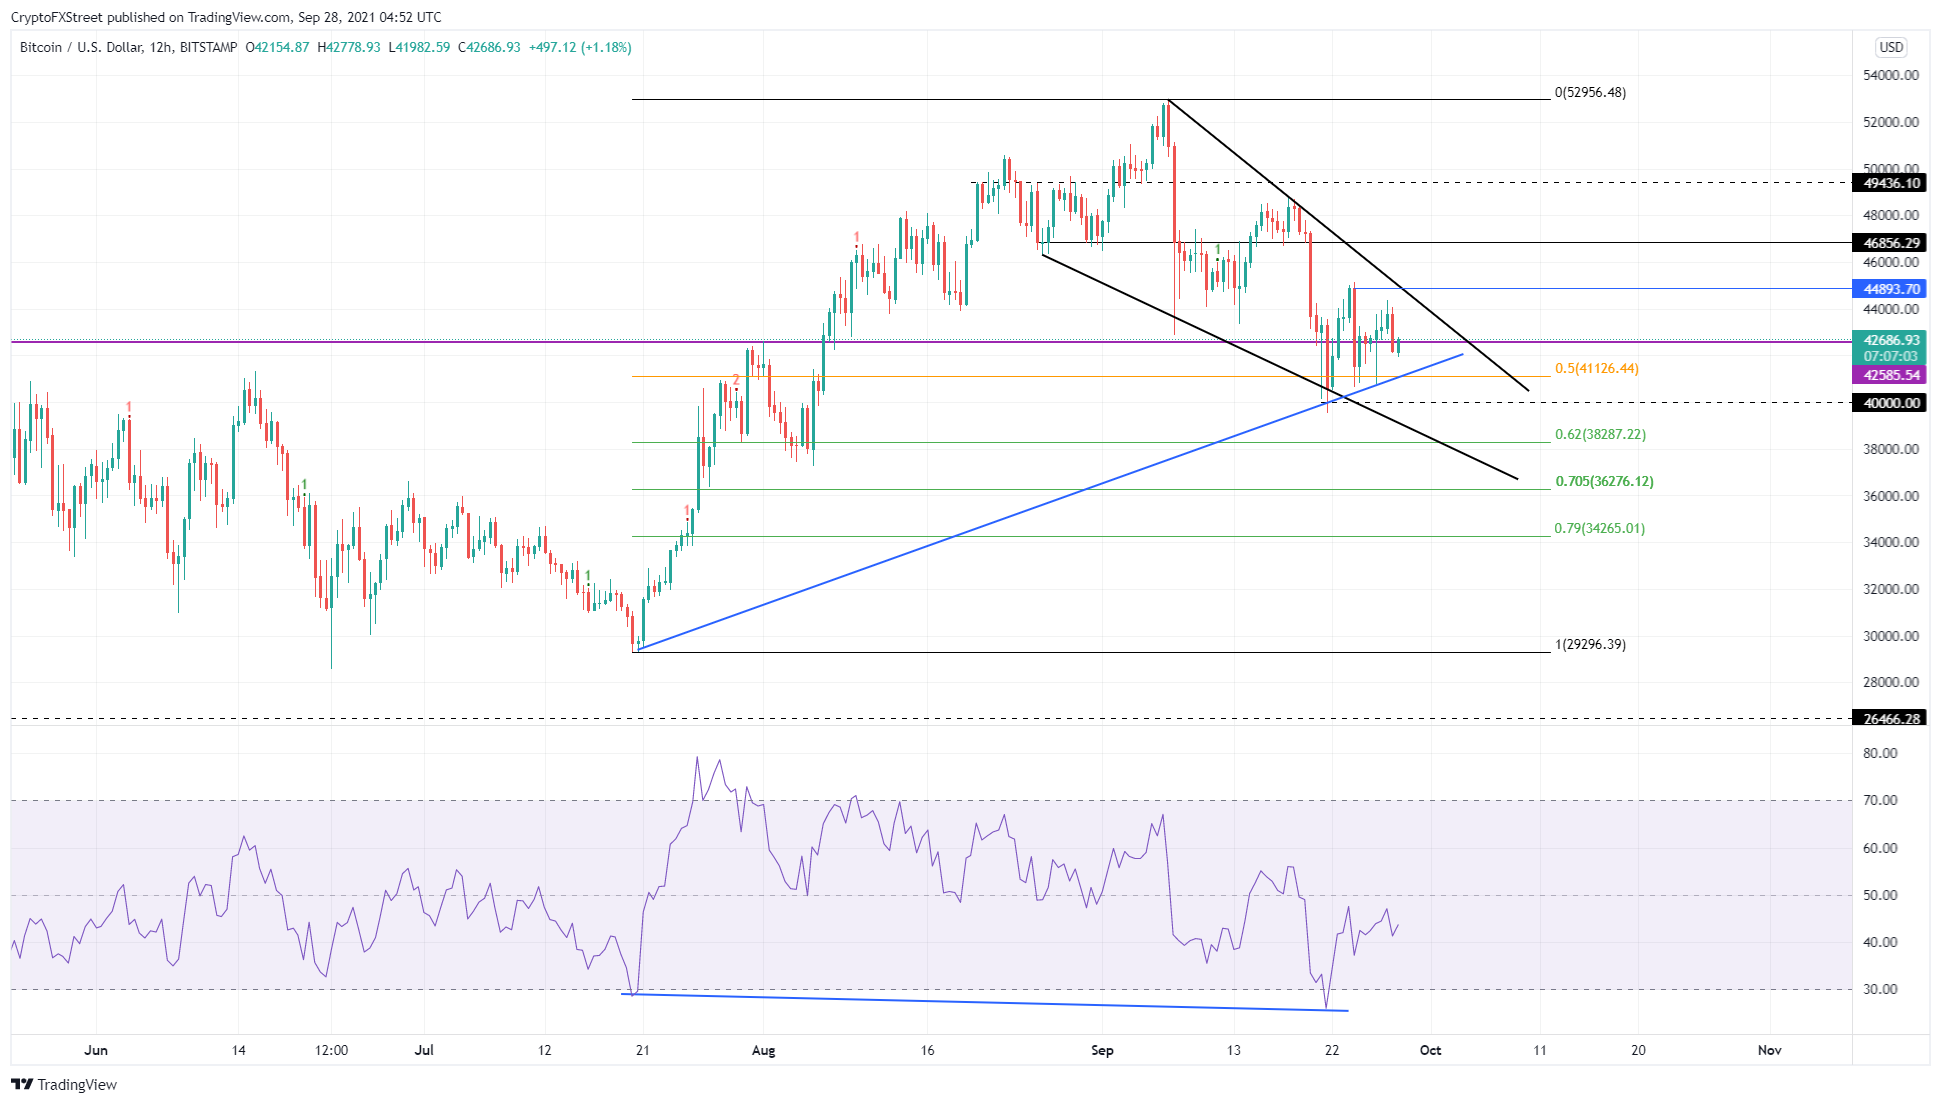
BTC/USDT 12-hour chart
While things seem to be leaning bullish, a failure to recover BTC at $41,126 will indicate that the buyers are not ready.
In such a case, investors can expect BTC to retrace to the high-probability reversal zone, ranging from $38,287 to $34,264, before restarting the rally.
Ethereum price vies a bullish breakout
Ethereum price set up three distinctive lower highs and two lower lows since August 31. Connecting these swing points shows the formation of a descending parallel channel. While ETH bounced off the middle line of the channel, it is currently retesting the upper trend line in hopes of a breakout.
A potential surge in buying pressure that pushes ETH to produce a decisive 12-hour candlestick close above $3,202 will confirm a breakout and the start of a new bull rally. In such a case, ETH could climb to the $3,619 hurdle after a 13% ascent.
If the buying pressure continues to rise, Ethereum price might continue and tag the $3,952 resistance level.
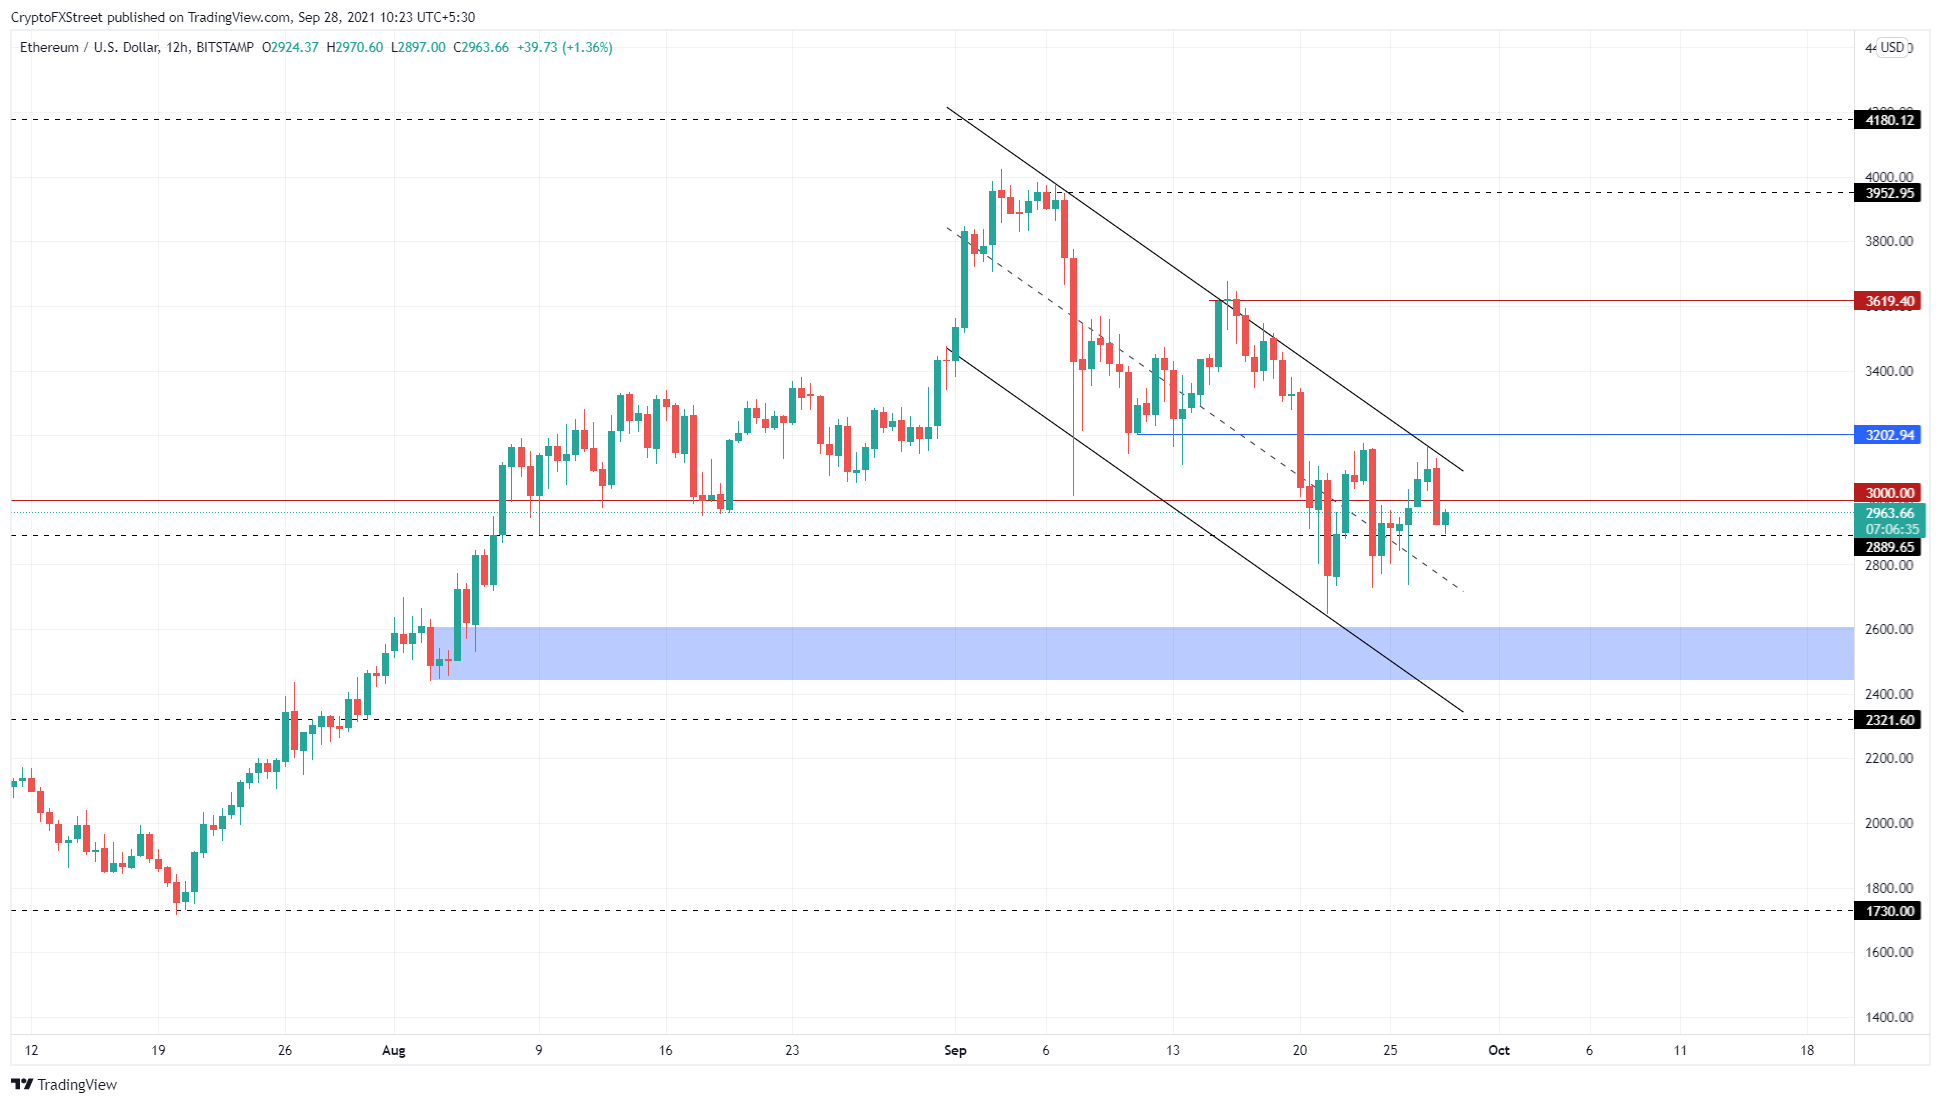
ETH/USD 12-hour chart
On the other hand, if Ethereum price slices through the $2,889 support barrier, it will lead to a 9% sell-off to the demand zone ranging from $2,442 to $2,605. If the downswing bounces off this area, an uptrend could originate. However, if the sellers push ETH to produce a decisive close below $2,442, it will invalidate the bullish thesis.
Ripple price at inflection point
Ripple price is hovering above the $0.924 support floor, hoping to bounce off it. However, the big crypto is showing momentary weakness and could drop XRP price down to $0.816.
Regardless, a decisive daily candlestick close above $1.052 will clear a massive hurdle and flip into a platform that could launch an uptrend. Despite this upswing, the XRP price needs to clear two more blockades, at $1.192 and $1.326, to set up a higher high.
This move could potentially trigger an influx of sidelined buyers, starting a buying spree and pushing the remittance token to $1.67. The ascent from the current price to $1.672 would represent an 81% climb.
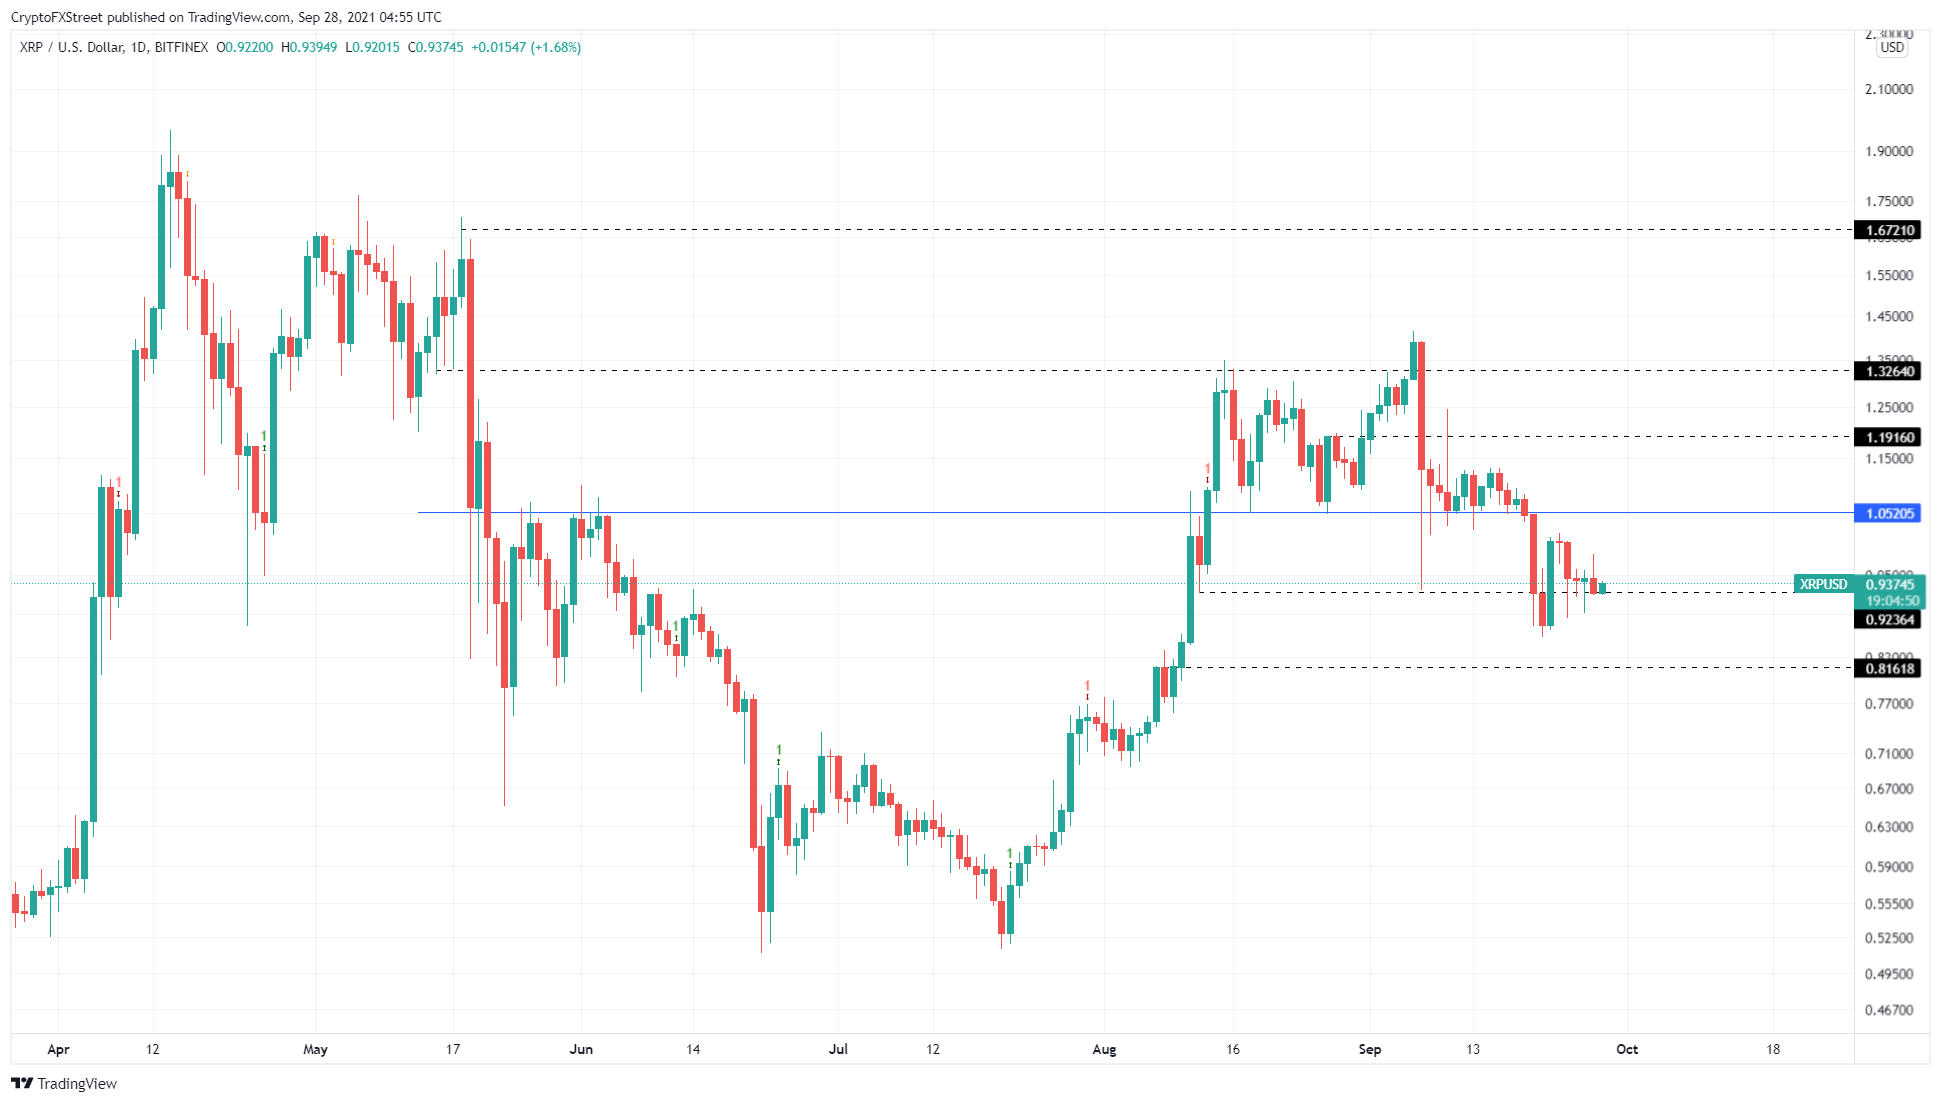
XRP/USD 1-day chart
On the contrary, if the Ripple price fails to hold above $0.924, it will knock the altcoin down to $0.816. A convincing close below this support floor will invalidate the bullish thesis and might catalyze a move lower.
Author

Akash Girimath
FXStreet
Akash Girimath is a Mechanical Engineer interested in the chaos of the financial markets. Trying to make sense of this convoluted yet fascinating space, he switched his engineering job to become a crypto reporter and analyst.


