Top 3 Price Prediction Bitcoin, Ethereum, Ripple: Crypto market ready to shake off weak hands
- Technical scenarios foresee an acceleration of the consolidation process.
- Ethereum can provide the best discounts and opportunities.
- Market sentiment falls below level 80 for the first time in several weeks.

A new session starts in Europe, and the cryptocurrencies segment changes direction again. The current consolidation scenario needs increased volatility to do its job – which is to shake off weak hands and create a new base strong enough to support the next upside.
Market weakness is starting to take its toll on crypto traders' moods, and the market sentiment levels are worsening – coming out of the zone of extreme greed for the first time in several weeks.

Tuesday’s sentiment indicator published by alternative.me has dropped to the 75 level and opens the door to test 60 in the next sessions.
ETH/BTC Daily Chart
ETH/BTC is currently trading at the price level of 0.0341.
Above the current price, the first resistance level is at 0.0351, then the second at 0.0368 and the third one at 0.0372.
Below the current price, the first support level is at 0.0333, then the second at 0.0316 and the third one at 0.0302.
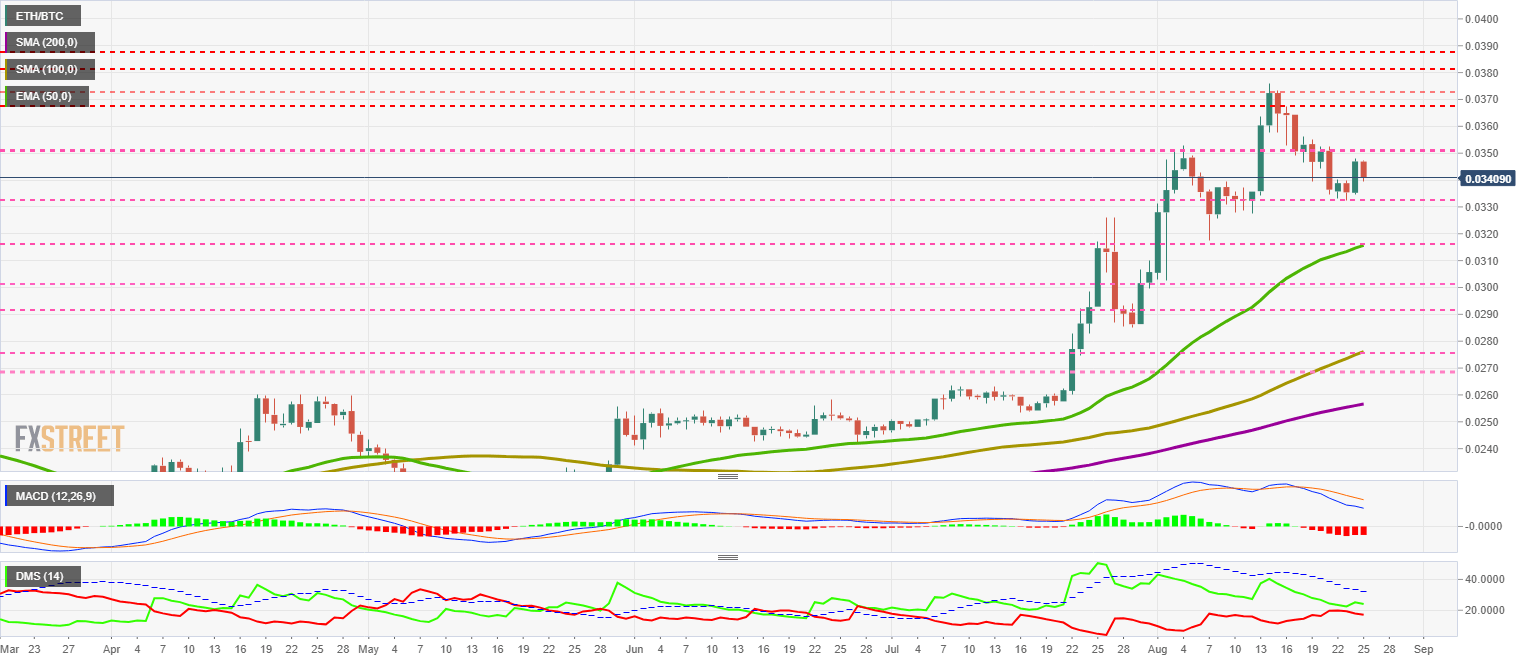
The MACD on the daily chart is showing an increasing line gap and also a decreasing trend line. The most likely development is a bearish acceleration in the next sessions.
The DMI on the daily chart shows bulls losing strength as bears also present a decrease in the momentum, but with less intensity than the buy-side.
BTC/USD Daily Chart
BTC/USD is currently trading at $11,577 and appears to be giving up another attempt at the price congestion resistance level at $12,300 for the time being.
Above the current price, the first resistance level is at $12,300, then the second at $14,000 and the third one at $17,200.
Below the current price, the first support level is at $11,275, then the second at $10,950 and the third one at $10,600.
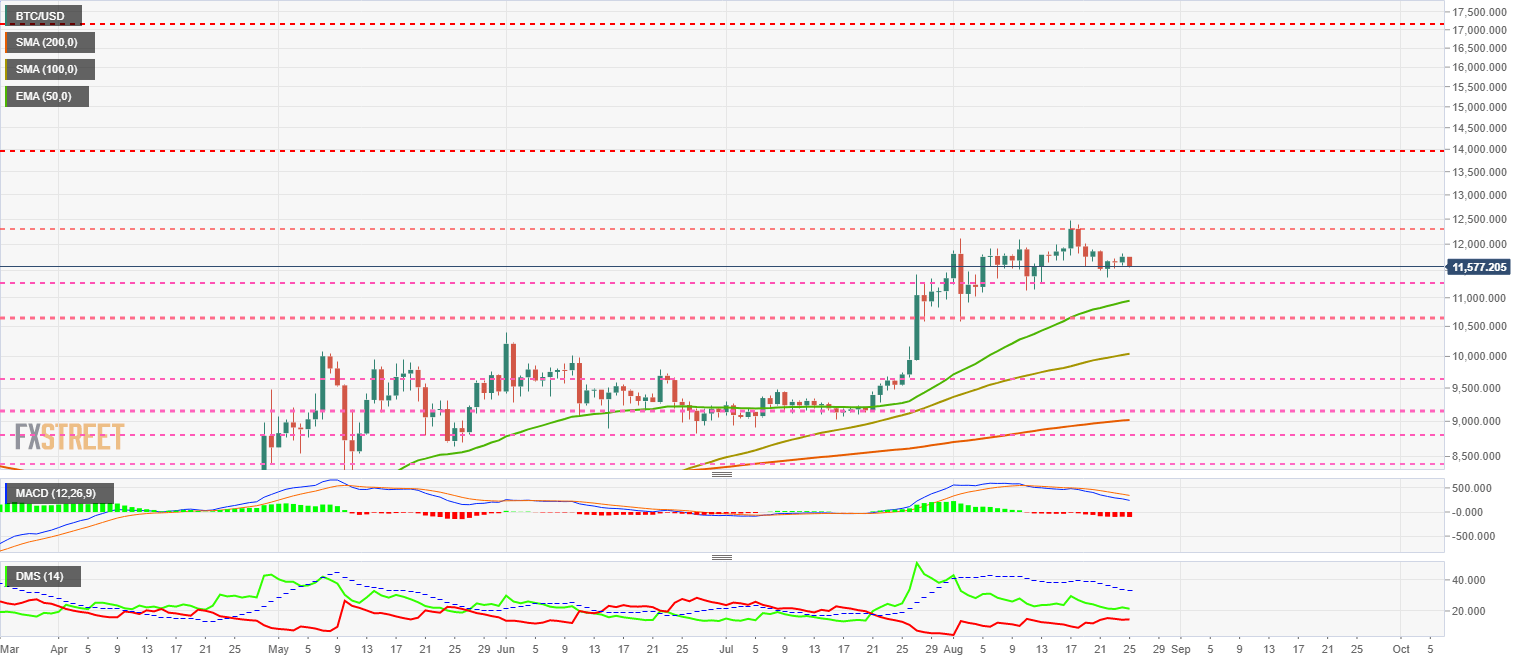
The MACD on the daily chart is showing an increase in the bearish profile of the moving averages that make up this indicator. The typical development pattern reflects a downward acceleration in the next sessions.
The DMI on the daily chart shows both sides of the market on a collision course. This development is consistent with a downward acceleration and an increase in volatility.
ETH/USD Daily Chart
ETH/USD is currently trading at $398.5 and is moving away from the psychological level of $400.
Above the current price, the first resistance level is at $440, then the second at $460 and the third one at $485.
Below the current price, the first support level is at $385, then the second at $355 and the third one at $315.
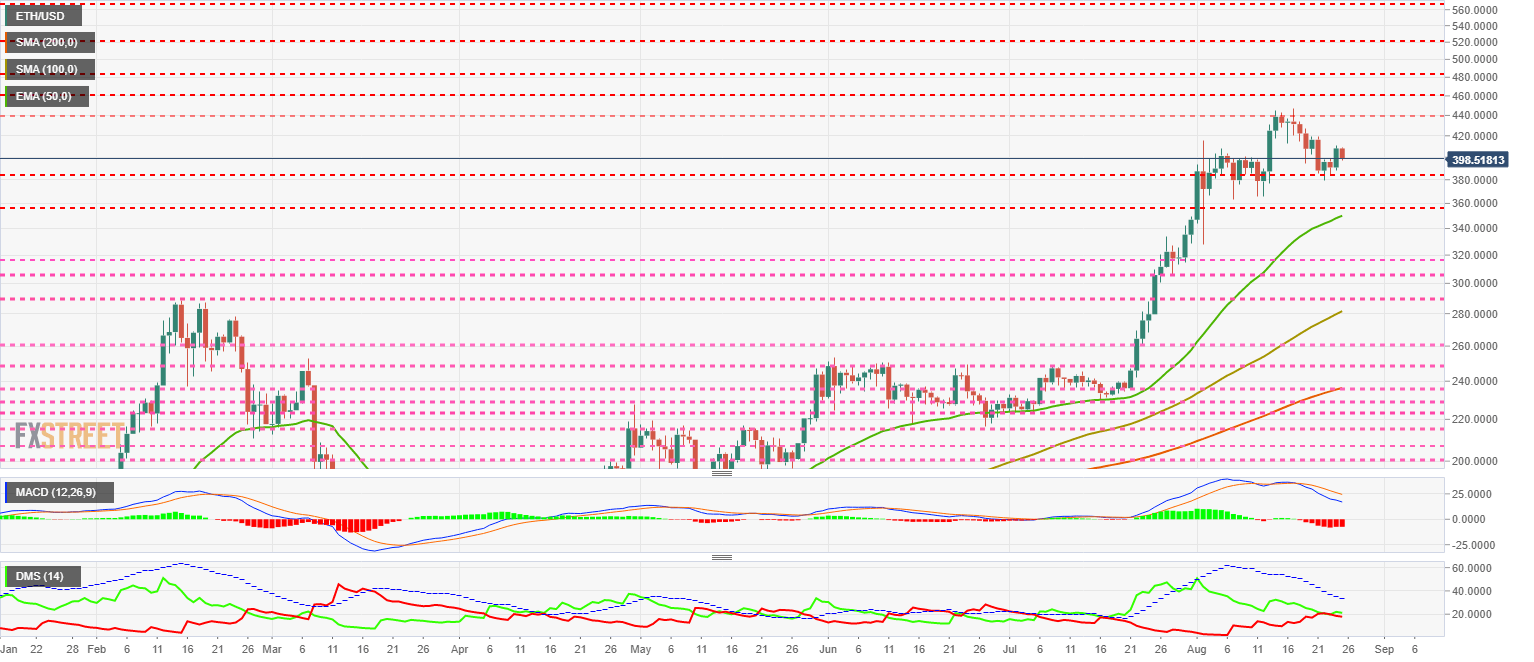
The MACD on the daily chart shows an increasing gap between the moving averages. The downward slope of the averages is also increasing, heralding an increase in downward pressure in the coming sessions.
The DMI on the daily chart is showing how the bulls rejected the first attempt at a bear crossing. The distance between the two sides of the market is minimal, and sellers will likely try and take the lead.
XRP/USD Daily Chart
XRP/USD is currently trading at $0.283 and is rapidly moving towards the price congestion support level of $0.28.
Above the current price, the first resistance level is at $0.29, then the second at $0.30 and the third one at $0.32.
Below the current price, the first level of support is at $0.27, then the second at $0.254 and the third one at $0.238.
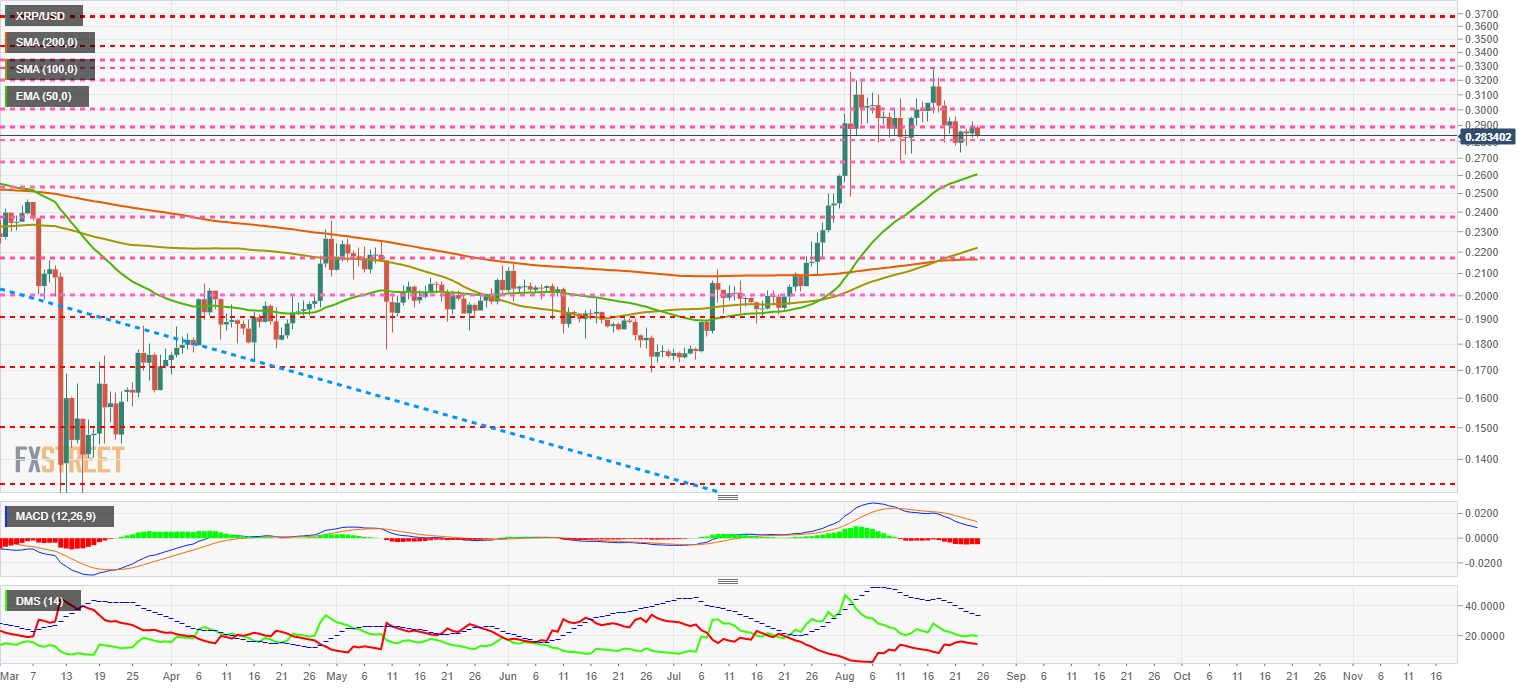
The MACD on the daily chart is showing an increase in the bearish profile, both due to the separation between the moving averages and the increase in the downward slope.
The DMI on the daily chart represents both sides of the market moving at very close levels. A meeting between the bears and the bulls is inevitable, which will add to the volatility of the XRP/USD.
Author

Tomas Salles
FXStreet
Tomàs Sallés was born in Barcelona in 1972, he is a certified technical analyst after having completing specialized courses in Spain and Switzerland. He expanded his technical training following the guidance of great experts on the financial markets.


