Top 3 Price Prediction Bitcoin, Ethereum, Ripple: Cryptos are primed for a significant rebound
- Bitcoin price looks like it is starting a small uptrend and swing trade back to $21,969.
- Ethereum's price nears a price cap with the potentially to hit $1,300.
- XRP price still has a long way to go but holds the most potential.

Bitcoin price, Ethereum and other cryptocurrencies are slowly but surely recovering from the uppercut cryptocurrencies received these past few weeks and months. The pain trade is not over yet, as shown by the Fund Manager Survey from Bank of America which revealed that hedge funds held a fire sale of all risk assets, which is the cause of the bear market that is currently overshadowing global markets. As liquidity wears thin, bulls need less cash to ramp up price action and provide a little air to lift the much-battered cryptocurrencies.
Bitcoin price is on the cusp of booking 20% gains
Bitcoin (BTC) price is starting to return to the land of the living after its hibernation during the cryptocurrency winter. Although the pain trade is not over, and investors should not jump on everything that moves to the upside, some unwinding of the bearish elastic band is underway. This means that there is a window of opportunity for Bitcoin price to move higher and make some gains, and at the same time pull the Relative Strength Index (RSI) out of oversold, cooling it down, and further encouraging bulls to pull the trigger.
BTC price is set up for a perfect swing trade, with a bounce off the $19,036 handle then rallying to an upside target near $21,969. That means a solid 15% profitable trade as long as the uptrend is respected and higher lows can be generated. Once a trading day breaks the pattern, however, a reversal and return to the base at $19,036 is the most likely outcome.
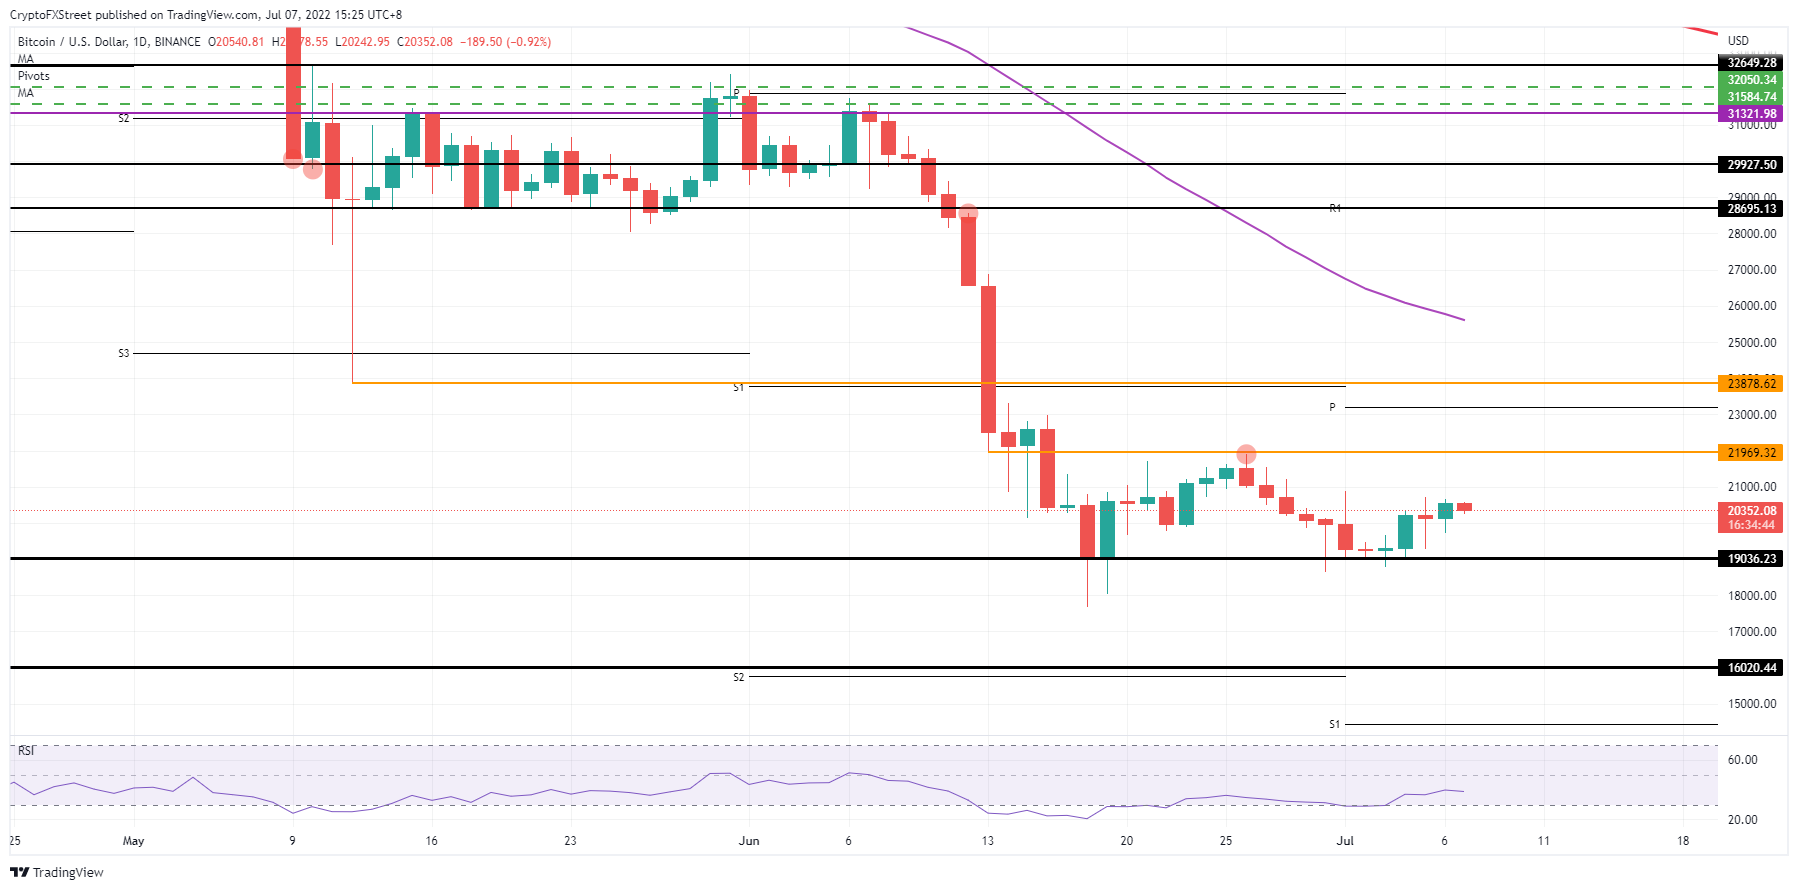
BTC/USD daily chart
Risk to the downside comes with the lack of big investors and capital to push price-action back deeper into the +$20,000's. Bears could see the opportunity to build a massive short position again as BTC price moves up, leading to a full collapse back to $19,036. Bulls will get stopped out and might see another fold as price action drops back towards $16,020.
Ethereum price nears a bullish test
Ethereum (ETH) price looks to be evolving the same swing trade that is forming in Bitcoin and XRP price action but at a slightly more developed stage. For Ethereum price action, the cap is already coming in quite close and could be tested any day now. Depending on the current backdrop and absence of new head winds, $1243.89 could get tested and possibly broken to the upside.
ETH price could thus be in the process of delivering a bullish breakout with bulls trying to perform a daily close above $1,243.89. Should they pull that off, the monthly pivot at $1,300 will be up for grabs and could then be used as a launching platform to go for a steep rally towards $1,500, and the 55-day Simple Moving Average (SMA) acting as a price cap. That would mean a solid 10% gain up to the monthly pivot, and a 30% return up to $1,500.00.
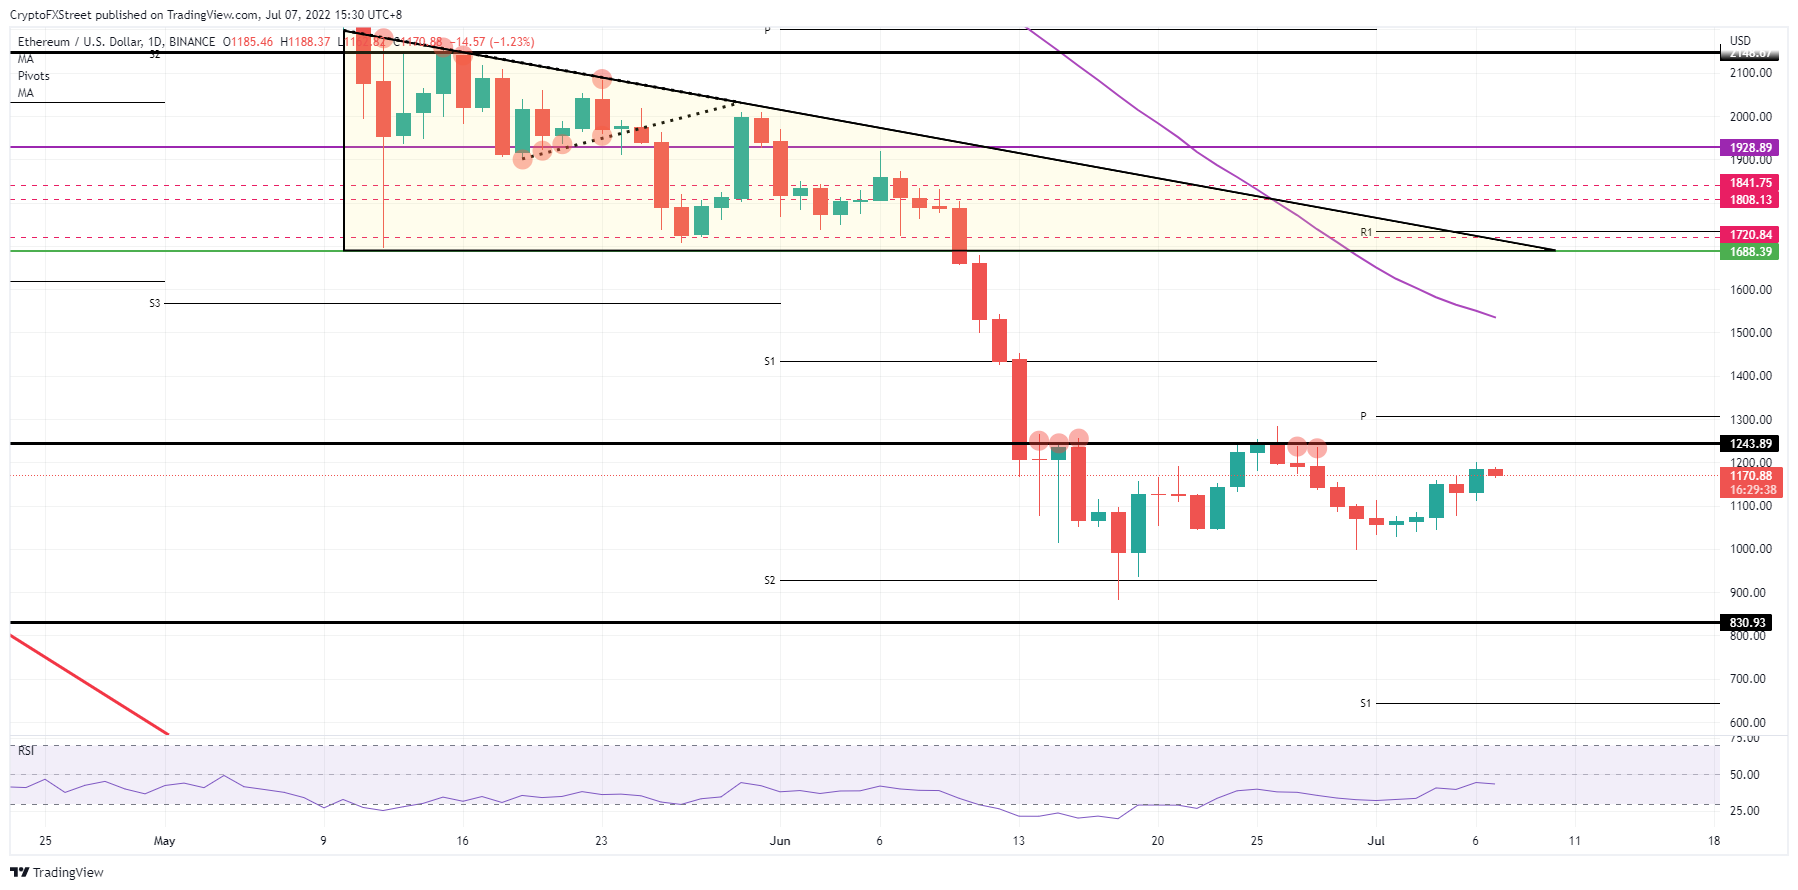
ETH/USD daily chart
A simple risk to be aware of is a rejection against the top side of the range where Ethereum price action is currently residing. Such a scenario would see bulls unable to break above $1,243 or hold above it for a daily close, and for a fade to get underway. That fade could turn into a deeper decline back to $1,000 and possibly even below it towards $830.
Expect this not to be the start of an uptrend yet for XRP
Ripple (XRP) price is showing a similar pattern as its siblings Bitcoin and Ethereum, with price trading in a defined bandwidth and – for XRP price specifically – the current market price residing in the middle of that range. As such, getting involved now would require a tight stop loss and solid trade management. As long as XRP price does not break below the low of the day, expect to see this squeeze to the upside continue.
XRP price still holds an intrinsic 10% of gains with a projected target at $0.3710, a historic pivotal level that coincides with the 55-day SMA that is starting to flatline because of the bottoming out. This double price cap is likely to limit moves higher. An excellent return is to be had, but only with good trade management so that losses can be kept limited in case markets take a turn for the worse.
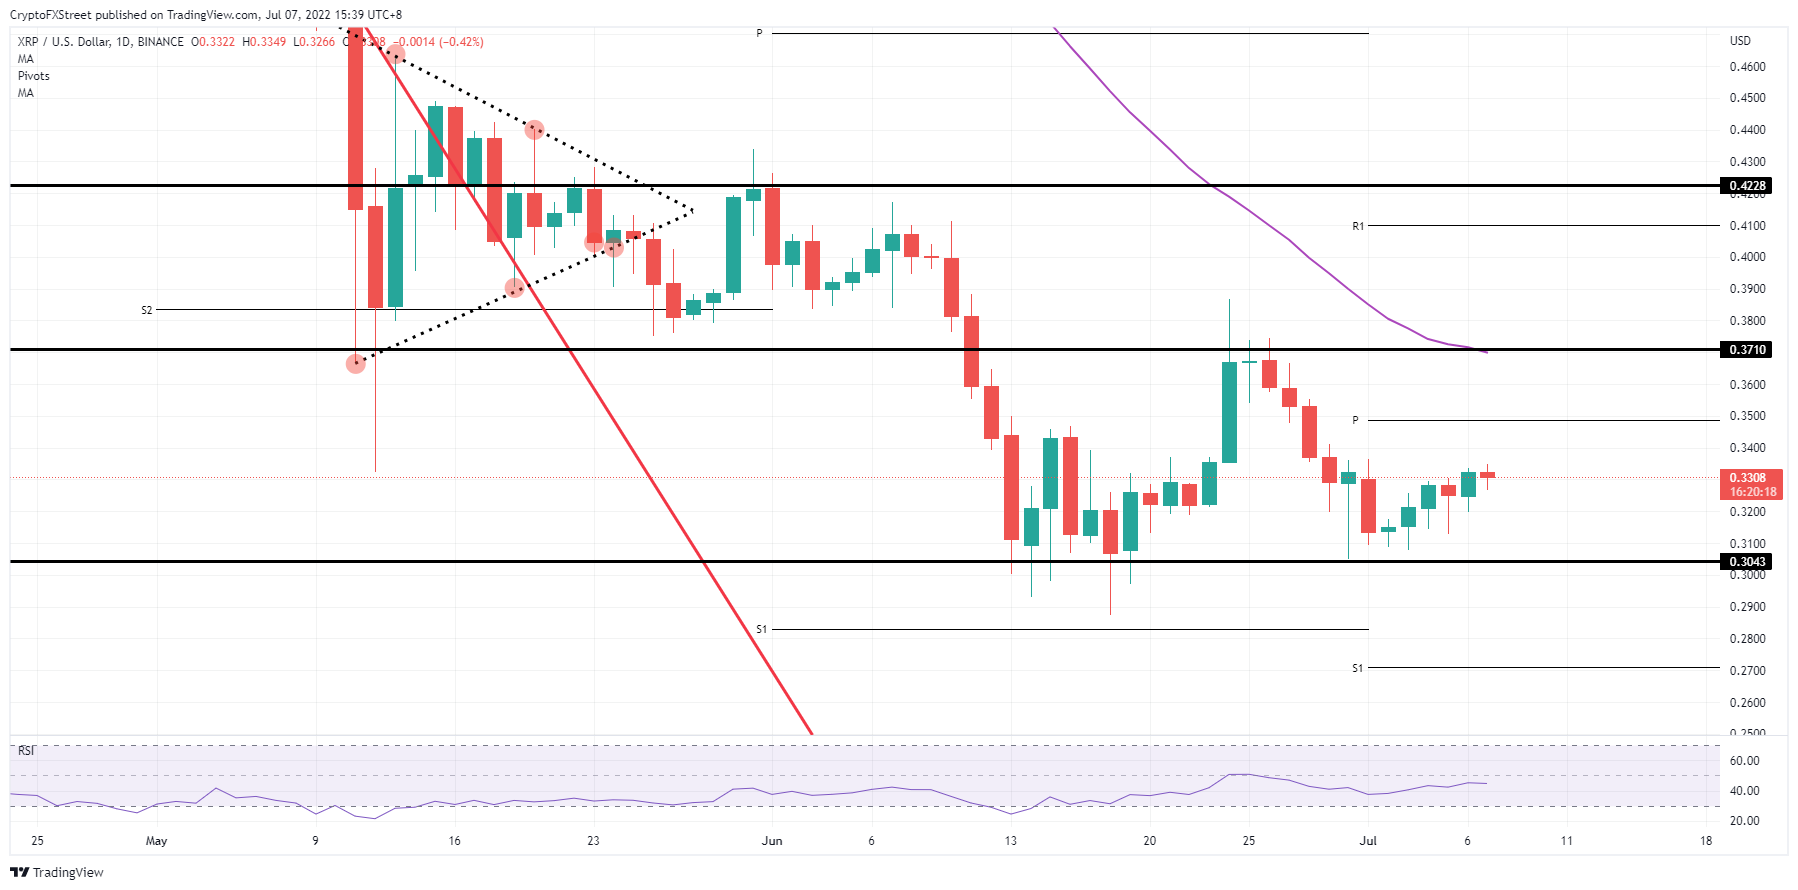
XRP/USD daily chart
As mentioned in the paragraph before, price action is right in the middle of the bandwidth between $0.3710 and $0.3043. The risk is for traders to venture a long position here, and become sitting ducks for an easy squeeze and stop out move by bears. A simple pairing back of gains towards the base level at $0.3043 would mean an 8% loss to be added to the books.
Author

Filip Lagaart
FXStreet
Filip Lagaart is a former sales/trader with over 15 years of financial markets expertise under its belt.


