Monero Price Forecast: XMR builds momentum amid bullish bets and looming resistance
- XMR extends recovery on Wednesday, building on 5% gains from the previous day.
- A steady increase in bullish bets and XMR futures Open Interest reflects a risk-on sentiment among Monero traders.
- The technical outlook for Monero remains mixed, with strong resistance at $439 looming.

Monero (XMR) trades close to $430 at press time on Wednesday, after a 5% jump on the previous day. The privacy coin regains retail interest, evidenced by heightened Open Interest and long positions. Still, the technical outlook remains mixed as Monero approaches a key resistance level at $439.
Sentiments around Monero shift bullish
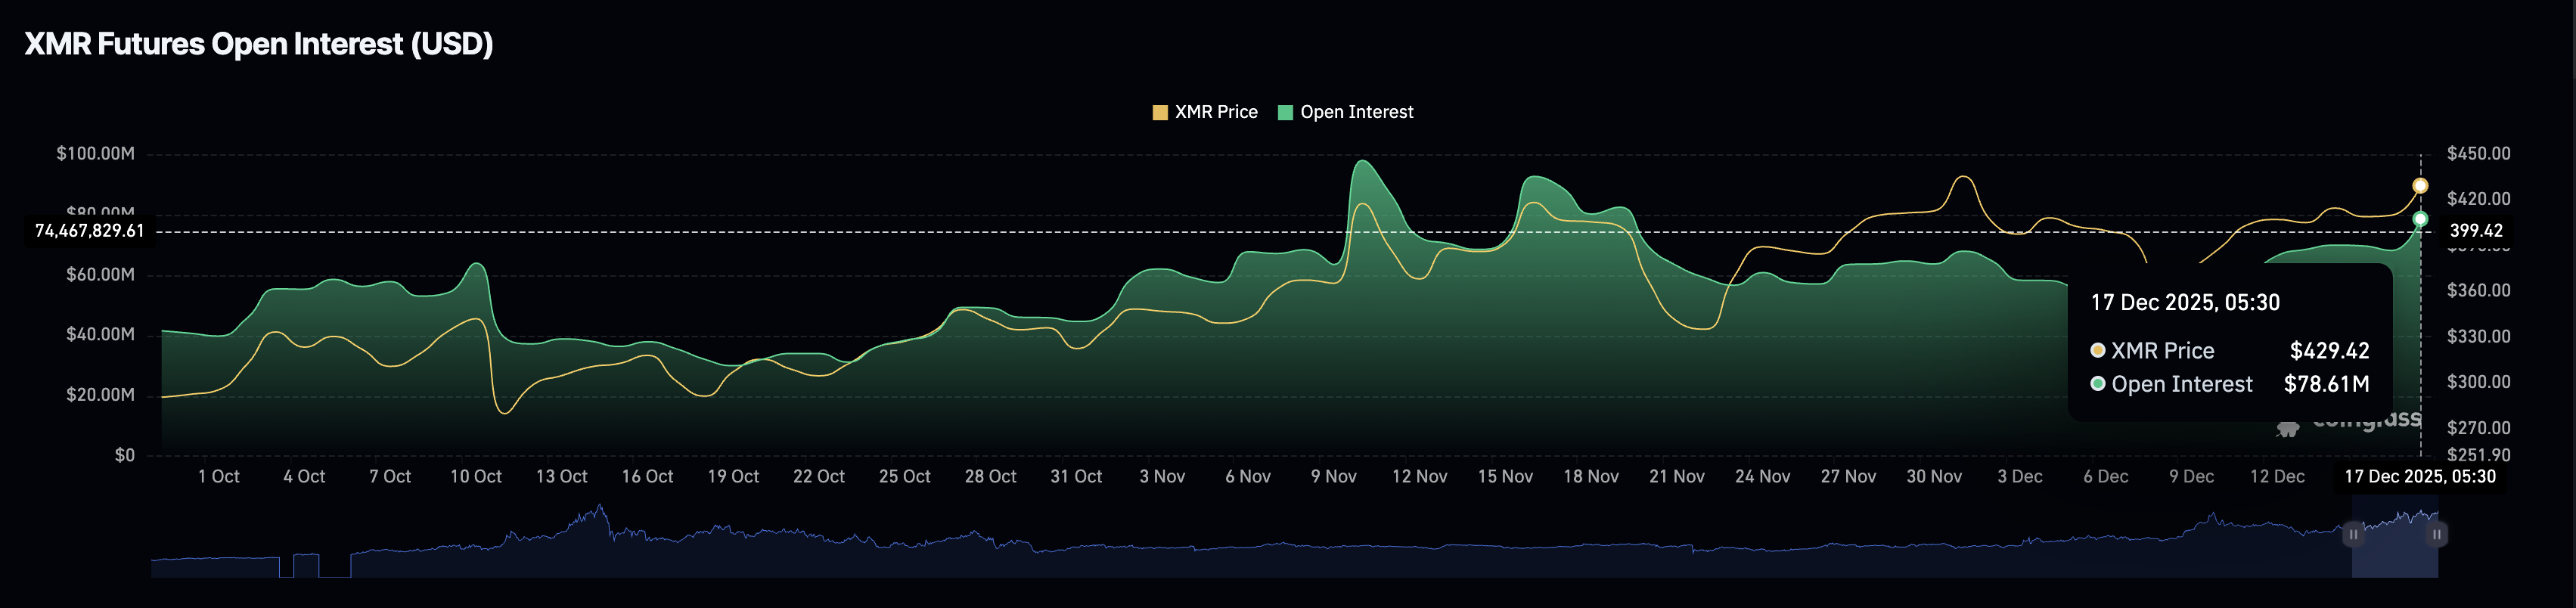
CoinGlass data shows the XMR futures Open Interest (OI) stands at $78.61 million, up from $68.15 million on Tuesday. This rise in OI reflects traders increasing their risk exposure in XMR derivatives, including both long and short positions.
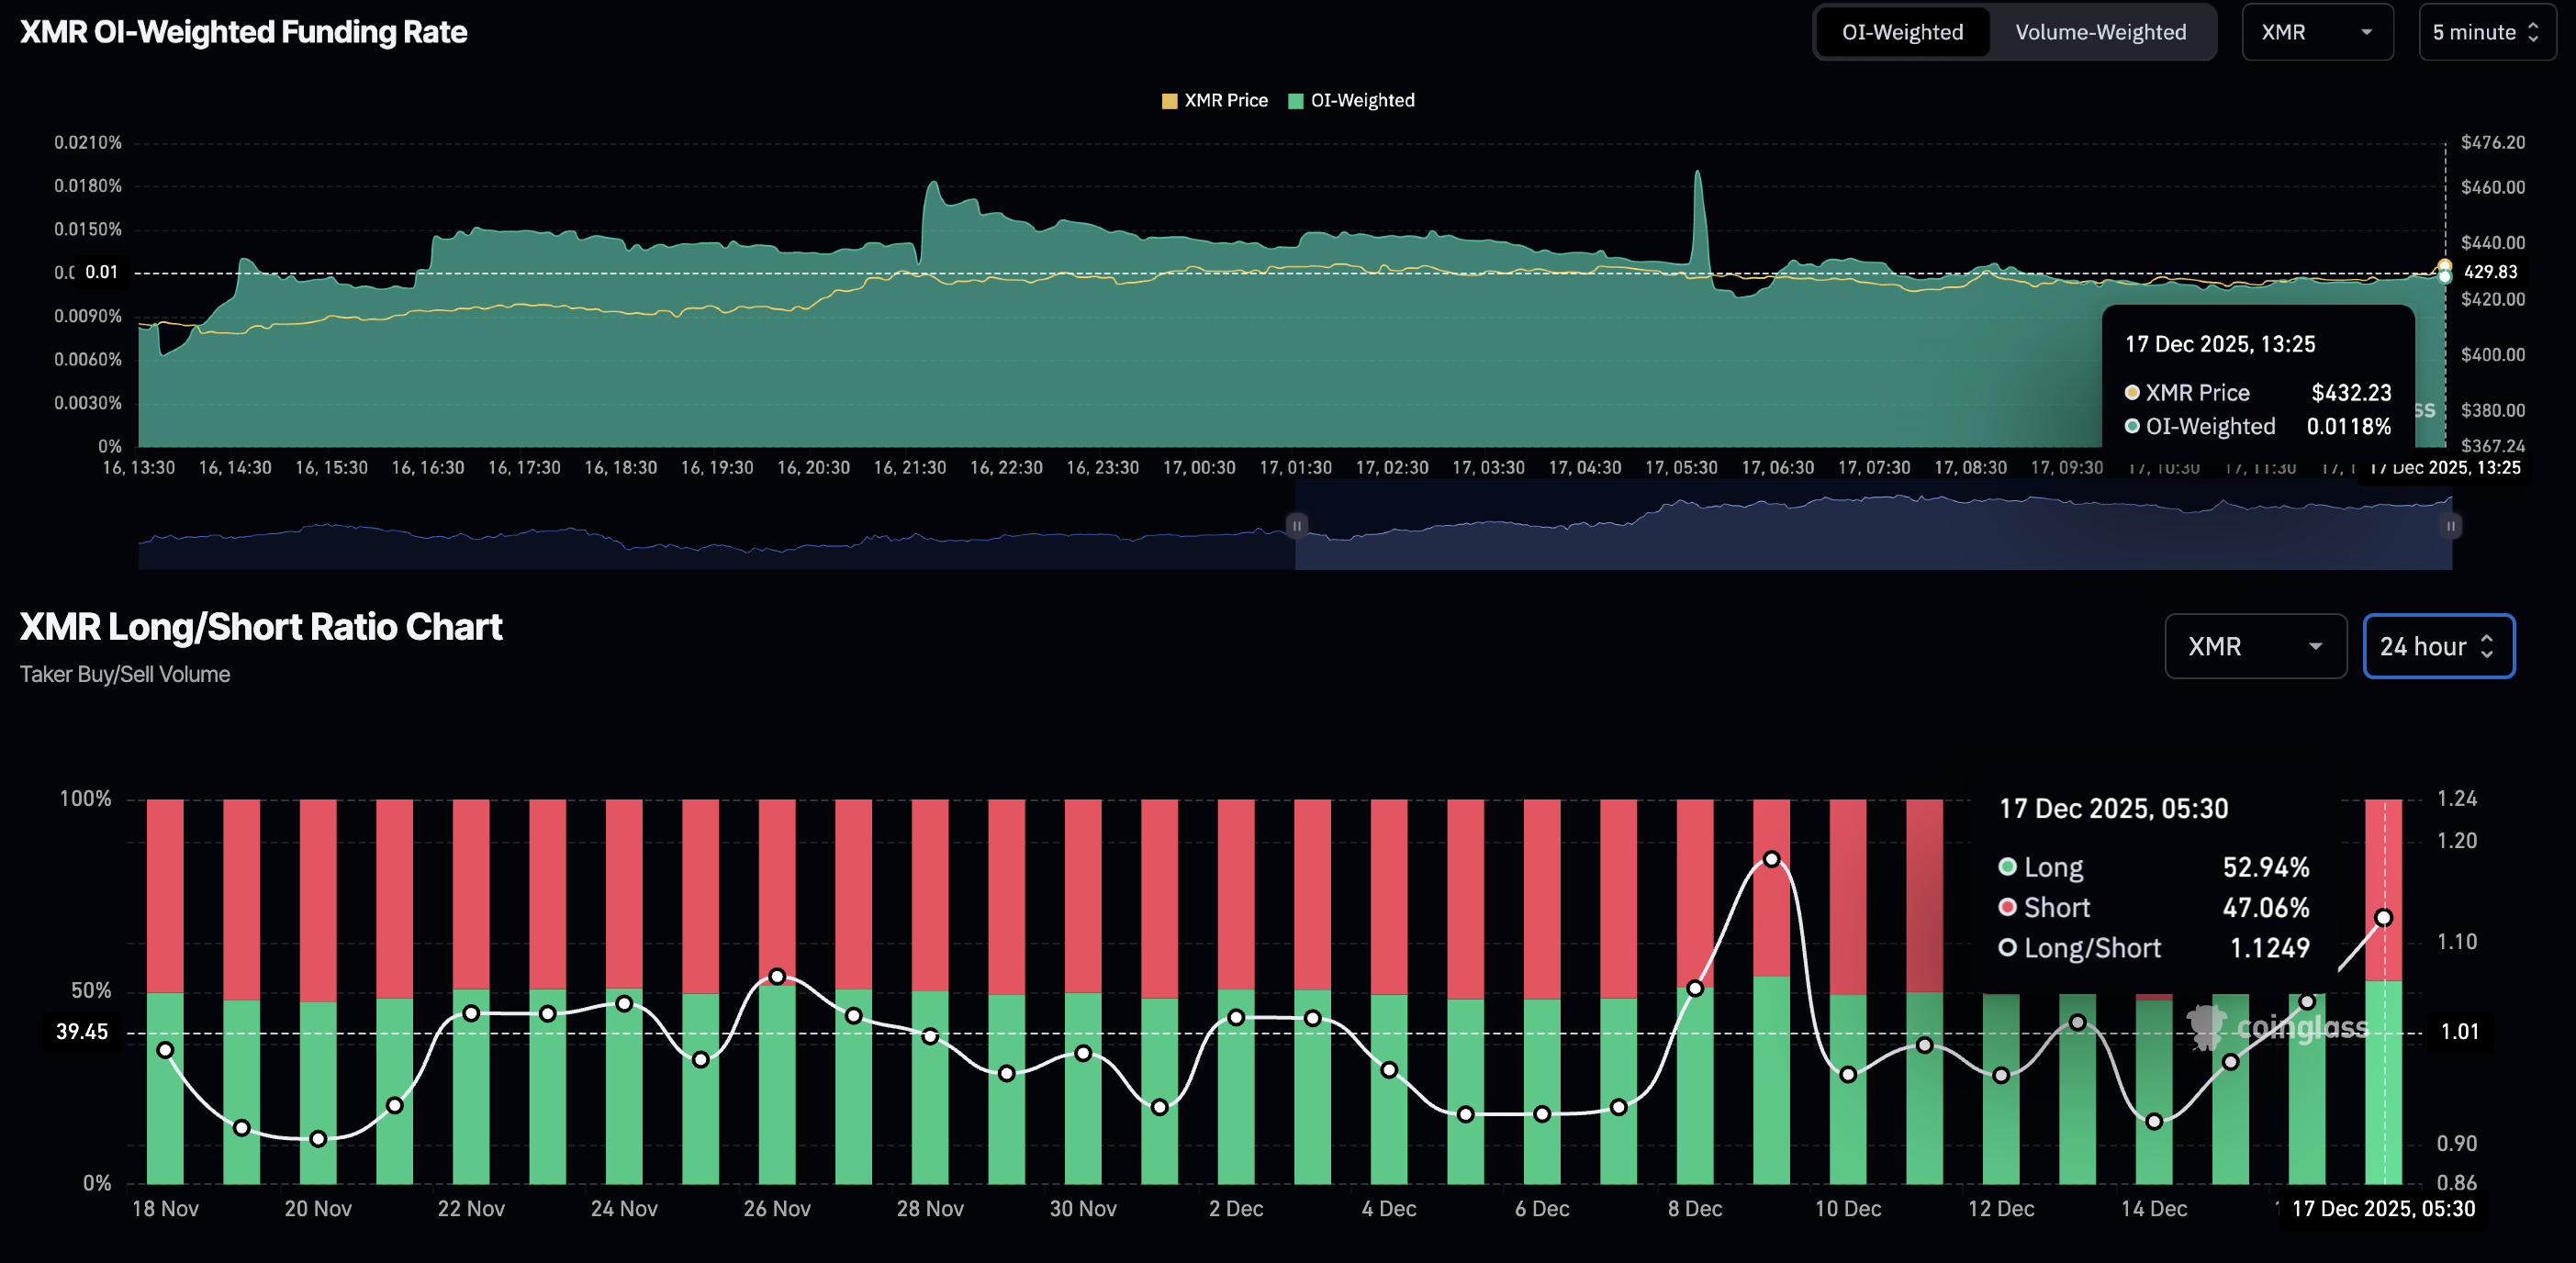
Tilting the scales bullish, the OI-weighted funding rate stands at 0.0118%, indicating a rise in buying pressure as bulls pay a premium to hold long positions. Additionally, the long-to-short ratio chart suggests a steady increase in long positions, rising to 52.94% from 47.99% on Sunday.
Monero builds momentum, improving breakout odds
Monero has been steadily rising since reversing from the $360 low on December 8, approaching $439, a resistance level that has capped XMR's recovery twice since mid-November. If the V-shaped recovery in XMR clears this level, it could extend the rally toward the November 9 high at $471.
The technical indicators on the daily chart suggest that the privacy coin is building momentum, increasing the odds of a breakout rally. The Relative Strength Index (RSI) at 61 is moving higher, with room to go before reaching the overbought zone, suggesting growth potential.
The Moving Average Convergence Divergence (MACD) crossed above the signal line on Tuesday, indicating a bullish shift in trend momentum. A steady rise in MACD and green histogram bars above the zero line would indicate a boost in bullish pressure.
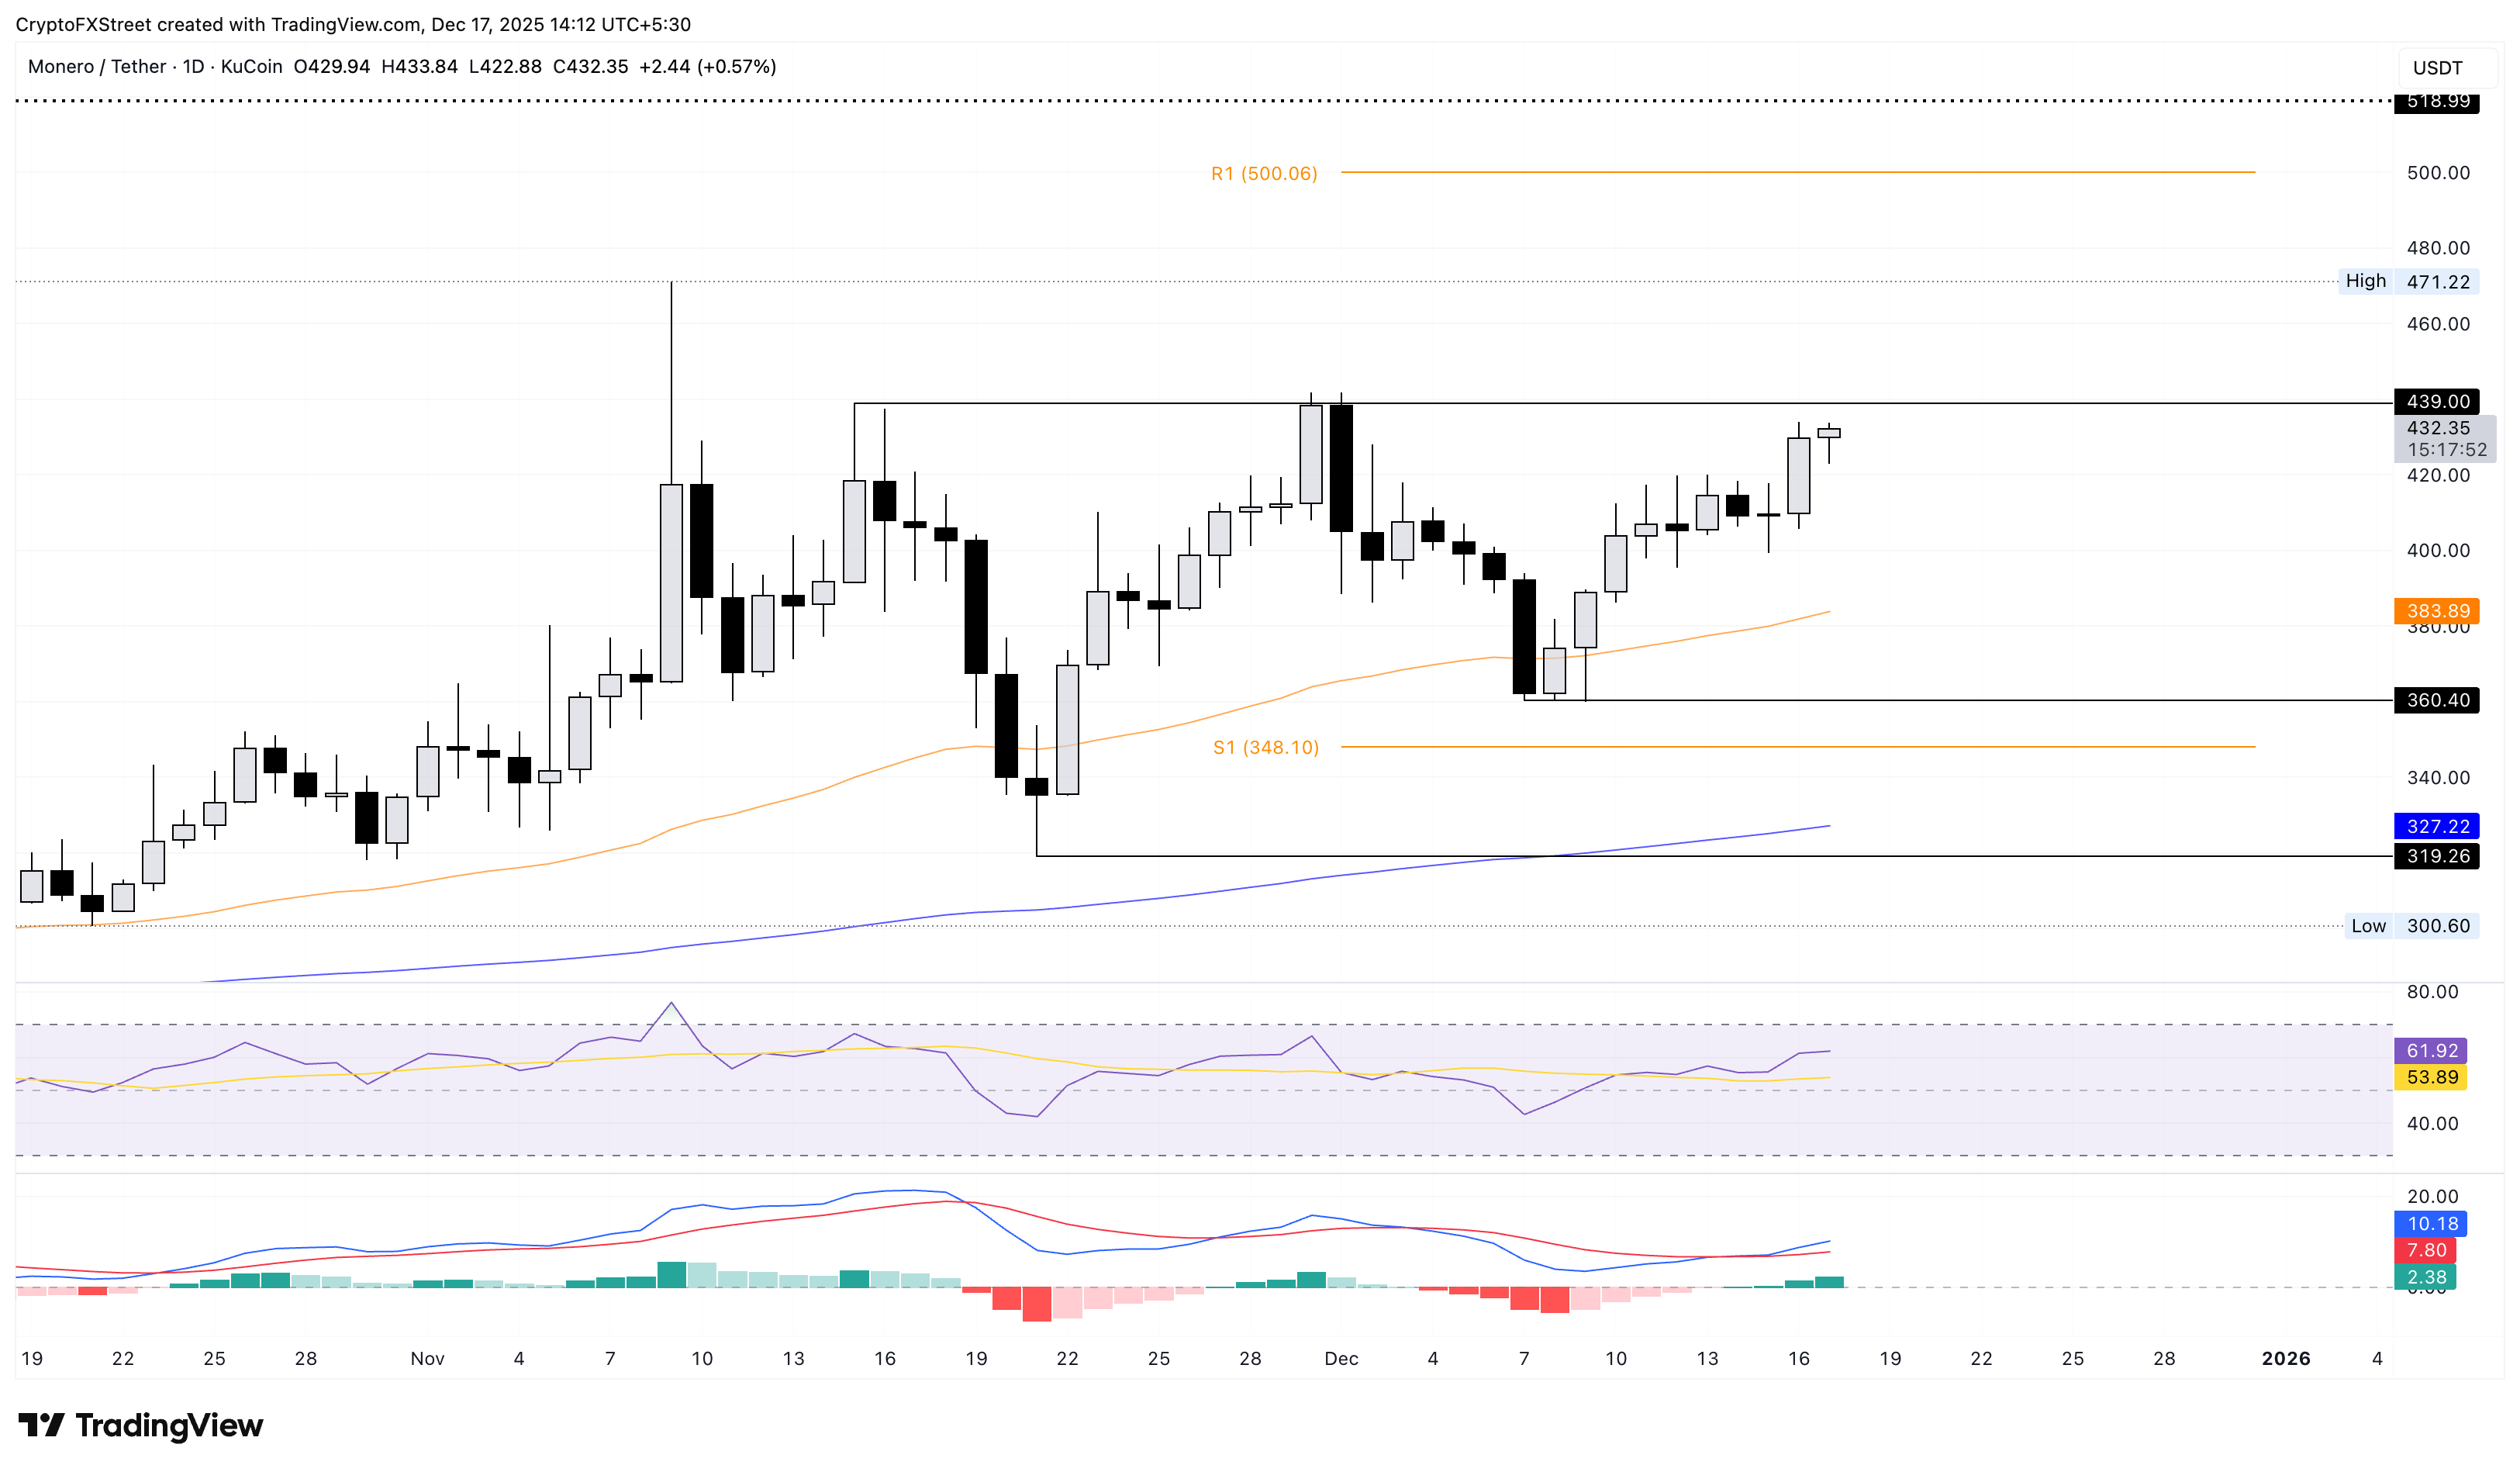
Looking down, if XMR fails to hold above $400, it could test the 50-day Exponential Moving Average at $383.
Author

Vishal Dixit
FXStreet
Vishal Dixit holds a B.Sc. in Chemistry from Wilson College but found his true calling in the world of crypto.




