Why XRP traders should be careful around the current price levels
- Ripple price steady as it goes with price action underpinned for now.
- XRP price sees investors awaiting events unfolding in the bond market on US yields.
- With parity in reach for EUR/USD currency pair, bond market spells danger ahead with ripple effects into XRP price action.

Ripple price (XRP) is seeing investors holding their breath and awaiting where price action might lead them in the coming days. Although most cryptocurrency traders do not look at the bond market and certainly not the US yield curve, it could become obligatory as yields are more important than one would think. For the third time this year, the rate on the US 10-year bond dipped below the US 2-year bond, which is the canary in the coal mine. Once it remains persistent, it will confirm that a recession is happening, with the necessary repercussions for Ripple price action.
XRP price gets the third warning
Ripple price sees price action underpinned above $0.3043 as XRP holds for another day, making it the seventeenth straight day in a row with no new lows. There is still plenty of risk for XRP prices to take a turn for the worse, and traders could be alarmed by a signal coming from the bond market. A look at the US yield curve showed a hint at a near recession for the third time this year. Confirmation of a recession in the US would trigger yet another cash flow exodus out of cryptocurrencies and see their market cap possibly even slashed in half.
XRP price could get a massive blow from this global economic deteriorating situation, potentially dropping back to $0.3043. A break below there would open up quite a chunky area, with only the current S1 and S2 monthly support levels as elements that could try and catch the drop. With not much historical relevance and seeing the possible bearish pressure, the worst case could result in a drop of 42%, which would almost cut the price action from XRP in half to $0.17.
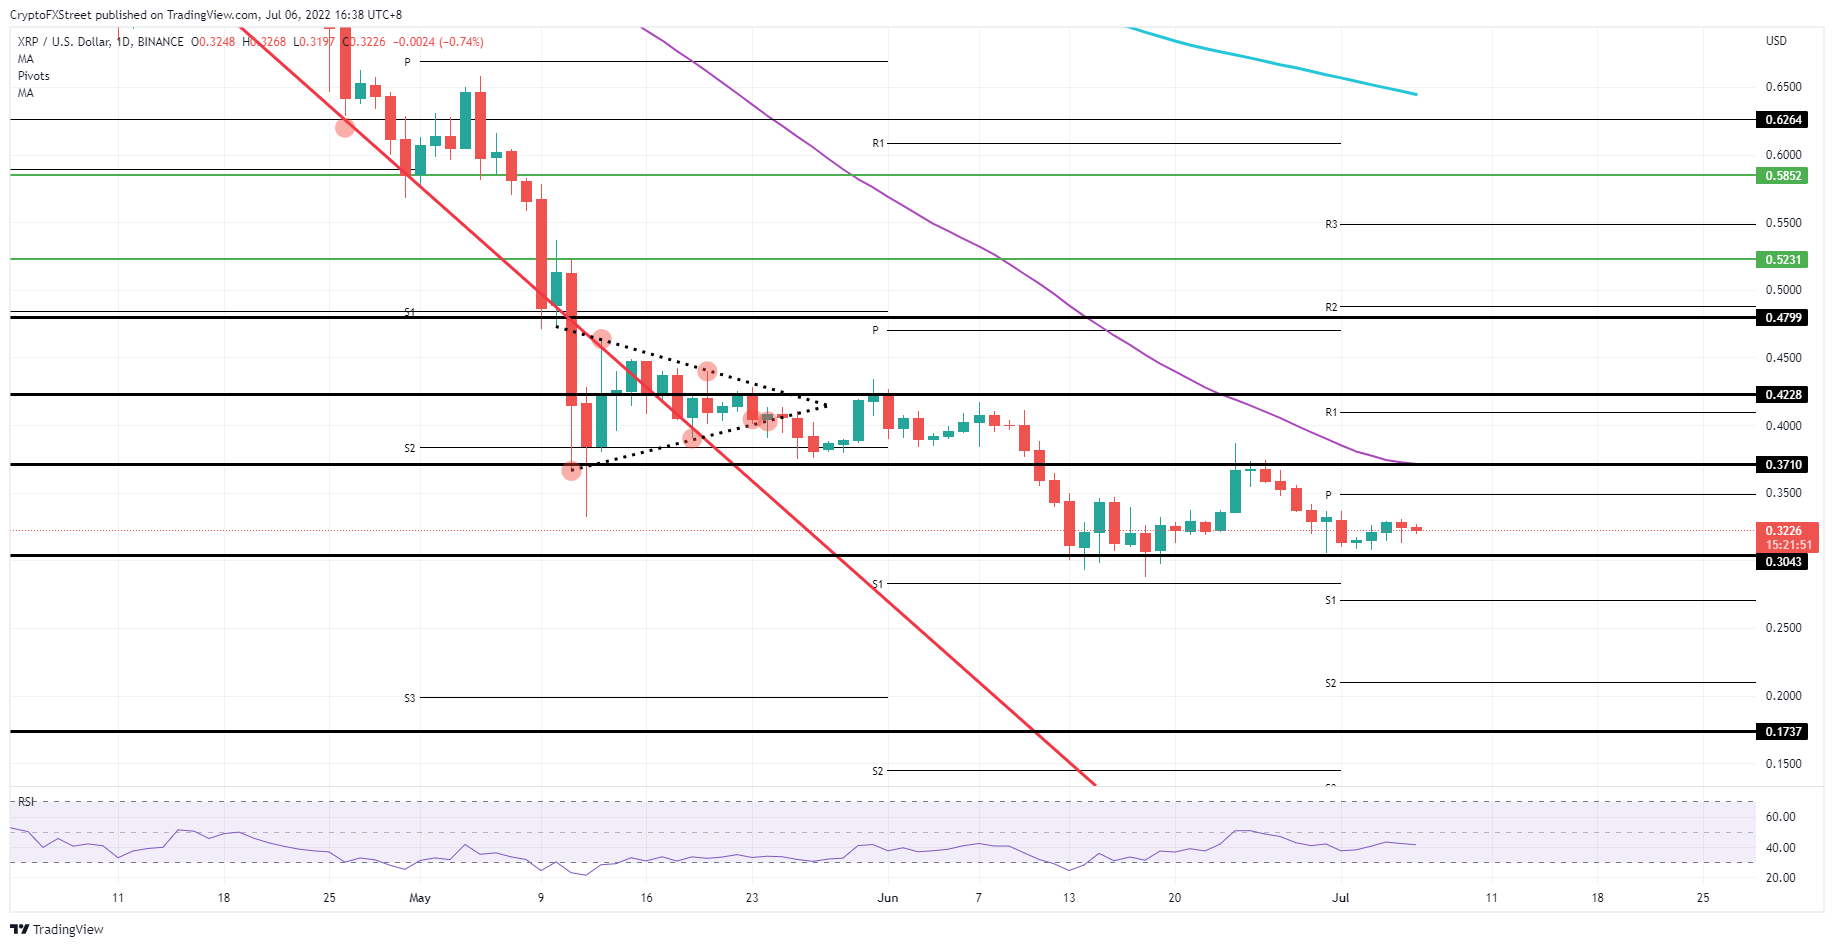
XRP/USD daily chart
Although the situation looks dire, the above mentioned elements in the bond market could remain just one shot across the bough. Price action would trade sideways to higher, and only when XRP price can break above $0.3710, more traders will venture to invest back in the cryptocurrency. An additional motivation is that the 55-day Simple Moving Average coincides with that same $0.3710 level and thus signals that a big bearish driver has been taken out of the equation.
Author

Filip Lagaart
FXStreet
Filip Lagaart is a former sales/trader with over 15 years of financial markets expertise under its belt.


