Top 3 Price Prediction Bitcoin, Ethereum, Ripple: BTC stuck under $65K ahead of FOMC
- Bitcoin price could make a 12% drop to the weekly imbalance zone before reclaiming its ATH.
- Ethereum price likely to drop 10% before ETH becomes attractive for buyers.
- Ripple price could extend the fall with a bearish divergence in play, amid a hidden continuation pattern.
- Volatility has increased in the market ahead of Fed interest rate decision.

Bitcoin (BTC) price slipped below the $65,000 threshold on Tuesday, bringing down with it Ethereum (ETH) price as well as Ripple (XRP) price. Volatility levels have also increased, as markets await Wednesday Federal Open Market Committee (FOMC) policy meeting.
Nevertheless, with expectations of an interest rate pause, and further interest rate hikes off the table, crypto market participants have reason to expect a rally in Bitcoin and altcoins. A pause would hint at the Fed taking a more accommodative stance toward the economy, potentially leading to increased risk appetite among investors, which would be bullish for crypto.
Also Read: Bitcoin price draws further away from its all-time high of $73,777 with BTC halving one month away
Bitcoin, altcoins, stablecoins FAQs
Bitcoin is the largest cryptocurrency by market capitalization, a virtual currency designed to serve as money. This form of payment cannot be controlled by any one person, group, or entity, which eliminates the need for third-party participation during financial transactions.
Altcoins are any cryptocurrency apart from Bitcoin, but some also regard Ethereum as a non-altcoin because it is from these two cryptocurrencies that forking happens. If this is true, then Litecoin is the first altcoin, forked from the Bitcoin protocol and, therefore, an “improved” version of it.
Stablecoins are cryptocurrencies designed to have a stable price, with their value backed by a reserve of the asset it represents. To achieve this, the value of any one stablecoin is pegged to a commodity or financial instrument, such as the US Dollar (USD), with its supply regulated by an algorithm or demand. The main goal of stablecoins is to provide an on/off-ramp for investors willing to trade and invest in cryptocurrencies. Stablecoins also allow investors to store value since cryptocurrencies, in general, are subject to volatility.
Bitcoin dominance is the ratio of Bitcoin's market capitalization to the total market capitalization of all cryptocurrencies combined. It provides a clear picture of Bitcoin’s interest among investors. A high BTC dominance typically happens before and during a bull run, in which investors resort to investing in relatively stable and high market capitalization cryptocurrency like Bitcoin. A drop in BTC dominance usually means that investors are moving their capital and/or profits to altcoins in a quest for higher returns, which usually triggers an explosion of altcoin rallies.
Bitcoin price could drop 12% to the weekly imbalance area
Bitcoin price has formed a Head-and-Shoulders pattern on the daily timeframe, forecasting a 12% drop if the technical formation plays out. The market is leaning towards the downside, with the Relative Strength Index (RSI) nose-diving to signify momentum is falling.
The Awesome Oscillator (AO) is also edging towards the mean level with its histogram bars flashing red. If the bears have their way, BTC price could drop into the weekly imbalance, stretching from $52,985 to $59,005.
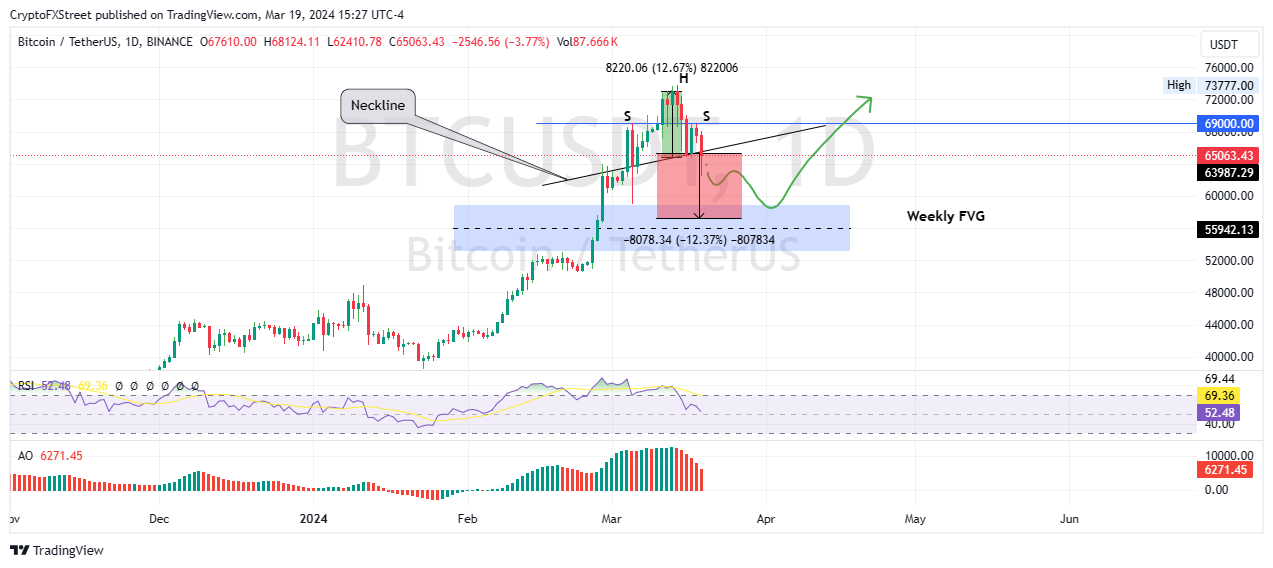
BTC/USDT 1-day chart
On the other hand, if the bulls are able to flip the neckline of the Head-and-Shoulders pattern into support, Bitcoin price could extend north to negate the bearish thesis above the $69,000 threshold.
Also Read: Bitcoin price provides yet another lower buying opportunity 30 days to BTC halving
Ethereum price eyes a 10% drop
Ethereum price has slipped below the most critical Fibonacci retracement level, 61.8% at $3,365, with eyes now peeled on the 50% Fibonacci placeholder at $3,137.
With the RSI nose-diving below the mean level as momentum falls fast, coupled with the AO histogram bars drawing towards negative territory, Ethereum price could drop 10% to find inflection around $3,013 before ETH is attractive for buying.
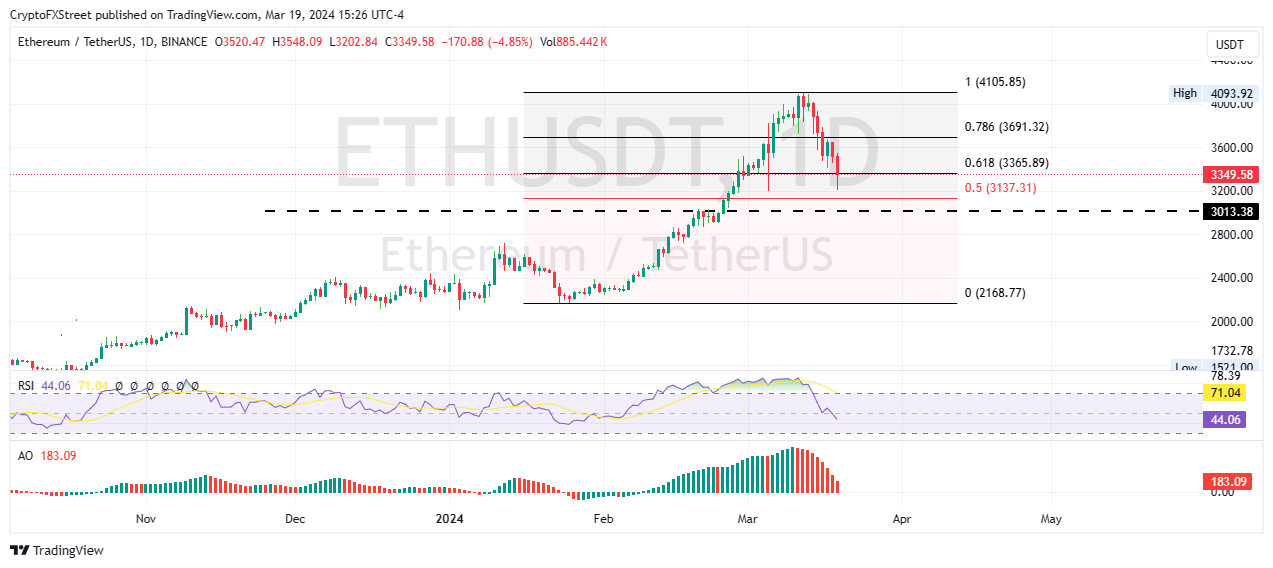
ETH/USDT 1-day chart
Conversely, if the bulls increase their buying pressure at current levels, Ethereum price could pull north, breaching resistance due to the 78.6% Fibonacci retracement level of $3,691.
A flip of this roadblock into support would motivate the late bulls to buy ETH, with the ensuing buying pressure sending ETH price north to record a higher high above the peak of the market range at $4,105. This would constitute a 25% climb above current levels.
Also Read: Ethereum L2 bridge deposits skyrocket after Dencun Upgrade
This bearish divergence could send XRP price lower
Ripple price has recorded higher lows, while the RSI has produced lower lows, culminating in a potential weakening momentum or a trend reversal. It suggests the bullish momentum in XRP price is losing strength as the RSI is showing lower levels.
Increased selling pressure could see Ripple price descend below the ascending trendline, potentially going as low as $0.5500, or in a dire case, extend a leg lower to test the $0.5368 support level. This would constitute a drop of around 11% below current levels.
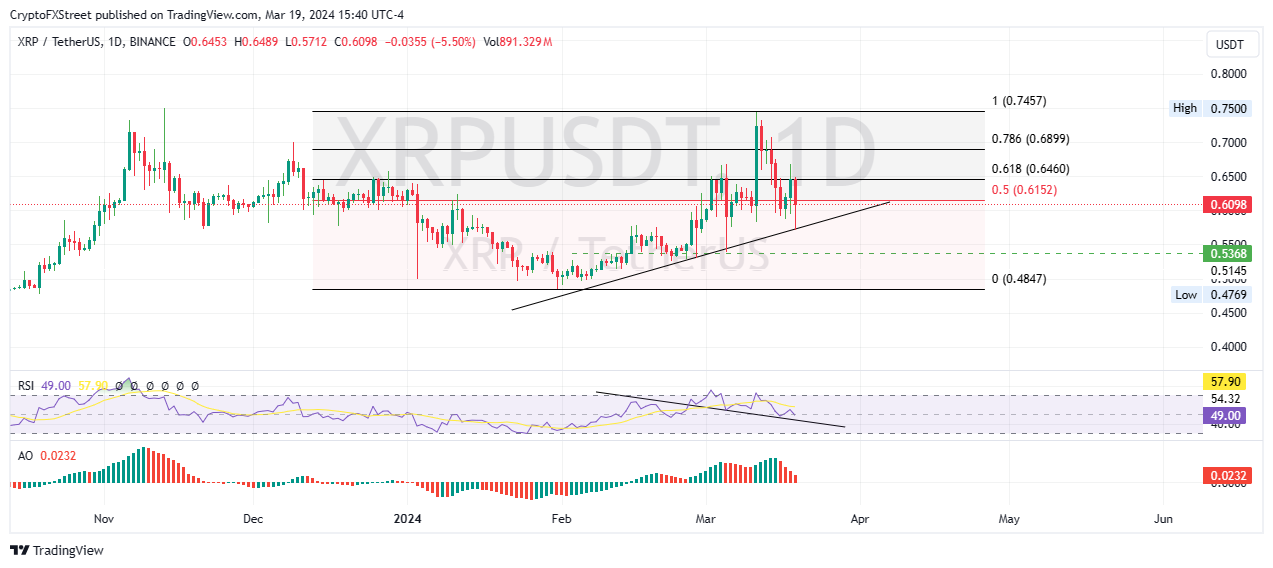
XRP/USDT 1-day chart
Conversely, a recovery by the bulls could see XRP price restore above the 50% Fibonacci placeholder at $0.6152. Enhanced buying pressure above this level could see the price confront the 61.8% Fibonacci retracement level of 0.6460, where stiff resistance is expected.
Overcoming this level would be the signal the skeptics might need to come in en masse and push XRP price further north. This could send XRP price to the peak of the market range at $0.7457, denoting a 24% climb above current levels.
Also Read: XRP trades with modest losses below key $0.60 level
Author

Lockridge Okoth
FXStreet
Lockridge is a believer in the transformative power of crypto and the blockchain industry.