Bitcoin price correction is harsh, but late bulls could still have an opportunity to buy the dip
- Bitcoin price bottomed out at $62,410, causing almost $570 million in total liquidations.
- A Head-and-Shoulders pattern could send BTC 12% lower to the weekly imbalance at $59,005.
- A break and close above the $69,000 neckline would negate the technical formation.

Bitcoin (BTC) price dipped to trade within the $62,000 range, providing late bulls to buy BTC around 15% below its all-time high. The effects of the dump spread across the market, causing millions in liquidations even as the countdown to the halving continues.
Also Read: Bitcoin price shows weakness, but new BTC whales have created solid support at $56,400
Bitcoin, altcoins, stablecoins FAQs
Bitcoin is the largest cryptocurrency by market capitalization, a virtual currency designed to serve as money. This form of payment cannot be controlled by any one person, group, or entity, which eliminates the need for third-party participation during financial transactions.
Altcoins are any cryptocurrency apart from Bitcoin, but some also regard Ethereum as a non-altcoin because it is from these two cryptocurrencies that forking happens. If this is true, then Litecoin is the first altcoin, forked from the Bitcoin protocol and, therefore, an “improved” version of it.
Stablecoins are cryptocurrencies designed to have a stable price, with their value backed by a reserve of the asset it represents. To achieve this, the value of any one stablecoin is pegged to a commodity or financial instrument, such as the US Dollar (USD), with its supply regulated by an algorithm or demand. The main goal of stablecoins is to provide an on/off-ramp for investors willing to trade and invest in cryptocurrencies. Stablecoins also allow investors to store value since cryptocurrencies, in general, are subject to volatility.
Bitcoin dominance is the ratio of Bitcoin's market capitalization to the total market capitalization of all cryptocurrencies combined. It provides a clear picture of Bitcoin’s interest among investors. A high BTC dominance typically happens before and during a bull run, in which investors resort to investing in relatively stable and high market capitalization cryptocurrency like Bitcoin. A drop in BTC dominance usually means that investors are moving their capital and/or profits to altcoins in a quest for higher returns, which usually triggers an explosion of altcoin rallies.
Late bulls could still have opportunity to buy Bitcoin at a discount
Bitcoin price dropped to record an intraday low of $62,410 on Tuesday, provoking a wider market crash. The dip caused almost $570 million in total crypto liquidations, comprising $458 million in longs against $111 million in short positions.

Total liquidations
Out of this, around $136 million was composed of BTC longs and nearly $45 million in short positions. It comes as the countdown to the Bitcoin halving continues, estimated to arrive in 30 days.
While the pullback is harsh, optimists see it as a buying opportunity, and therefore a healthy correction ahead of the halving. If history repeats, the Bitcoin halving could kick off the next bull market like it has in previous cycles.
Elsewhere, reports indicate that between March 10 and 18, MicroStrategy has added 9,245 BTC tokens to its Bitcoin bucket worth around $623 million. The tokens were purchased at an average price of $67,382. With this voluminous buy, the business intelligence firm now holds 214,246 BTC worth $13.6 billion but acquired for $7.53 billion. The average purchase price overall is $35,160.
MicroStrategy has acquired an additional 9,245 BTC for ~$623.0M using proceeds from convertible notes & excess cash for ~$67,382 per #bitcoin. As of 3/18/24, $MSTR hodls 214,246 $BTC acquired for ~$7.53B at average price of $35,160 per bitcoin. https://t.co/oeYJGgiuy0
— Michael Saylor⚡️ (@saylor) March 19, 2024
Notably, the purchases were made using proceeds from convertible notes and excess cash.
Bitcoin price outlook ahead of the halving
Bitcoin price action is defined by a steady climb before BTC topped out at $73,777, followed by a series of lower highs and lower lows. This has culminated in a Head-and-Shoulders pattern. This technical formation signals an upcoming bearish trend.
Three successive price tops, or two shoulders and a head, form the pattern. The head is the middle top, which is at the highest level, while the shoulders are the two other tops that are higher on both sides. The neckline connects the swing lows of the three tops.
The pattern is completed once the price crosses below this neckline, and the target is forecasted by measuring the distance between the neckline and the head and superimposing it from the expected breakout point southwards.
Bitcoin price could make a 12% drop to the weekly imbalance, the Fair Value Gap (FVG), which stretches from $52,985 to $59,005, if this pattern plays out. This could provide a buying opportunity for risk-savvy investors. A break and close below its midline at $55,942 would confirm the continuation of the downtrend.
The Relative Strength Index (RSI) supports this outlook, dropping to signify falling momentum. The histogram bars of the Awesome Oscillator (AO) are also edging toward the mean level amid ongoing profit-taking, encouraged by Bitcoin price’s recent loss of momentum.
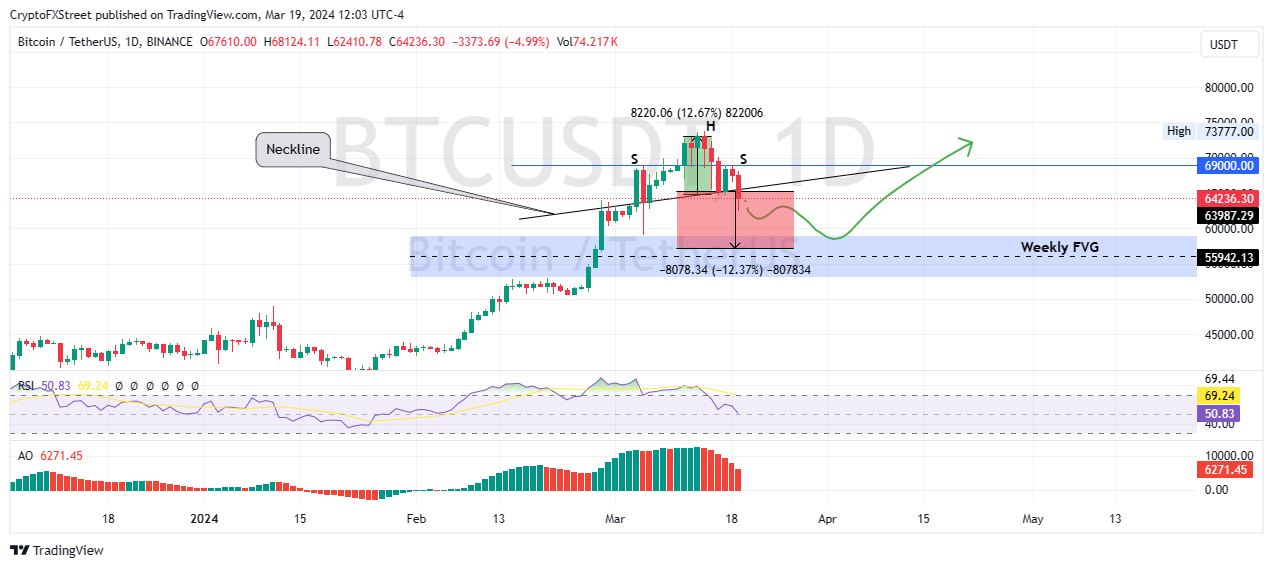
BTC/USDT 1-day chart
On the other hand, if bulls have their way, bulls show up, Bitcoin price could reclaim above the neckline. In a highly bullish case, the gains could send BTC above the $69,000 threshold, above which the bearish thesis would be invalidated.
A flip of the aforementioned resistance into support would encourage the bulls to propel Bitcoin price to reclaim its peak of $73,777 or higher. Such a move would constitute a climb of nearly 13% above current levels.
Author

Lockridge Okoth
FXStreet
Lockridge is a believer in the transformative power of crypto and the blockchain industry.


