Top 3 Price Prediction Bitcoin, Ethereum, Ripple: BTC to breakout as volatility sinks
- Bitcoin price eyes big price changes, either up or down, as volatility shrinks.
- Ethereum price eyes 5% losses as ETH tests crucial support at $1,907.
- Ripple price fills up a pennant as XRP readies to reveal which way the breakout will go.

Bitcoin (BTC) price continues to move sideways with no signs of directional bias, leaving traders guessing. The pioneer crypto's rangebound movement suggests that volatility has dropped, which has held a majority of altcoin ecosystem hostage, including Ethereum (ETH) and Ripple (XRP) prices.
Also Read: Whales are secretly accumulating these two DeFi coins: LINK, UNI
Bitcoin price eyes big changes
Bitcoin (BTC) price shows a shrinking volatility, suggesting a big incoming price change to either upside or downside. The price is moving within a short leash, capped at $31,500 and $29,872 to the upside and downside, respectively. A decisive break and subsequent candlestick close above or below the range will decide the next direction.
With momentum indicators pointing to declining buying pressure, Bitcoin price could break below the lower support level at $29,872. Notably, much uncollected liquidity is underneath this level, which acts as a downside pull for BTC as traders wait for ideal entry positions.
Therefore, a decisive break below the crucial support at $29,872 could see Bitcoin price pull lower toward the $27,500 range. The Relative Strength Index (RSI) and Moving Average Convergence Divergence (MACD) indicators both point south, suggesting falling momentum.
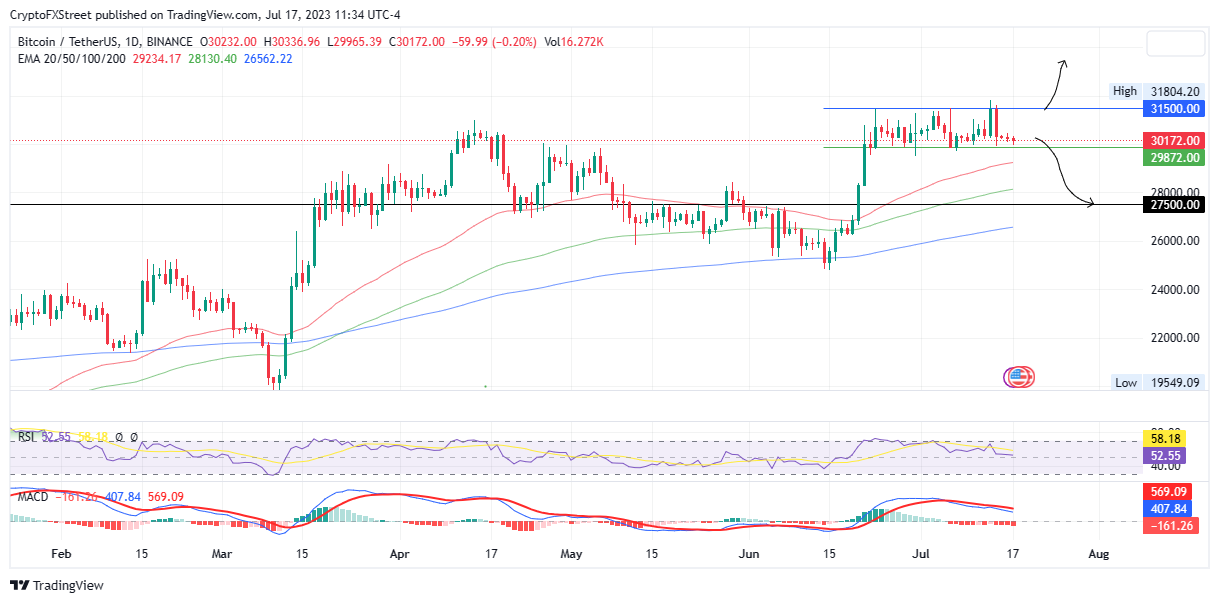
BTC/USDT 1-Day Chart
The 50-, 100-, and 200-day Exponential Moving Averages (EMA) at $29,235, $28,130, and $26,562 all provide entry positions for sidelined investors or those looking to grow their portfolios. As Bitcoin price slides below the critical support, the ensuing buying pressure from these levels could provide more hind winds for BTC to restore north, potentially shattering the $31,500 level to confirm an uptrend.
Also Read: BTC traders brace for $30K loss – Five things to know in Bitcoin this week.
Ethereum price tests critical support
Ethereum (ETH) price is testing crucial support as the downtrend continues. At the current price of $1,907, the largest altcoin by market capitalization is on the brink of breaking below its bullish consolidation along the uptrend line or continuing posting gains above it.
Momentum indicators, comprising the RSI and MACD, point to a drop unless bulls seize the current low-risk buying opportunity to reject the downside. If conservative trading prevails and bulls sit on their hands, a confirmed break below the ascending trendline could open the drains for ETH. This could see the altcoin tag the 50-day EMA at $1,868 or, worse, re-register the July 7 lows around $1,824. This is marked by the support confluence between the 100-day EMA and the horizontal line, making it a robust buyer congestion zone.
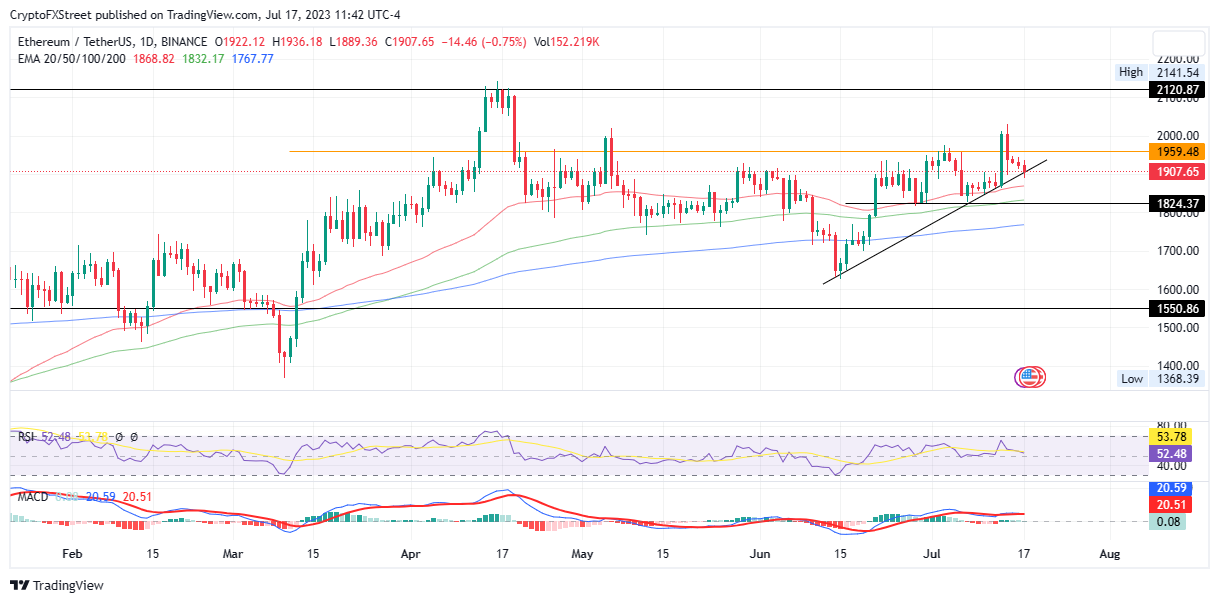
ETH/USDT 1-Day Chart
Conversely, buying pressure from the EMAs could facilitate a north swing, sustaining ETH’s move along the uptrend line and ultimately breaching the $1,959 resistance level. In highly ambitious cases, the Proof-of-Stake (PoS) token could reclaim the mid-April highs around the $2,120 mark.
Also Read: Why Ethereum’s EIP-4844 could kickstart bull run for Optimism (OP), Arbitrum (ARB), Polygon (MATIC)
Ripple price trades marginally as consolidation climaxes
Ripple (XRP) price is filling up a pennant, trading in a steadily narrowing. With neither bulls nor bears giving way to their trading positions, the pennant decides which way this tug-of-war will go.
Notably, however, there are already small spillages below the support offered by the uptrend line of the pennant. This suggests bears might have a better and tighter grip on Ripple price.
This gloomy outlook is reflected by the RSI, showing a bearish divergence against the Ripple price. This comes as XRP records higher highs along the lower boundary of the pennant, while on the other hand, the RSI is showing lower highs.
The odds, therefore, favor the downside suggesting an imminent retest of the mid-July lows around $0.697. A decisive 4-hour candlestick close below this level will confirm the downtrend.
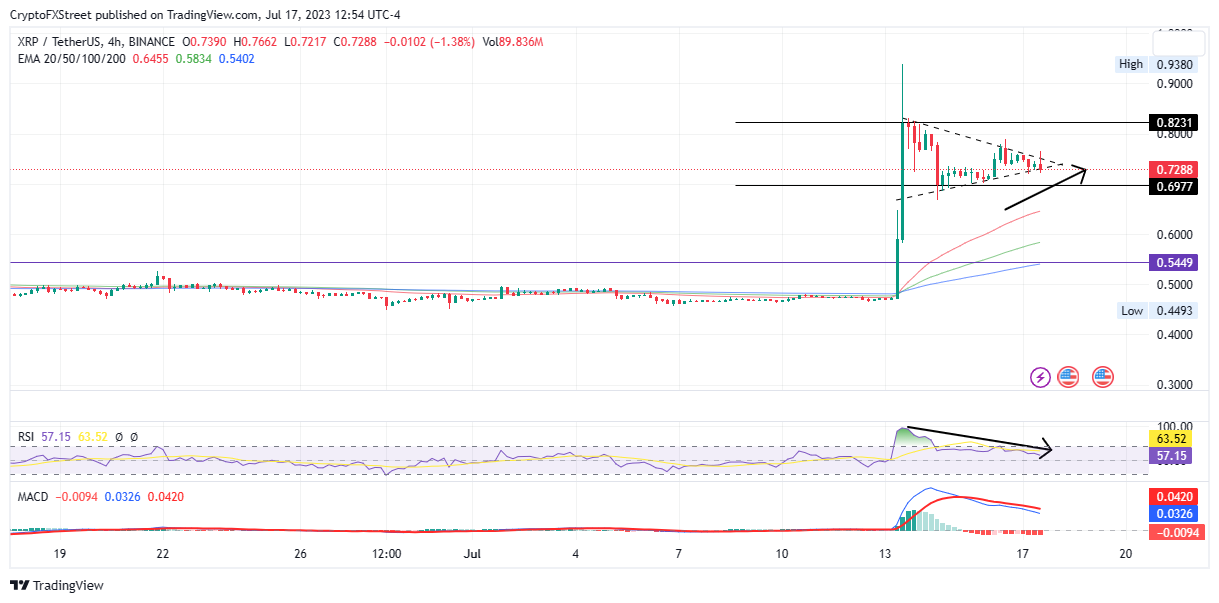
XRP/USDT 4-hour chart
On the other hand, if late investors buy the remittance token, the Ripple price could break the pennant to the north, making a run for the peak of the technical formation at $0.823. Such a move would denote a 15% climb from the current level.
Also Read: XRP ruling puts cryptocurrencies in nuanced position, industry experts weigh in.
Like this article? Help us with some feedback by answering this survey:
Author

Lockridge Okoth
FXStreet
Lockridge is a believer in the transformative power of crypto and the blockchain industry.


