Top 3 Price Prediction Bitcoin, Ethereum, Ripple: BTC consolidates after a new all-time high
- Bitcoin price consolidates between the $87,000 to $93,000 zone.
- Ethereum's price is nearing its support level of $3,000; a close below would cause a further correction.
- Ripple price is testing its resistance level at $1.13; a firm close above would continue its rally.

Bitcoin (BTC) price remains in a consolidation phase after reaching a new all-time high of $93,265 last week. Ethereum's (ETH) price is nearing its support level; a close below would cause a further price decline, while Ripple's (XRP) price shows bullish momentum as it tests and potentially breaks key resistance.
Bitcoin price consolidates within $87,000 to $93,000
Bitcoin price surged and reached a new all-time high (ATH) of $93,265 on Wednesday. Since then, it has been consolidating, with initial support of around $87,000. At the time of writing on Monday, it trades slightly higher, around $90,500.
If BTC drops below the $87,000 support level, it could lead to further declines toward $85,000. A successful close below this level might trigger a deeper sell-off to $78,800.
The Relative Strength Index (RSI) also stands at 74, well above its overbought level of 70. It points downwards, signaling increasing risk. Traders should exercise caution when adding to their long positions, as a move out of the overbought territory by the RSI could provide a clear sign of a pullback.
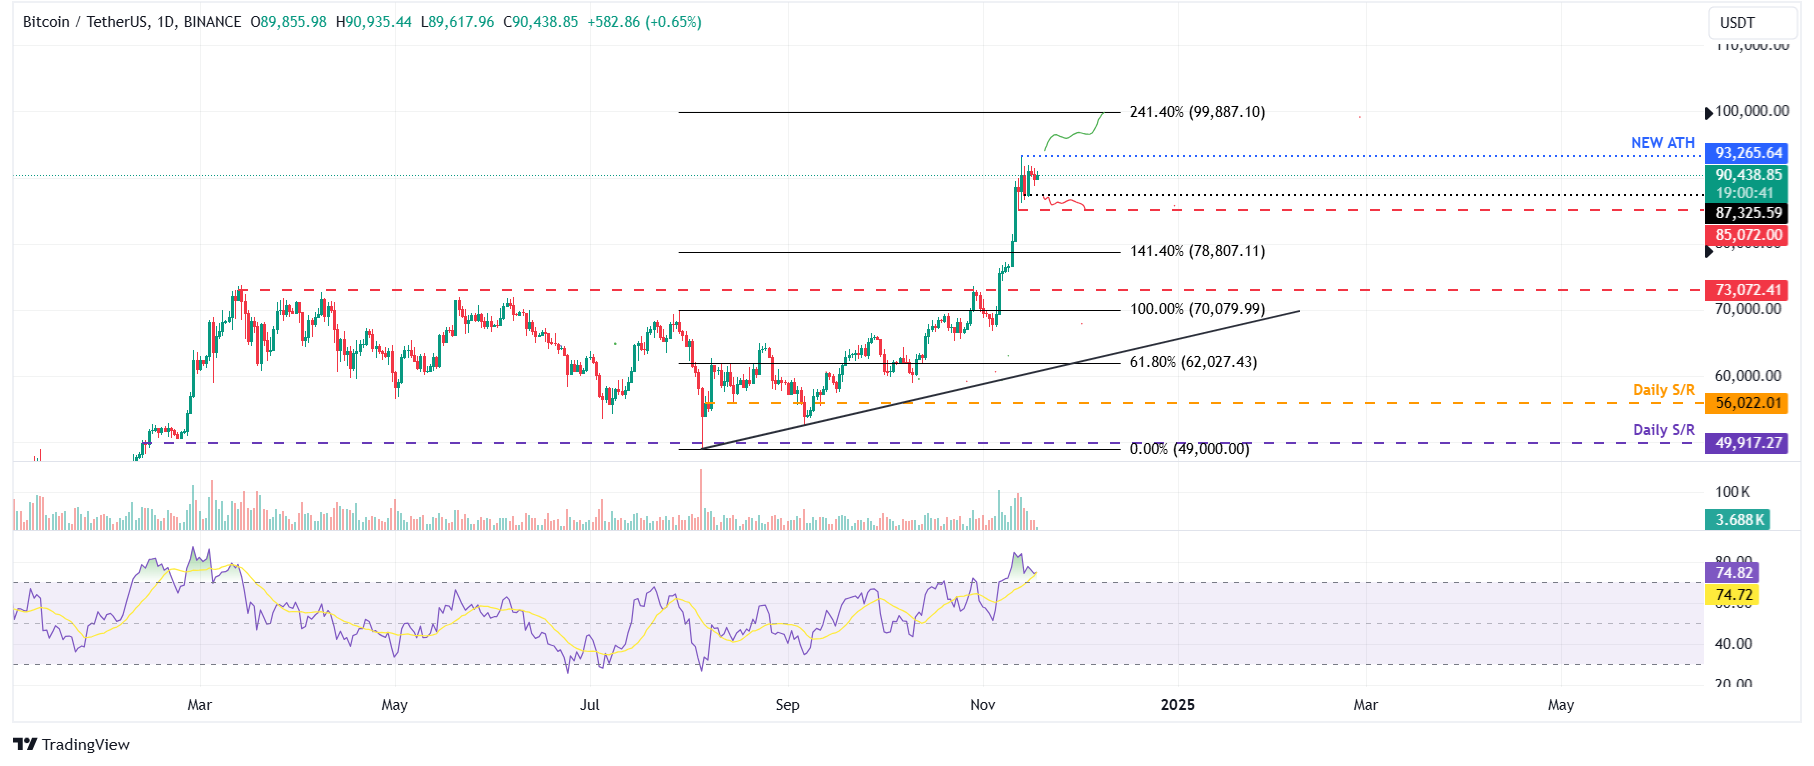
BTC/USDT daily chart
Conversely, if BTC breaks above and closes above $92,625, the rally could extend to the significant psychological level at $100,000.
Ethereum price is set for a downturn if it closes below $3,000
Ethereum price declined 8.8% until Sunday after being rejected around the weekly level of $3,454 on Tuesday. On Monday, it trades slightly higher, around $3,100, approaching its psychologically important level of $3,000.
If ETH closes below the $3,000 level, it could decline to retest its 200-day Exponential Moving Average of around $2,799.
The RSI indicator on the daily chart reads 61 after exiting its overbought level of 70. If the RSI continues its decline and closes below the neutral level of 50, the Ethereum price will further decline.
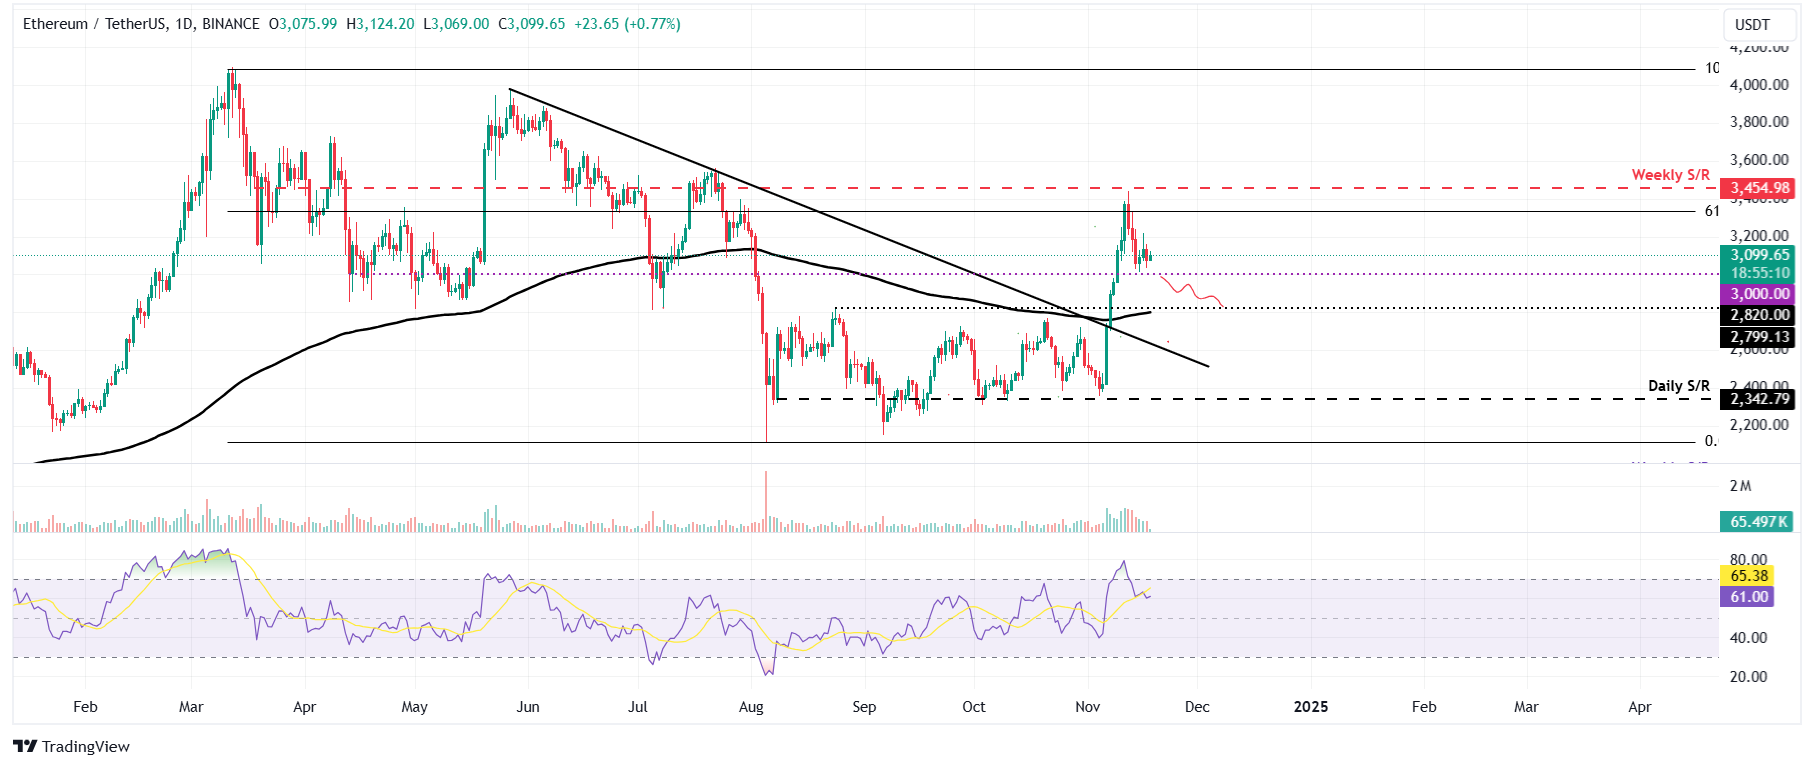
ETH/USDT daily chart
On the other hand, If ETH breaks and closes above the weekly resistance at $3,454, it will rally to retest its psychologically important $4,000 level.
Ripple price could extend rally above key resistance
Ripple price broke above the daily resistance of $0.718 on Thursday and rallied 62.5% until Saturday. It declined 5.9% on Sunday as it failed to close above the 50% price retracement at $1.13. On Monday, it trades higher by 8.8%, breaking above $1.13.
If XRP closes above $1.13, it could extend the rally by 21% to retest its next daily resistance at $1.372.
The RSI read 85, well above its overbought level of 70, signaling increasing risk. Traders should exercise caution when adding to their long positions, as a move out of the overbought territory by the RSI could provide a clear sign of a pullback.
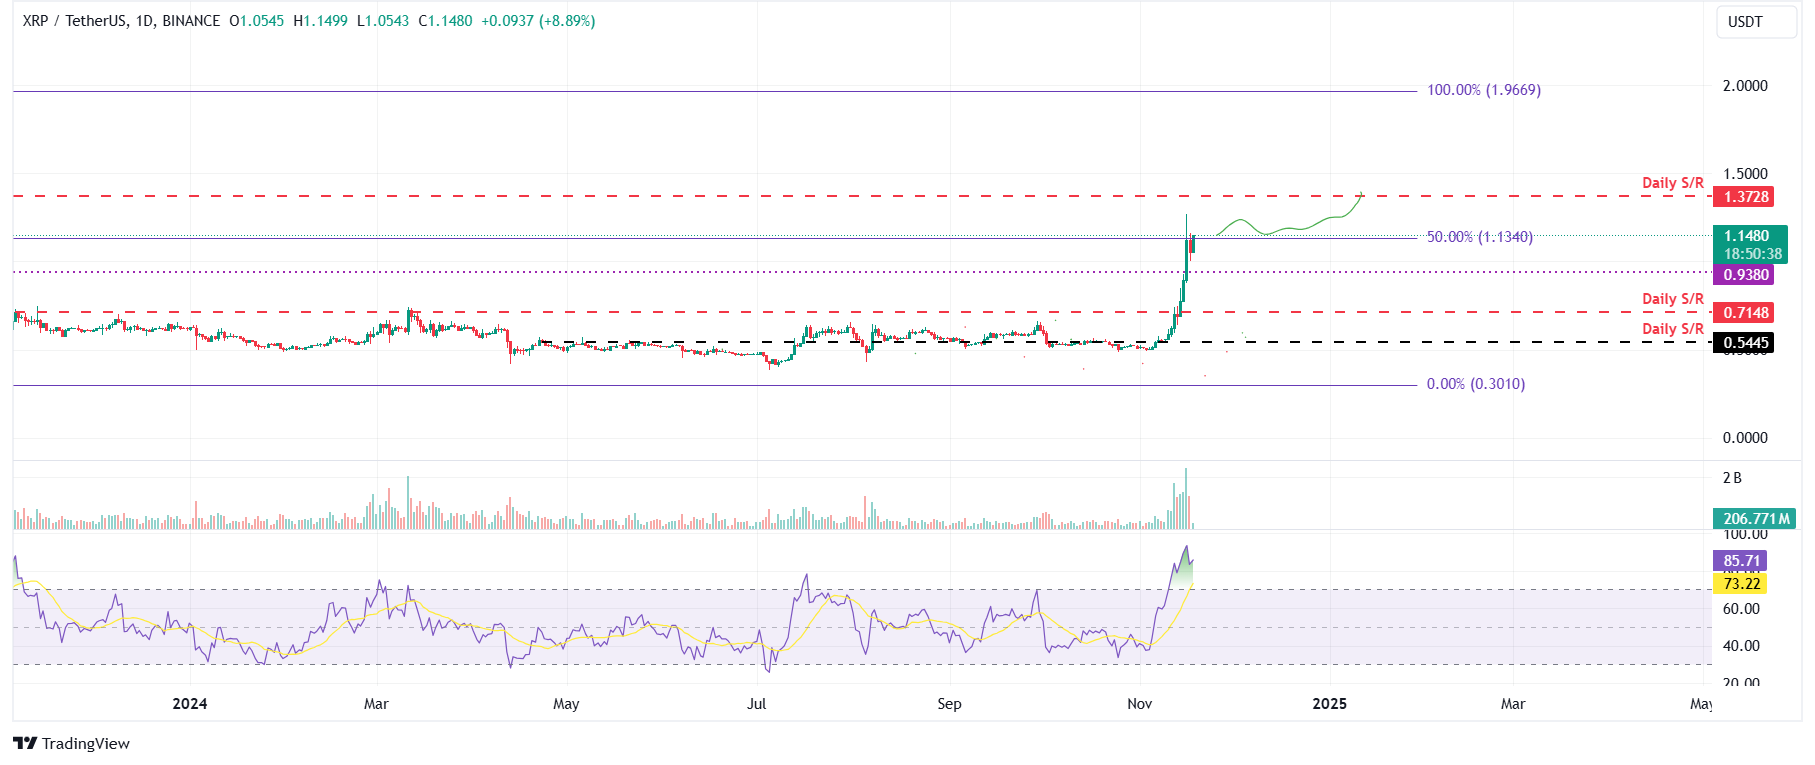
XRP/USDT daily chart
However, if XRP fails to close above $1.13, it could decline to retest its psychologically important level of $1.00.
Author

Manish Chhetri
FXStreet
Manish Chhetri is a crypto specialist with over four years of experience in the cryptocurrency industry.


