Top 3 Price Prediction Bitcoin, Ethereum, Ripple: Bitcoin shows resilience, sets sight on $65,000 milestone
- Bitcoin price bounces off key psychological level of $62,000, eyeing a rally ahead.
- Ethereum price breaks and closes above its resistance barrier, signaling a bullish move on the horizon.
- Ripple price holds above its support level at $0.544, suggesting a continuation of an upward trend.

Bitcoin (BTC) and Ripple (XRP) have stabilized around their key support levels and positioning for potential rallies. At the same time, Ethereum (ETH) has broken above its resistance barrier, signaling a bullish momentum on the horizon.
Bitcoin gains momentum, targets $65,000 threshold
Bitcoin broke above the ascending trendline and the 100-day Exponential Moving Average at $61,000 on September 18. It rose 3% in the next four days and found support around its key psychological level of $62,000. At the time of writing on Monday, it continues to trade above the $63,800 level.
If the psychological support of $62,000 continues to hold, BTC could continue its upward move and retest its daily resistance level at $65,379.
The Moving Average Convergence Divergence (MACD) indicator further supports Bitcoin’s rise, signaling a bullish crossover on the daily chart. The MACD line (blue line) moved above the signal line (yellow line), giving a buy signal. It shows rising green histogram bars above the neutral line zero, also suggesting that Bitcoin’s price could experience upward momentum.
Furthermore, the Relative Strength Index (RSI) on the daily chart shows that Bitcoin is not yet overbought, as it trades at 63 but is close to the overbought level of 70. If it enters the zone on a closing basis, traders will be advised not to add to their long positions, although the rally may continue. If it enters overbought and then exits back into the neutral level of 50, it will be a sign of a deeper correction.
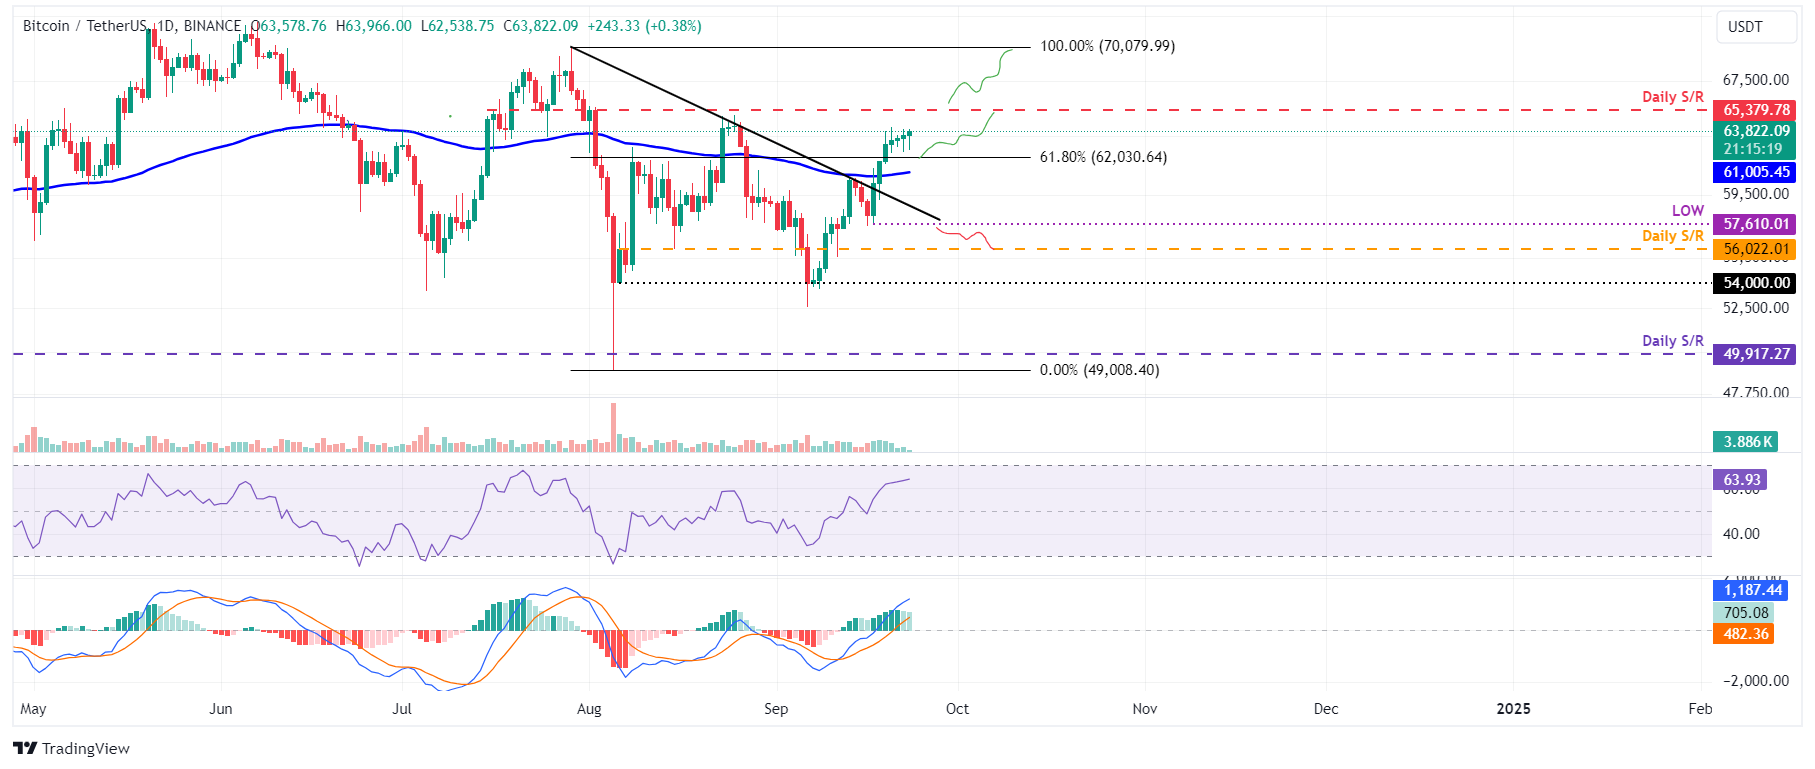
BTC/USDT daily chart
However, if Bitcoin fails to find support at around $62,000 and declines to close below its September 17 low of $57,610, it could extend the decline by 3% to retest its daily support of around $56,000.
Ethereum sets stage for a rally after surpassing resistance barrier
Ethereum price broke above the descending trendline and closed above its daily resistance level at $2,461 on Friday. As of Monday, it continues to rise, trading at the $2,681 level.
If the $2,461 holds as support, ETH could continue its upswing and retest its August 24 high of $2,820.
The MACD indicator further supports Ethereum’s rise, signaling a bullish crossover on the daily chart. The MACD line moved above the signal line, giving a buy signal. It shows rising green histogram bars above the neutral line zero, also suggesting that Ethereum’s price could experience upward momentum.
Furthermore, the RSI indicator trades at 61, above its neutral level of 50, and points upwards. A cross to levels over 60 indicates bullish momentum is gaining traction.
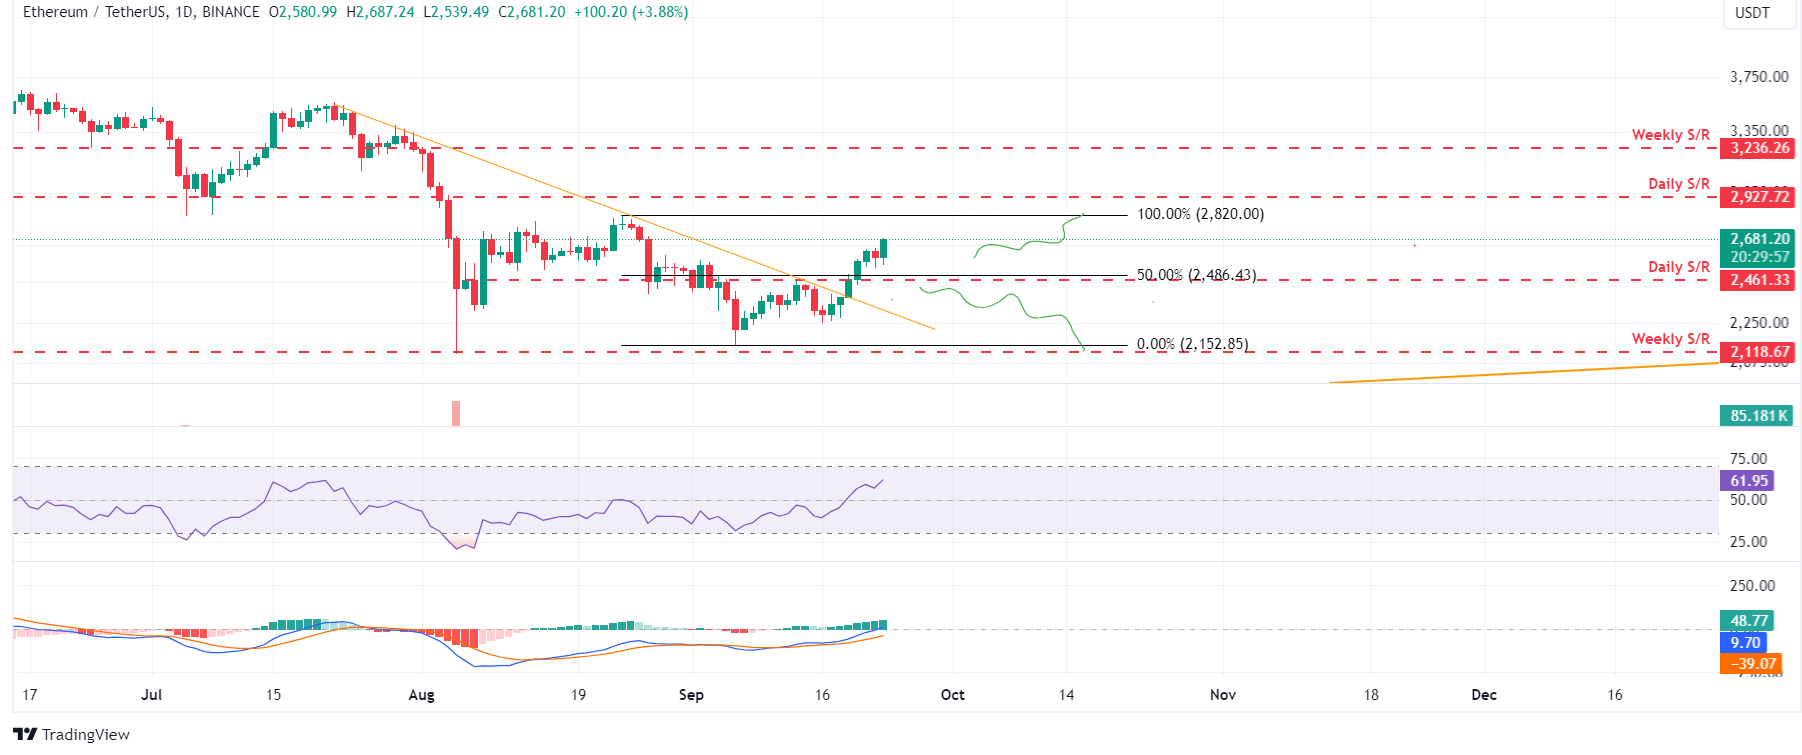
ETH/USDT daily chart
On the other hand, if Ethereum closes below the daily support level of $2,461, it could decline further to retest its September 6 low of $2,152.
Ripple price stabilizes above support, hinting at a continuation of upward momentum
Ripple price stabilized above its daily support level of $0.544 over a week. This daily level roughly coincides with the 200-day EMA at $0.552, making it a key support zone. As of Monday, it is trading around at $0.589.
If the 200-day EMA and daily support around $0.544 remain as support, XRP could continue its upward trend and retest its daily resistance level at $0.626.
The MACD indicator further supports Ripple’s rally, signaling a bullish crossover on the daily chart. The MACD line moved above the signal line, giving a buy signal. It shows rising green histogram bars above the neutral line zero, also suggesting that Ripple’s price could experience upward momentum.
Additionally, the RSI indicator trades at 56, above its neutral level of 50. A cross to levels over 60 would indicate that bullish momentum is gaining traction.
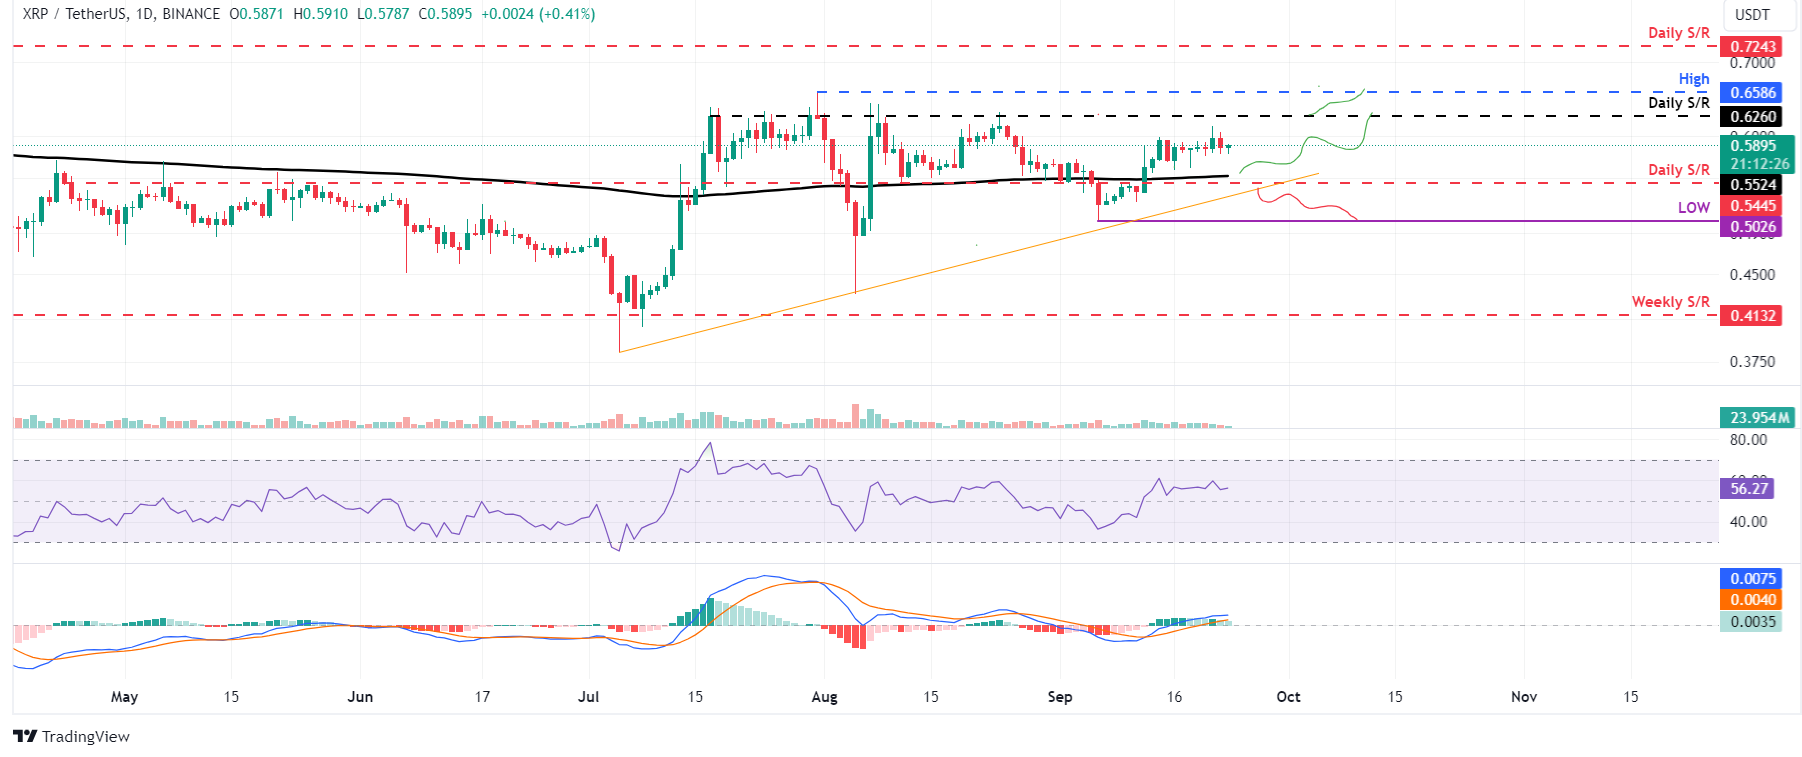
XRP/USDT daily chart
However, the bullish outlook would be invalidated if Ripple’s daily candlestick closes below the $0.544 daily support level and breaks below the ascending trendline. In such a case, XRP would decline 7.5% to retest its September 6 low of $0.502.
Bitcoin, altcoins, stablecoins FAQs
Bitcoin is the largest cryptocurrency by market capitalization, a virtual currency designed to serve as money. This form of payment cannot be controlled by any one person, group, or entity, which eliminates the need for third-party participation during financial transactions.
Altcoins are any cryptocurrency apart from Bitcoin, but some also regard Ethereum as a non-altcoin because it is from these two cryptocurrencies that forking happens. If this is true, then Litecoin is the first altcoin, forked from the Bitcoin protocol and, therefore, an “improved” version of it.
Stablecoins are cryptocurrencies designed to have a stable price, with their value backed by a reserve of the asset it represents. To achieve this, the value of any one stablecoin is pegged to a commodity or financial instrument, such as the US Dollar (USD), with its supply regulated by an algorithm or demand. The main goal of stablecoins is to provide an on/off-ramp for investors willing to trade and invest in cryptocurrencies. Stablecoins also allow investors to store value since cryptocurrencies, in general, are subject to volatility.
Bitcoin dominance is the ratio of Bitcoin's market capitalization to the total market capitalization of all cryptocurrencies combined. It provides a clear picture of Bitcoin’s interest among investors. A high BTC dominance typically happens before and during a bull run, in which investors resort to investing in relatively stable and high market capitalization cryptocurrency like Bitcoin. A drop in BTC dominance usually means that investors are moving their capital and/or profits to altcoins in a quest for higher returns, which usually triggers an explosion of altcoin rallies.
Author

Manish Chhetri
FXStreet
Manish Chhetri is a crypto specialist with over four years of experience in the cryptocurrency industry.


