Top 3 Price Prediction Bitcoin, Ethereum, Ripple: Bitcoin passes the torch to Ethereum
- Bitcoin loses market dominance and gives room for improvement in the Altcoin segment.
- Ethereum leaves its side-show role and takes the lead in the market.
- Ripple plays dangerously with disaster and could move toward the $0.14 level quickly.

The price falls seen in the early hours of the Asian session condition the day and dye of concern a favorable scenario. The market is in the middle of a transition process, after the essential technical events that have occurred in the last hours.
The first of these key indicators is the ETH/BTC chart, which shows the pair breaking out of the long-term downward trend line that has held the price since February 2019.
Following this special event, Ethereum is now free to actively improve its valuation against the Bitcoin, which will benefit the entire Altcoin segment.
The second key event of the last hours is the loss of crucial supports in the Bitcoin dominance chart. After several days of holding above the 66% market share level, the mark is now at 65.79% and has as its first short term target at the 64.5% level.
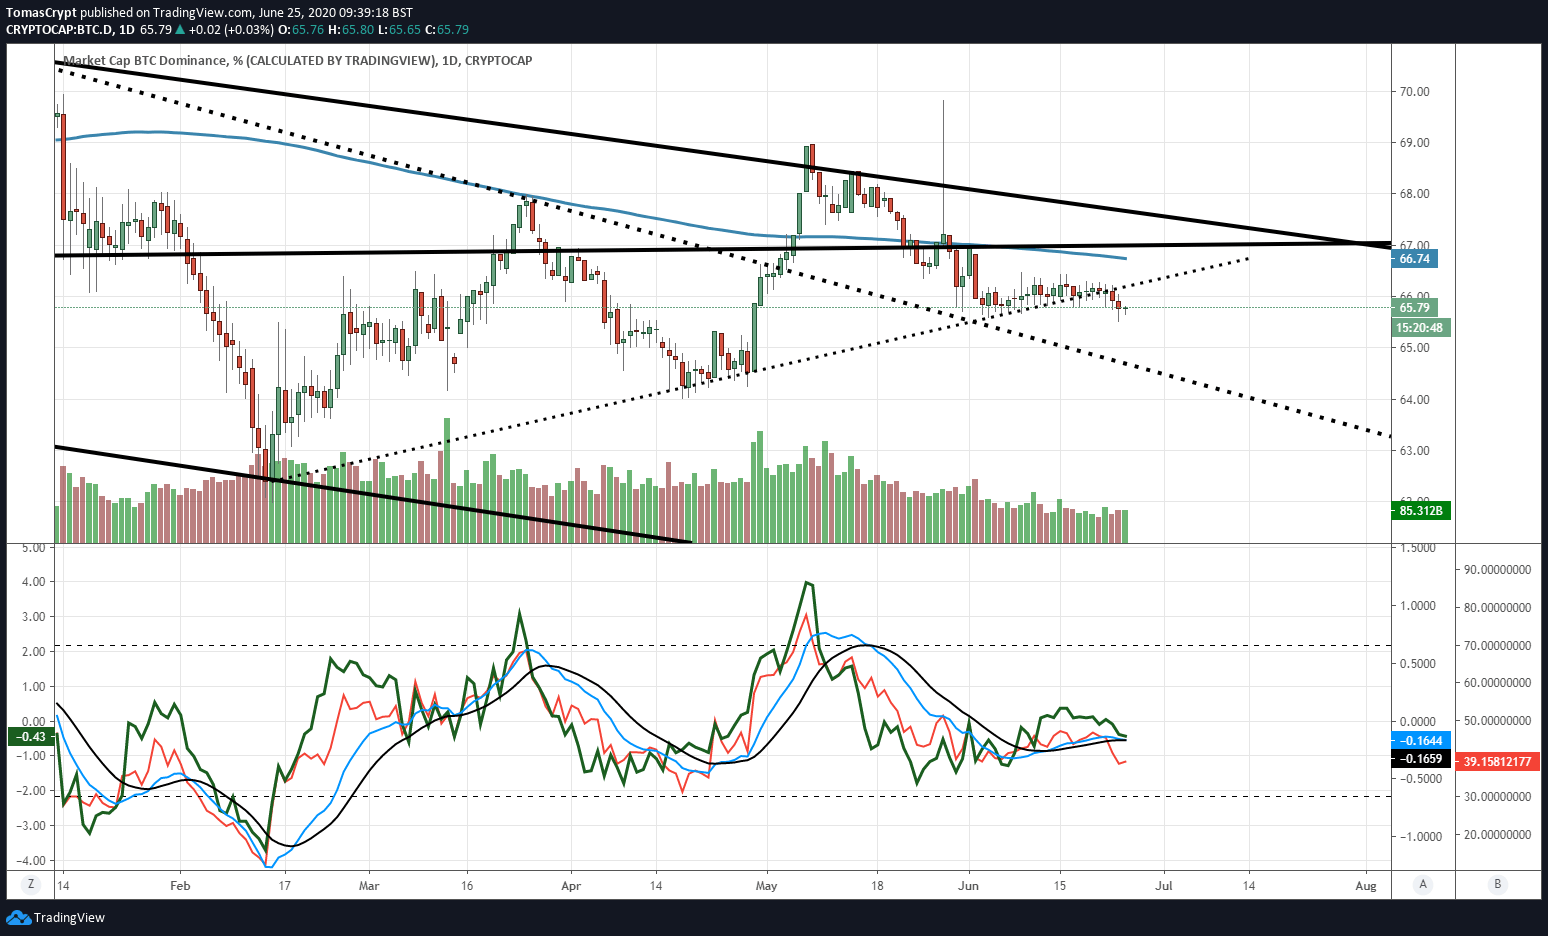
Both events reinforce the idea that the market has turned in favor of Ethereum and the Altcoin segment.
The falls in the last hours put the market sentiment level back into the fear zone and left the neutral levels of the beginning of the week in a mere mirage.
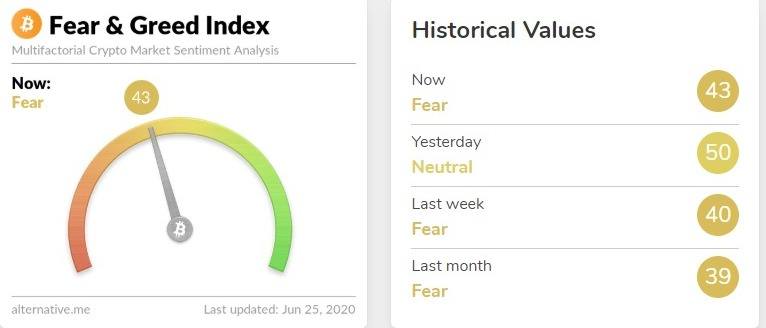
Now the crypto market has everything in its favor to start the expected bull market and the current declines, which can still elongate in time and range, are buying opportunities for patient traders.
ETH/BTC Daily Chart
The ETH/BTC pair is currently trading at 0.0252 after reaching a high yesterday near the 0.026 level, a relative high.
Above the current price, the first resistance level is at 0.026, then the second at 0.0277 and the third one at 0.0295.
Below the current price, the first support level is at 0.025, then the second at 0.0247 and the third one at 0.0235.
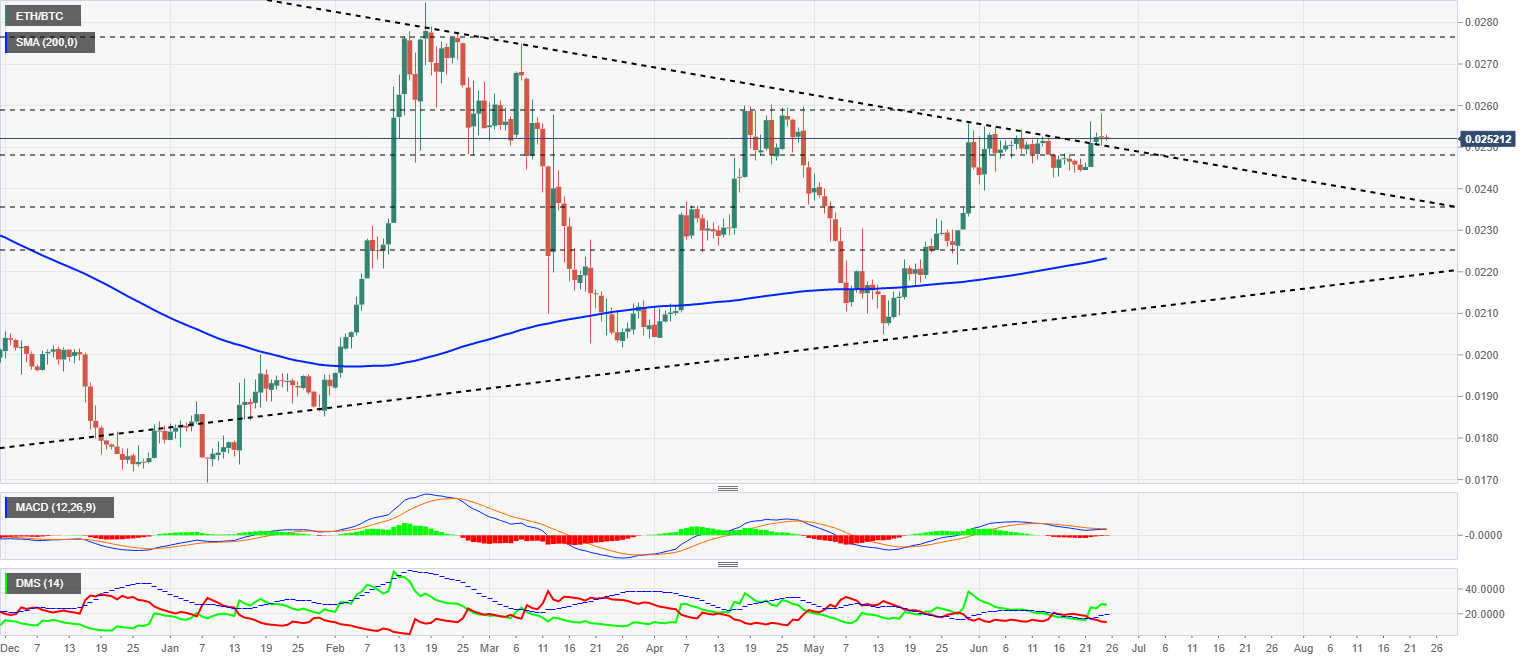
The MACD on the daily chart is close to forming a bullish cross again but needs a final upward movement to allow for a clear upward cross. An upward breach at this point could jeopardize the current bright spot.
The DMI on the daily chart shows the bulls taking a good lead over the bears. The bears are resisting the move and remain at levels similar to those of the past few weeks.
BTC/USD Daily Chart
The BTC/USD pair is currently trading at the $9295 price level after dropping below the $9000 mark. The BTC/USD chart moves within an expansive triangle scenario.
Above the current price, the first resistance level is at $9500, then the second at $9975 and the third one at $10400.
Below the current price, the first support level is at $8988, then the second at $8730 and the third one at $8300.

The MACD on the daily chart is moving just above the neutral level of the indicator as it seems to be developing a "MACD cross failure" pattern that could lead to a bullish cross in the coming days.
The DMI on the daily chart shows the bears are in control of the pair, enjoying a significant advantage over the bulls.
ETH/USD Daily Chart
The ETH/USD pair is currently trading at $234.3, leaving an ugly bearish return structure on the daily chart, which, although incomplete, puts the price at risk in the short term. The current price range allows for prices in the $220 zone without this implying a change towards a bearish scenario.
Above the current price, the first resistance level is at $220, then the second at $200 and the third one at $264.
Below the current price, the first support level is at $200, then the second at $195 and the third one at $186.
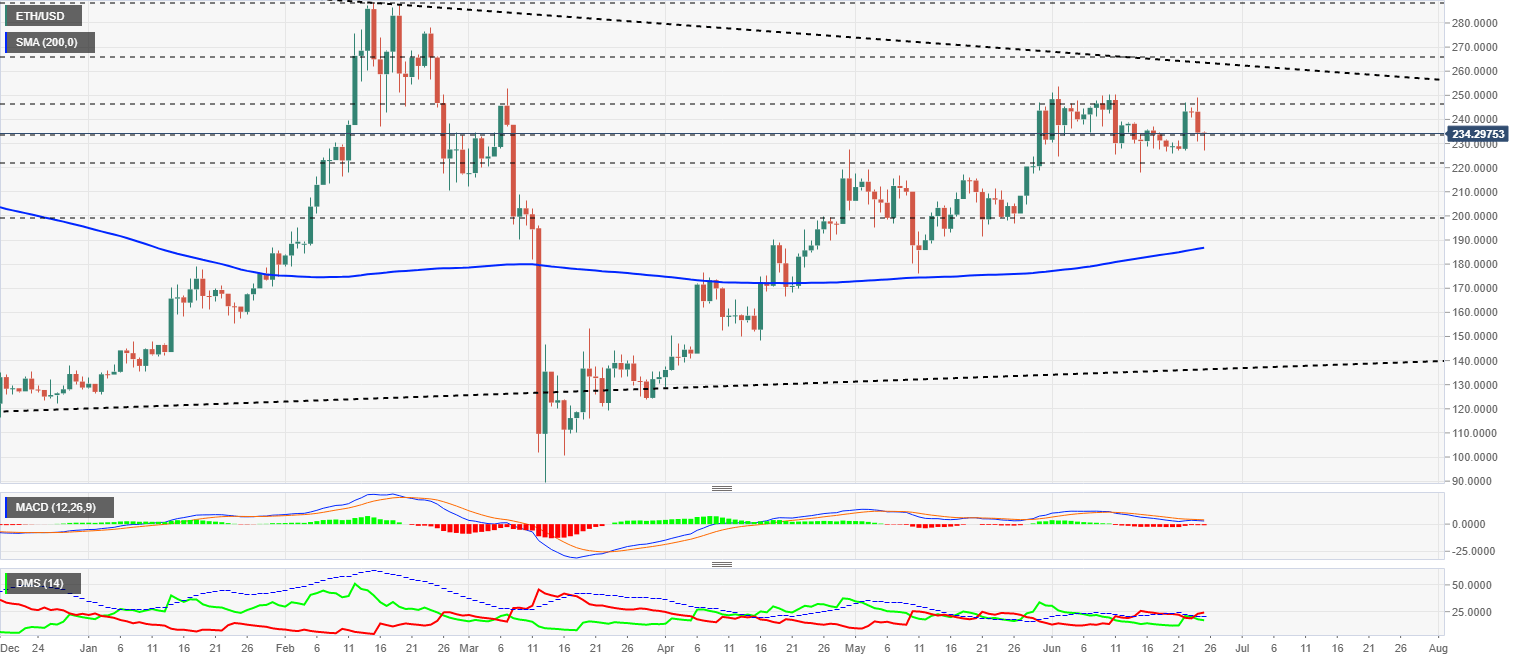
The MACD on the daily chart remains above the neutral level of the indicator, from where the moving averages could quickly turn upward.
The DMI on the daily chart shows bears with a small advantage over bulls. The sell-side also manages to break the ADX line, which reinforces the sellers' current control position.
XRP/USD Daily Chart
The XRP/USD pair is currently trading at the price level of $0.183 and is regaining the critical support level provided by the rising trend line that shapes the current triangle structure. In case we lose this support level at $0.18, we could see a major sell-off looking for the support level at $0.165 first and $0.14 later.
Above the current price, the first resistance level is at $0.184, then the second at $0.20 and the third one at $0.215.
Below the current price, the first support level is at $0.18, then the second at $0.162 and the third one at $0.14.
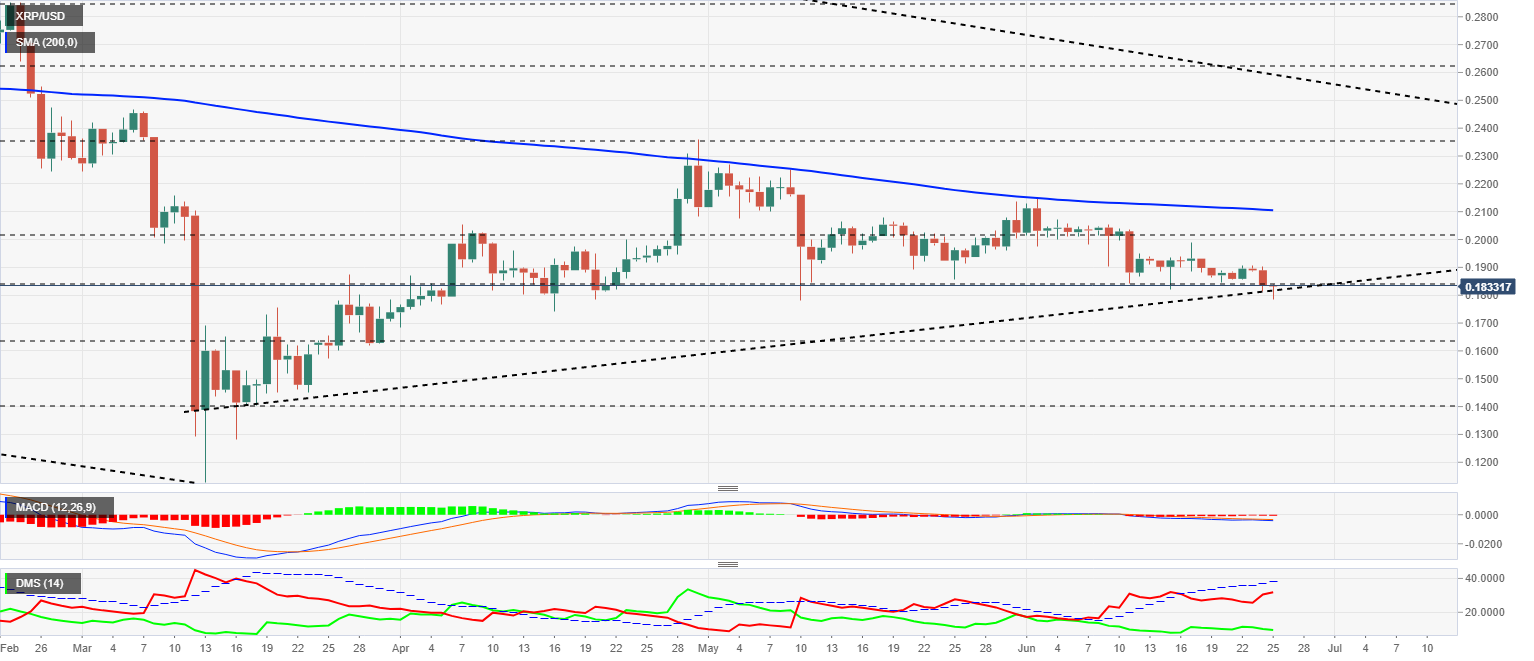
The MACD on the daily chart continues to develop a very flat trajectory just below the neutral level of the indicator. The current structure is conducive to sudden price declines.
The DMI on the daily chart shows the bears gaining momentum again, although they have limited upward movement due to the presence of the ADX line. The bulls are still at deficient levels, far from being able to jeopardize the dominance of the sell-side.
Author

Tomas Salles
FXStreet
Tomàs Sallés was born in Barcelona in 1972, he is a certified technical analyst after having completing specialized courses in Spain and Switzerland. He expanded his technical training following the guidance of great experts on the financial markets.


