Top 3 Price Prediction Bitcoin, Ethereum, Ripple: Bitcoin over $12000 but needs to finish the job
- Crypto market shows signs of fatigue, but no one ventures to open short positions.
- Extreme bullish sentiment weighs on the crypto market.
- Ripple could accompany the Bitcoin upwards if the bulls manage to keep control.

Traders moving in the crypto environment have their sights set on breaking the $12000 level in the BTC/USD pair. Bitcoin has spent three weeks playing with this resistance level, and now, once it's passed, it seems to be figuring out what to do.
The natural cycle of the market usually leaves Bitcoin moves for last, but technically, it doesn't seem that the King of cryptocurrencies has the strength needed for such a move.
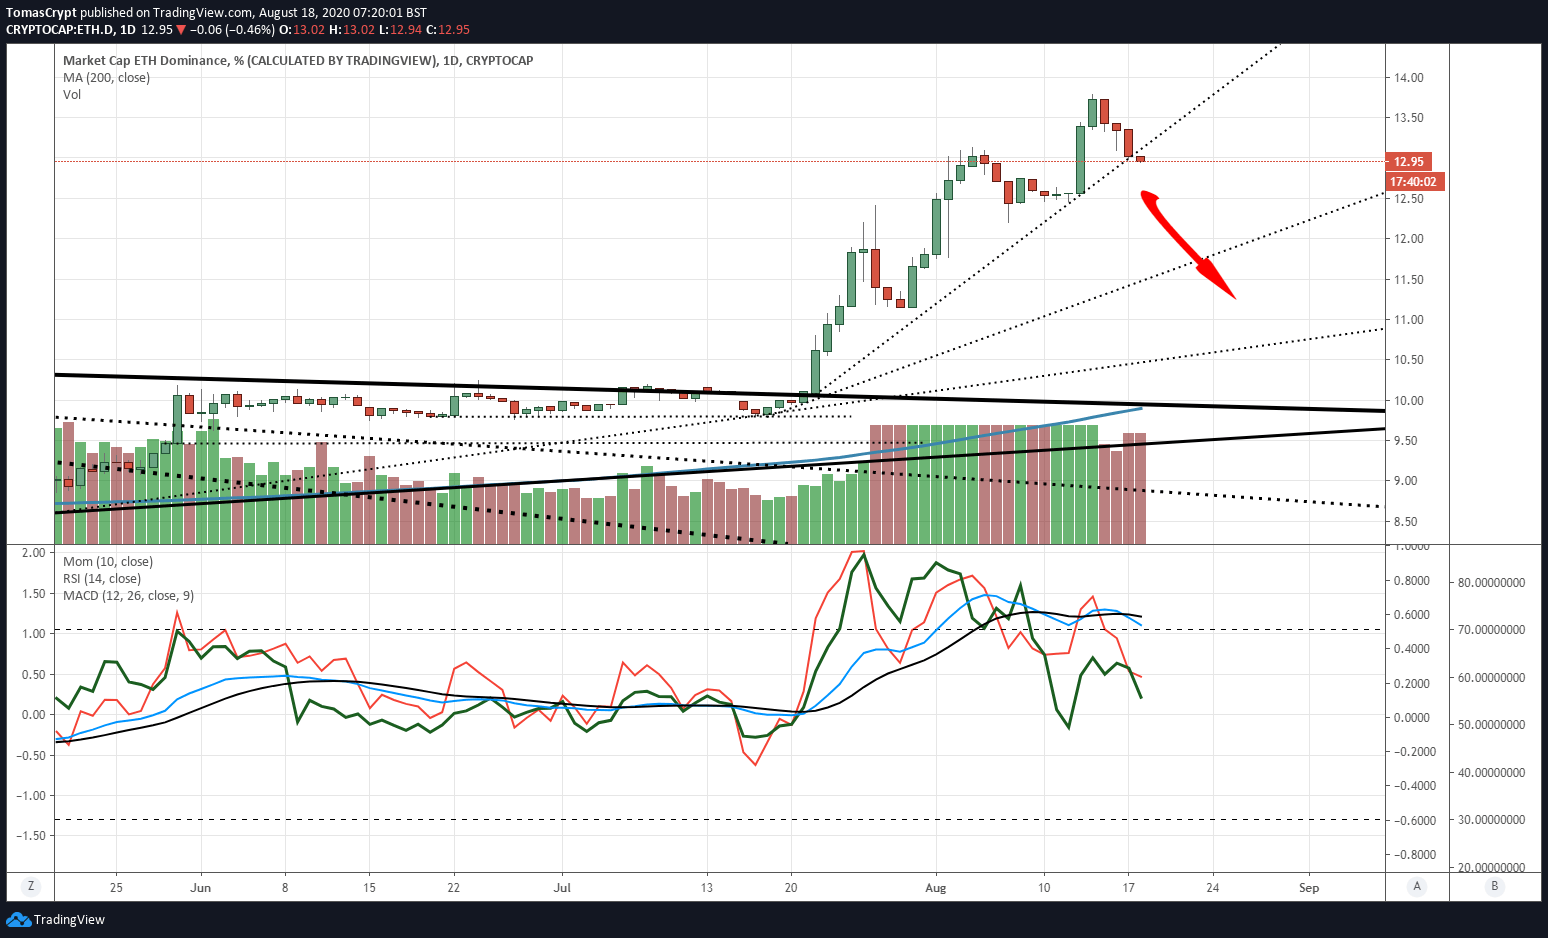
The technical indicators on the Bitcoin dominance chart are not well set up for a new bullish stretch and urgently need a radical upward move to change this situation.
Ethereum's dominance chart also shows the exhaustion of the brutal uptrend of the past few weeks. Ether's current market share level is 13%, and it may move down to seek support at the 12% level first and 11% later.
The risk of ending the current bullish phase and proceeding to a consolidation of gains is high by the very high level of greed shown by the sentiment indicator prepared by the website alternative.me.
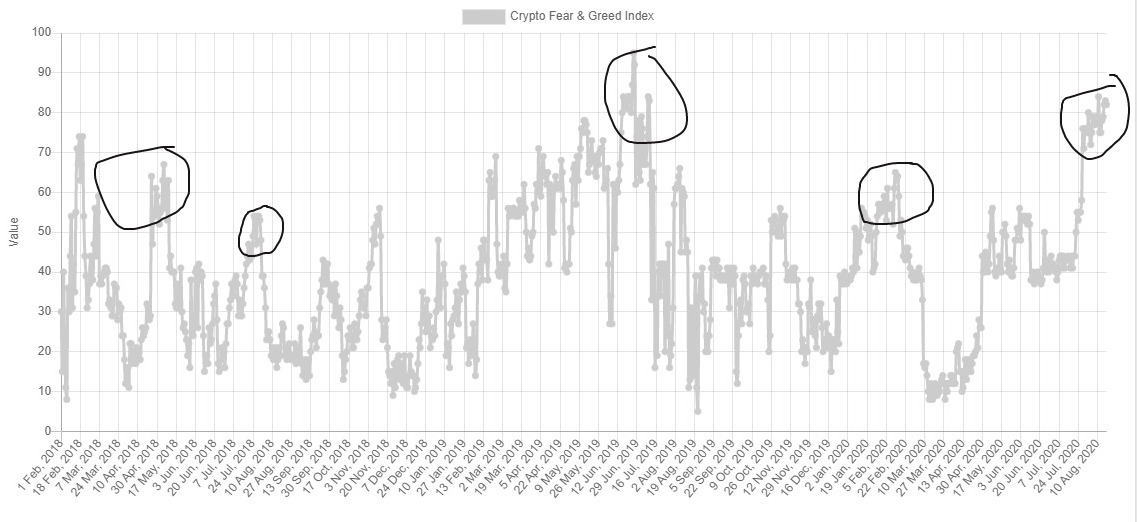
The indicator is currently at level 82, on a scale ranging from 0 to 100, and continues to build a ceiling that statistically ends in price drops in the market and correction of the euphoria towards more neutral levels.
ETH/BTC Daily Chart
The ETH/BTC pair is currently trading at 0.0350 and makes it clear that the goal for the day is to avoid closing below this support level. If Ethereum's value drop against Bitcoin accelerates, the primary target is at 0.031, where the 50-day exponential moving average passes.
Above the current price, the first resistance level is at 0.0372, then the second at 0.03815 and the third one at 0.0387.
Below the current price, the first support level is at 0.035, then the second at 0.0333 and the third one at 0.0316.
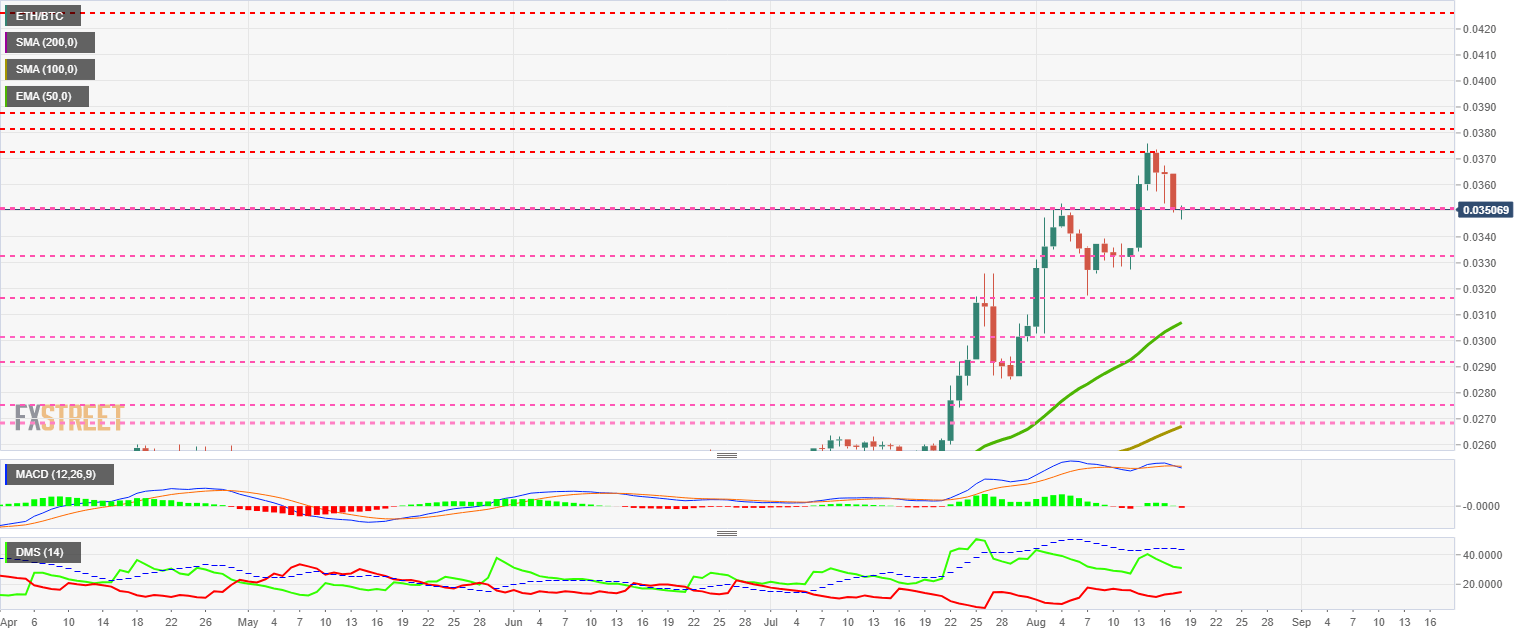
The MACD on the daily chart has crossed back into the downtrend after last week's false move. The behavior pattern of this indicator does not give it much chance of turning around, and therefore the price development should be bearish.
The DMI on the daily chart shows the bears rising sharply, while the bulls do not seem to be worried and do not move at the same level of intensity.
BTC/USD Daily Chart
The BTC/USD pair is currently trading at the price level of $12250 and is just two resistance levels away from the relative high reached in the spring of 2019 at $14000.
Above the current price, the first resistance level is at $12850, then the second at $13975 and the third one at $17150.
Below the current price, the first support level is at $12250, then the second at $11300 and the third one at $10675.
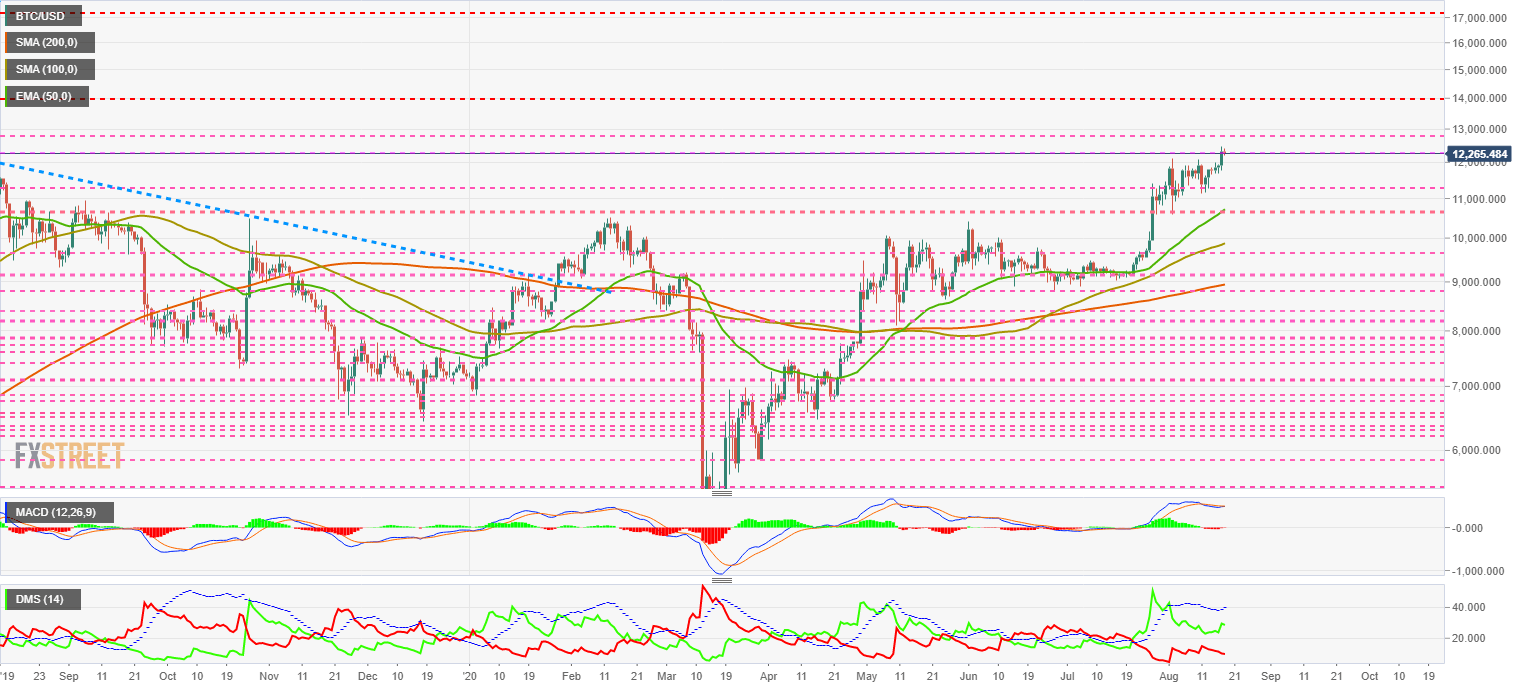
The MACD on the daily chart shows a bullish cross attempt in progress. BTC/USD needs to move to the next resistance level to complete the bullish cross, or it will drop to the $11000 price zone.
The DMI on the daily chart shows bulls rebounding upwards, while bears are moving downwards, cautious of the upward breach of the $12000 price congestion resistance.
ETH/USD Daily Chart
The ETH/USD pair is currently trading at a price level of $430, showing great difficulty in overcoming the price congestion resistance level at $440. The upward extension movement from the $385 price level seems to have consumed the remaining energy of ETH/USD.
Above the current price, the first resistance level is at $440, then the second at $485 and the third one at $525.
Below the current price, the first support level is at $385, then the second at $350 and the third one at $335.
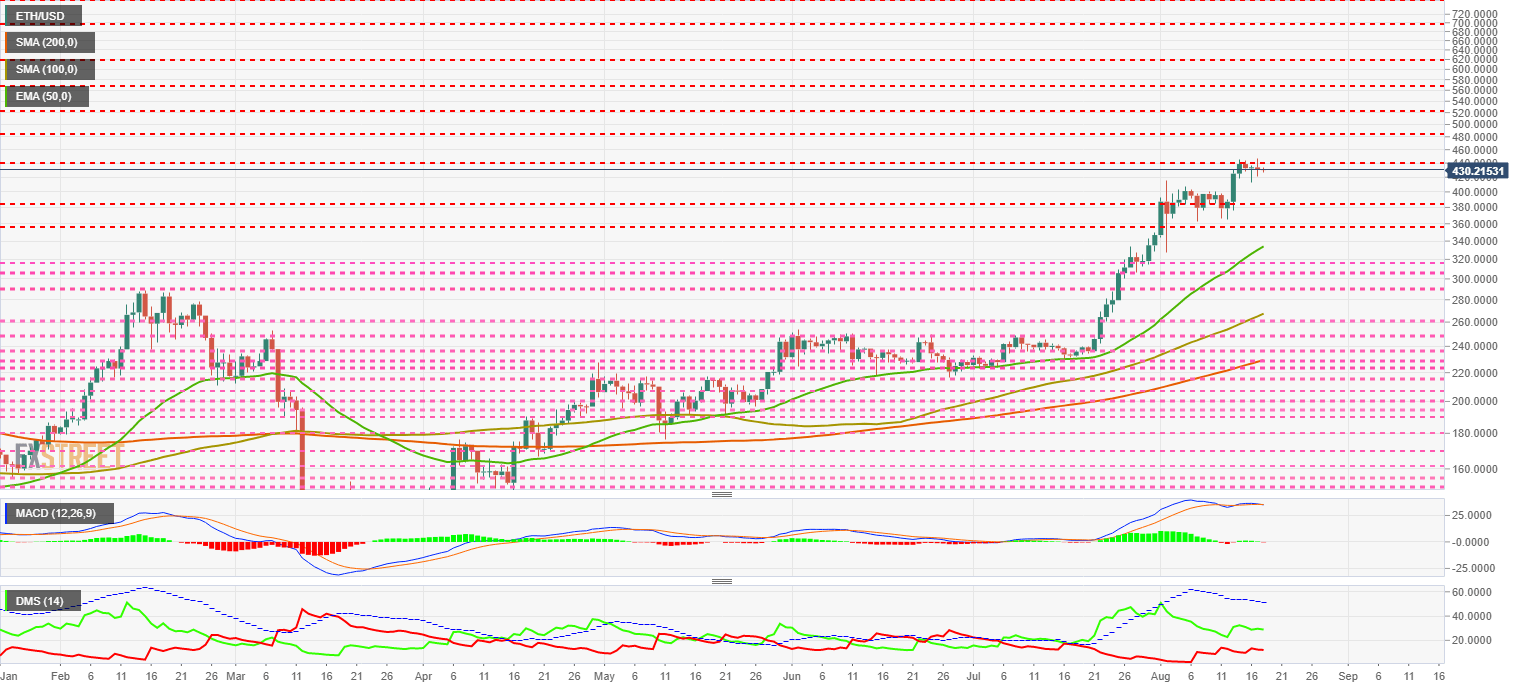
The MACD on the daily chart shows an ongoing bearish cross. ETH/USD could accelerate the price drop in the next few hours.
The DMI on the daily chart shows bears increasing their trend force and approaching the level of a bull that is losing strength day by day.
XRP/USD Daily Chart
The XRP/USD pair is currently trading at the price level of $0.316 after closing above its relative high in February.
Above the current price, the first resistance level is at $0.32, then the second at $0.33 and the third one at $0.335.
Below the current price, the first support level is at $0.30, then the second at $0.29 and the third one at $0.285.
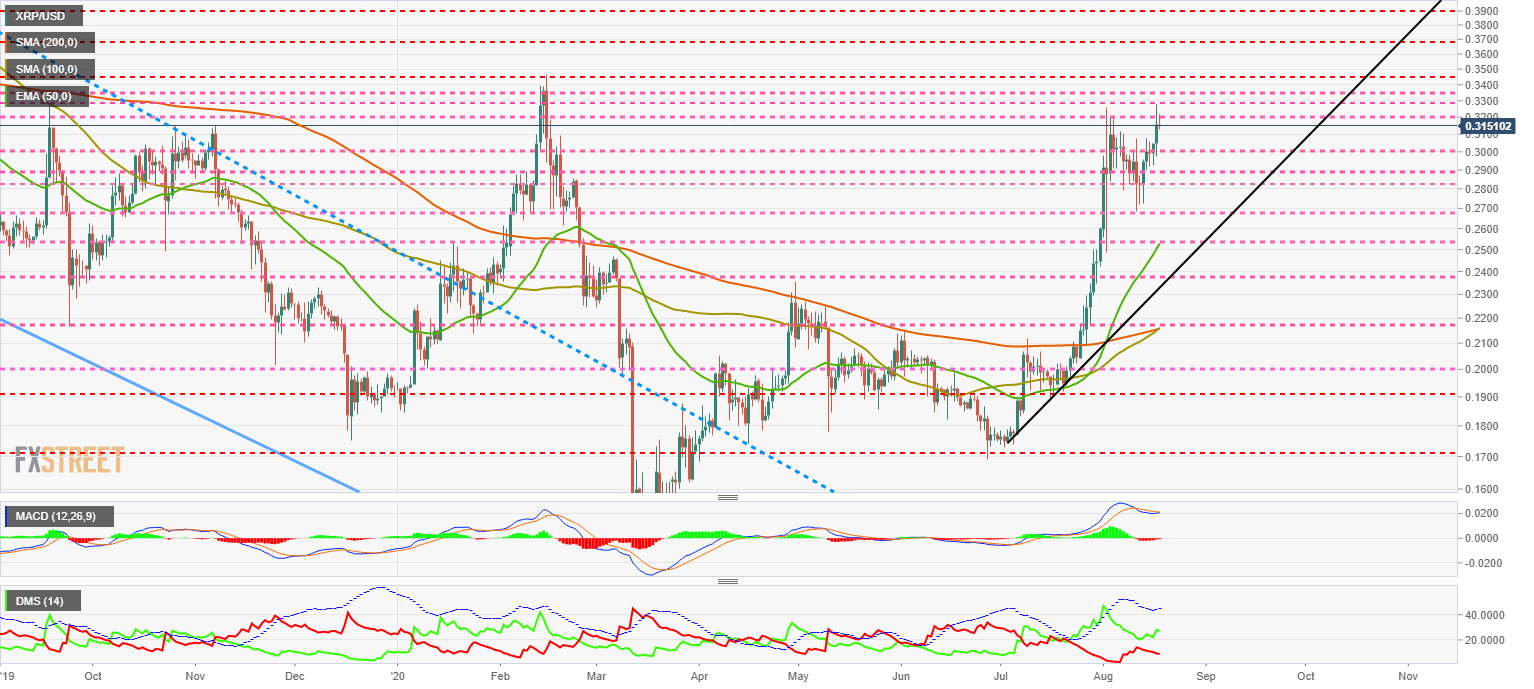
The MACD on the daily chart is trying to undo the bearish cross. The bullish cross is not yet confirmed and won't be for another two days.
The DMI on the daily chart shows the bulls increasing their strength while the bears continue to lose muscle. This setup is favorable for a further bullish move in the XRP/USD pair.
Author

Tomas Salles
FXStreet
Tomàs Sallés was born in Barcelona in 1972, he is a certified technical analyst after having completing specialized courses in Spain and Switzerland. He expanded his technical training following the guidance of great experts on the financial markets.


