Top 3 Price Prediction Bitcoin, Ethereum, Ripple: Bitcoin on track to restore its Kingdom
-
The Bitcoin dominance chart shows an optimal set-up for back at the top of the market.
-
The Ethereum loses strength and suffers to keep up with King Bitcoin.
-
Ripple has options to accompany Bitcoin, but not without risk.

The market is following the script expected in the last few days. King Bitcoin is showing his strength and climbing quite comfortably while the Altcoin segment – and mainly the Ethereum – is struggling to keep up.
Bitcoin's dominance chart gives us all the information we need to specify the strategic scenario where the market is. Bitcoin has been losing market share since last May, respecting the downward trend line. In the previous months, Bitcoin has attempted to break out of the bullish trend two times, both of which have failed.
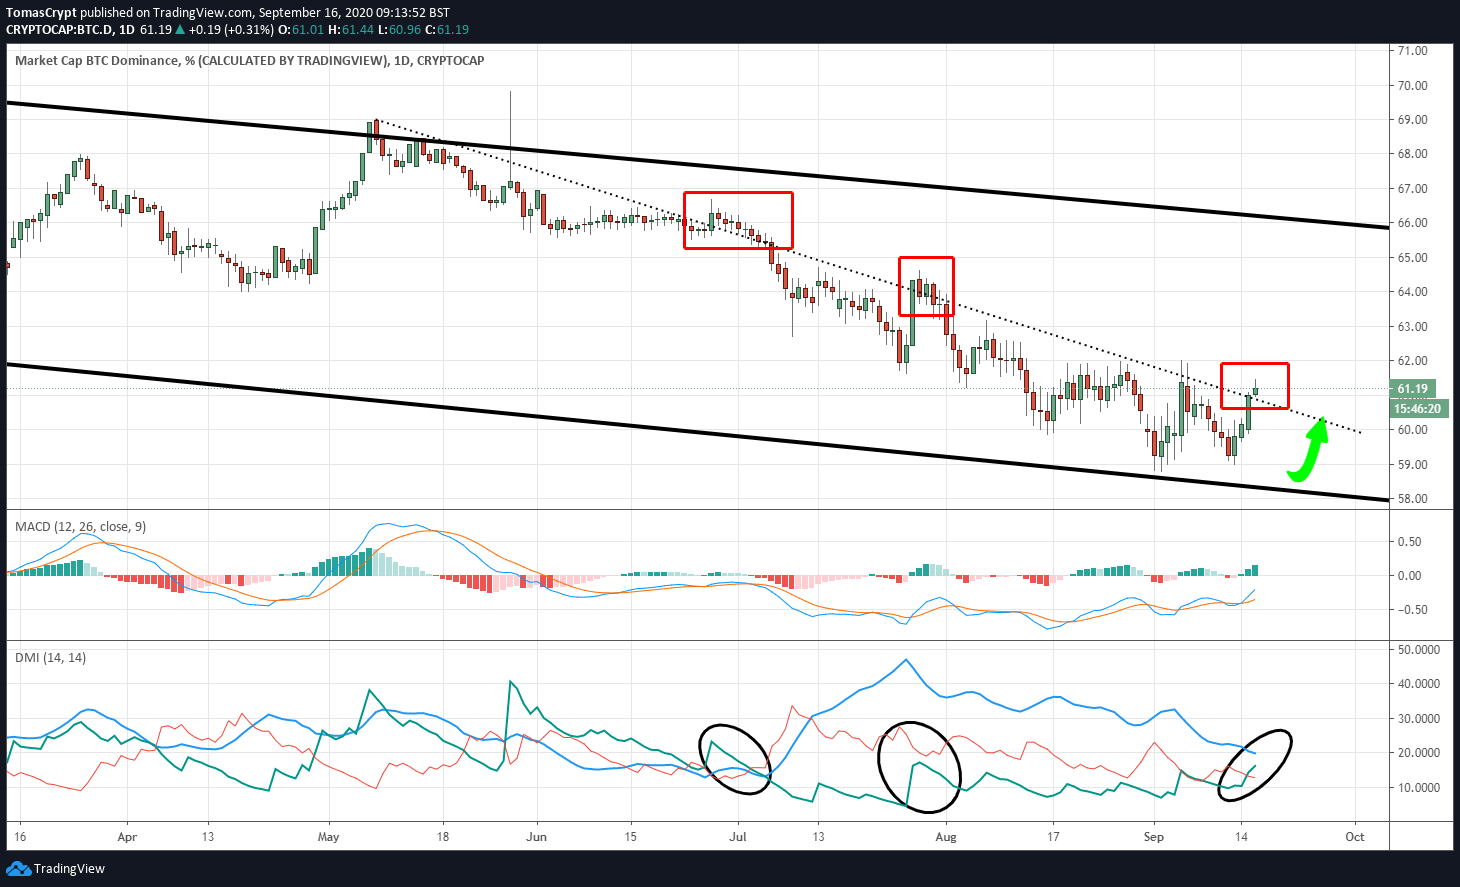
It is now trying it for the third time, and some considerations allow us to venture that this time the probabilities of success are high.
1- Living Space: The Bitcoin dominance chart moves through the lower zone of a wide bearish channel. The downward development of the chart is limited if you want to avoid entering dangerous price levels. Losing the floor of the bear channel would certainly mean losing the 50% market share level for Bitcoin, and a shift of capital to the Altcoin segment.
2- On the two previous occasions when Bitcoin has tried to break the upward trend line, the bulls (D+) were below the bear level (D-), and far from even having a chance of controlling the pair.
3- In the breakout that is confirmed today, there is an accompaniment from the buying side of the market. The D+ crosses the D- upwards and heads quickly towards the confirmation event, which would be to cross the ADX line. This event is the margin of doubt that remains to state more clearly that King Bitcoin has returned for his crown.
ETH/BTC Daily Chart
The ETH/BTC pair is currently trading at the price level of 0.0334 and shows the impact on the price of the force it is showing on Bitcoin.
Above the current price, the first resistance level is at 0.034, then the second at 0.035 and the third one at 0.0371.
Below the current price, the first support level is at 0.033, then the second at 0.0315 and the third one at 0.0307.
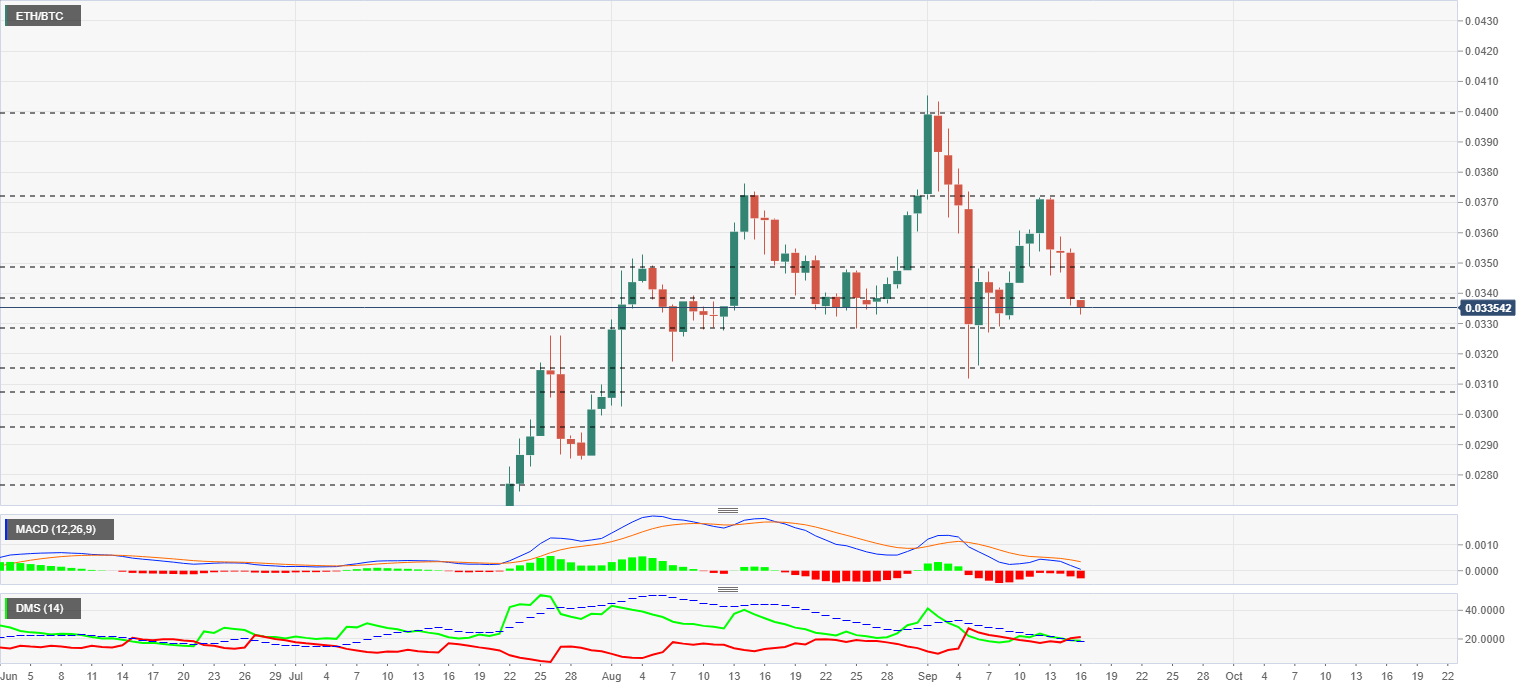
The MACD on the daily chart shows a bearish rejection of the last upward cut attempt. The fast-moving average is approaching the neutral level of the indicator, a key point to find support to stop the fall.
The DMI on the daily chart shows bears taking control of the pair, although at the moment there is not enough momentum to secure control of the pair for the sell-side.
BTC/USD Daily Chart
The BTC/USD pair is currently trading at $10919 and it is fighting in the European morning against price congestion resistance at $10950.
Above the current price, the first resistance level is at $10950, then the second at $11400 and the third one at $11920.
Below the current price, the first support level is at $10400, then the second at $10150 and the third one at $9800.
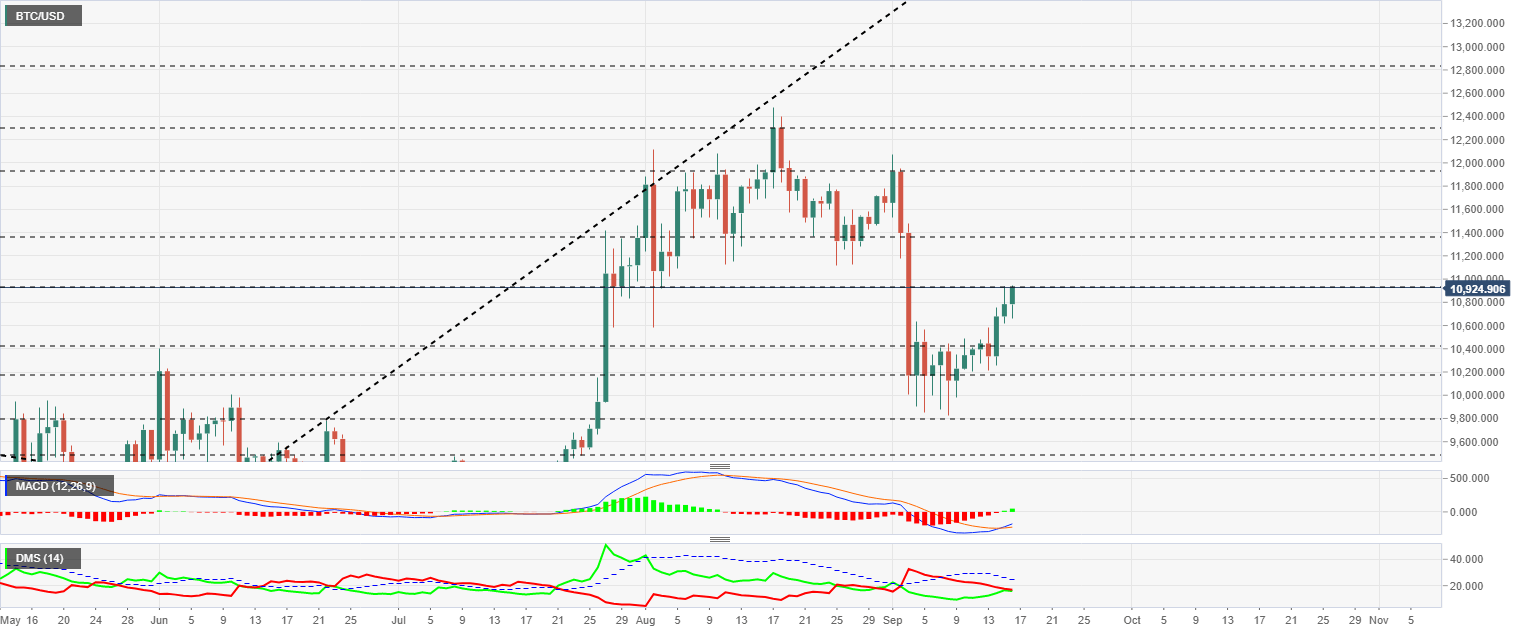
The MACD on the daily chart completes the bullish cross and takes on a robust configuration that confirms the potential for upward movement.
The DMI on the daily chart shows a borderline situation, with both sides of the market in full swing. The current structure may lead to increased volatility in the BTC/USD pair.
ETH/USD Daily Chart
The ETH/USD pair is currently trading at $365, lagging behind the Bitcoin but managing to hold on to its recent highs.
Above the current price, the first resistance level is at $380, then the second at $400 and the third one at $440.
Below the current price, the first support level is at $360, then the second at $330 and the third one at $315.
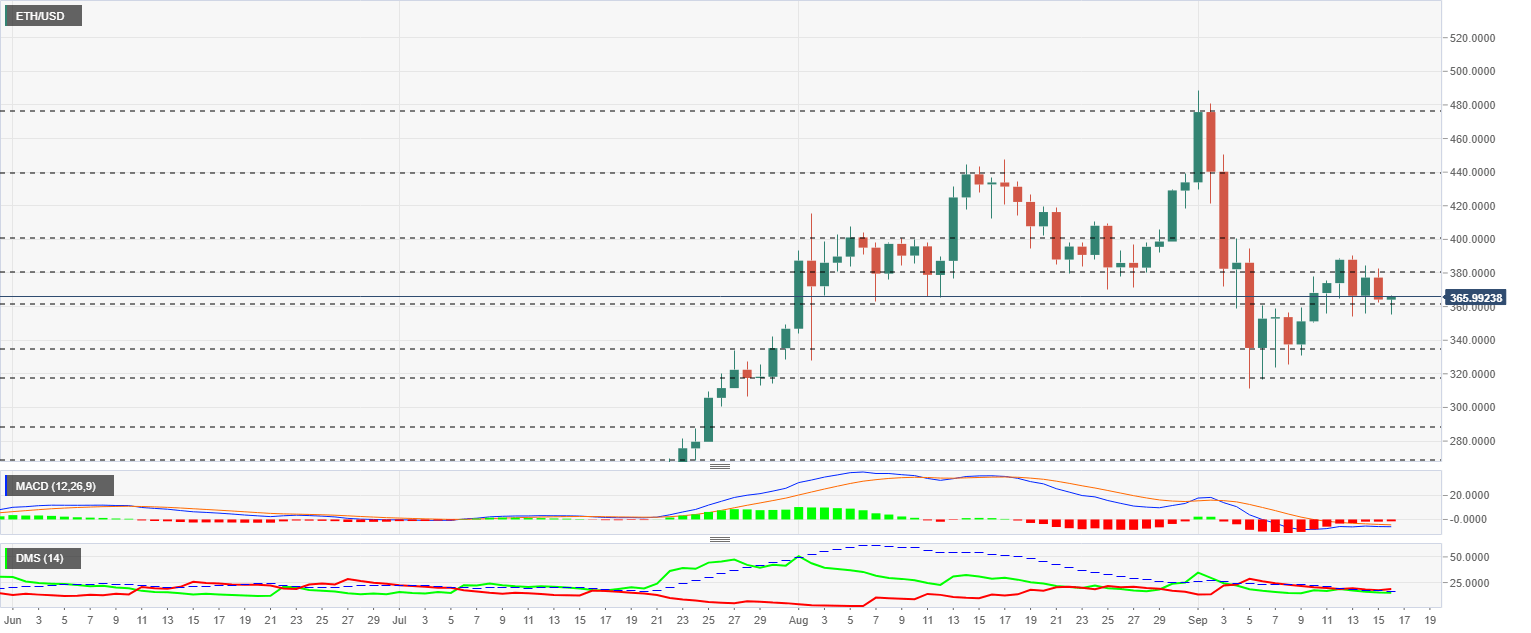
The MACD on the daily chart shows a very flattened profile, which complicates a possible bullish cross. This structure could require a violent move in the price to react to the upside.
The DMI on the daily chart shows the bears leading the pair but without a lead to make this control effective.
XRP/USD Daily Chart
The XRP/USD pair is currently trading at $0.244 and has been in the same range for the past two weeks.
Above the current price, the first resistance level is at $0.254, then the second at $0.262 and the third one at $0.277.
Below the current price, the first support level is at $0.235, then the second at $0.229 and the third one at $0.21.
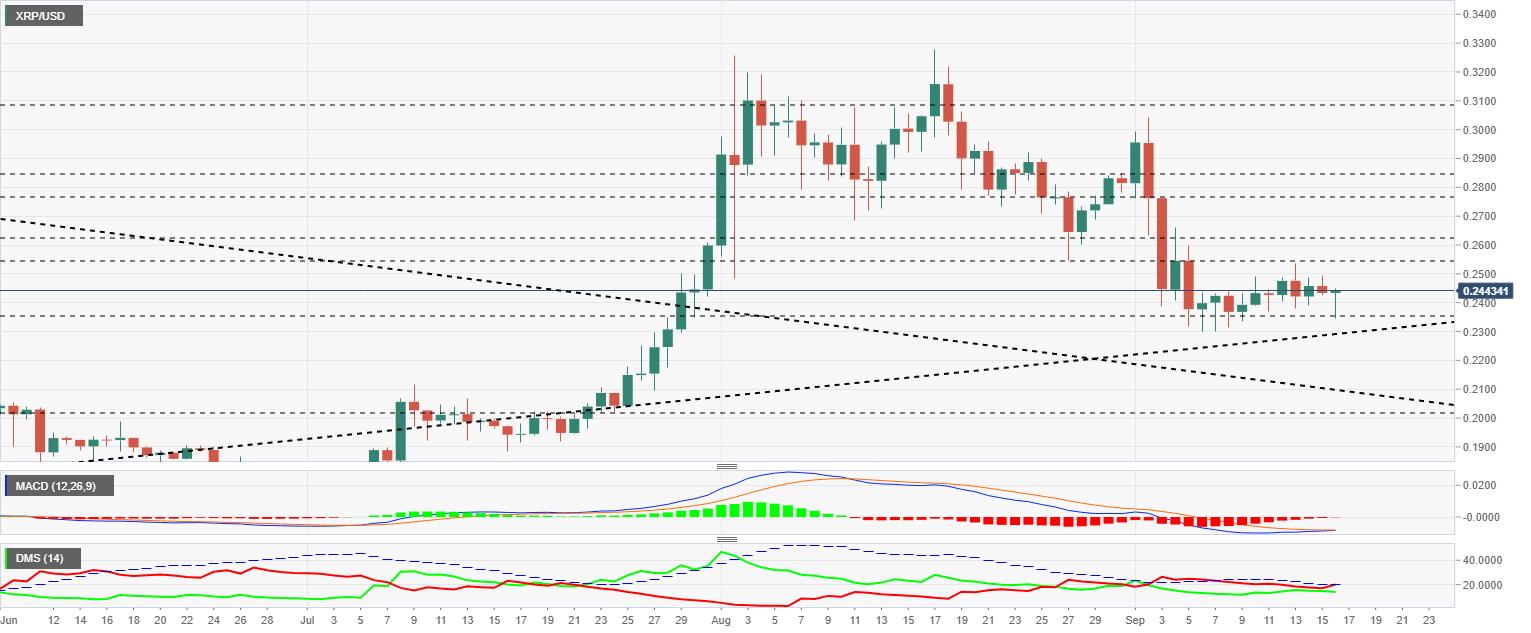
The MACD on the daily chart shows a bullish cross in progress. The slope is adequate for the success of the upward attempt.
The DMI on the daily chart shows the bears are climbing after approaching the buy-side. The bears will now attempt to break out of the ADX line, which if successful, will hurt the price rise expectations for the XRP/USD pair.
Author

Tomas Salles
FXStreet
Tomàs Sallés was born in Barcelona in 1972, he is a certified technical analyst after having completing specialized courses in Spain and Switzerland. He expanded his technical training following the guidance of great experts on the financial markets.


