Top 3 Price Prediction Bitcoin, Ether, Ripple: Bullish bursts in the midst of the dark space
- Bitcoin, Ether and XRP show positive signs and step down from the global sell-off.
- The cliffs of hell are still close, so there might be some selling aimed at shaking off the weak hands.
- Crypto could begin to move up at the end of this week.

The terrible situation facing the social and economic system on a global scale is bringing the financial markets to the brink of collapse. At this moment, it is impossible to predict when Wall Street will stop falling, as the charts have a verticality never seen before.
The technical indicators of the equity, bond and commodity markets have reached such extreme levels, the speed is so high, that supports are being easily drilled and entering worse and worse scenarios.
The impact on the cryptocurrency segment has also been devastating. The Top 3 components have lost the bullish scenario created after the long winter of 2018 and 2019 but avoided from falling into the worst-case scenario for the time being.
It is significant how, after the first wave of selling, Bitcoin, Ether and XRP are holding up the rate much better than other quoted markets.
The bullish reaction that started on Friday didn't have much of a run, as I explained in the morning article. Still, the price develops following technical price analysis theory and not driven by panic.
The day leaves us with an important fact from the structural point of view of the crypto board. Yesterday the ETH/BTC reached the SMA200 in the daily range, and today it is rising in green on this critical arithmetic average. In the medium and long term, this critical support must hold, and from this point on prices will take traction and develop the next uptrend.
The cryptocurrency market is still alive and now has the opportunity to stand out from the unhappy situation of other quoted markets.
ETH/BTC Daily Chart
The ETH/BTC pair is currently trading at 0.02108 and is regaining the SMA support it lost on Saturday. The bearish consolidation structure could end later this week.
Above the current price, the first resistance level is at 0.022, then the second at 0.025 and the third one at 0.0268.
Below the current price, the first support level is at 0.021, then the second at 0.020 and the third one at 0.018.
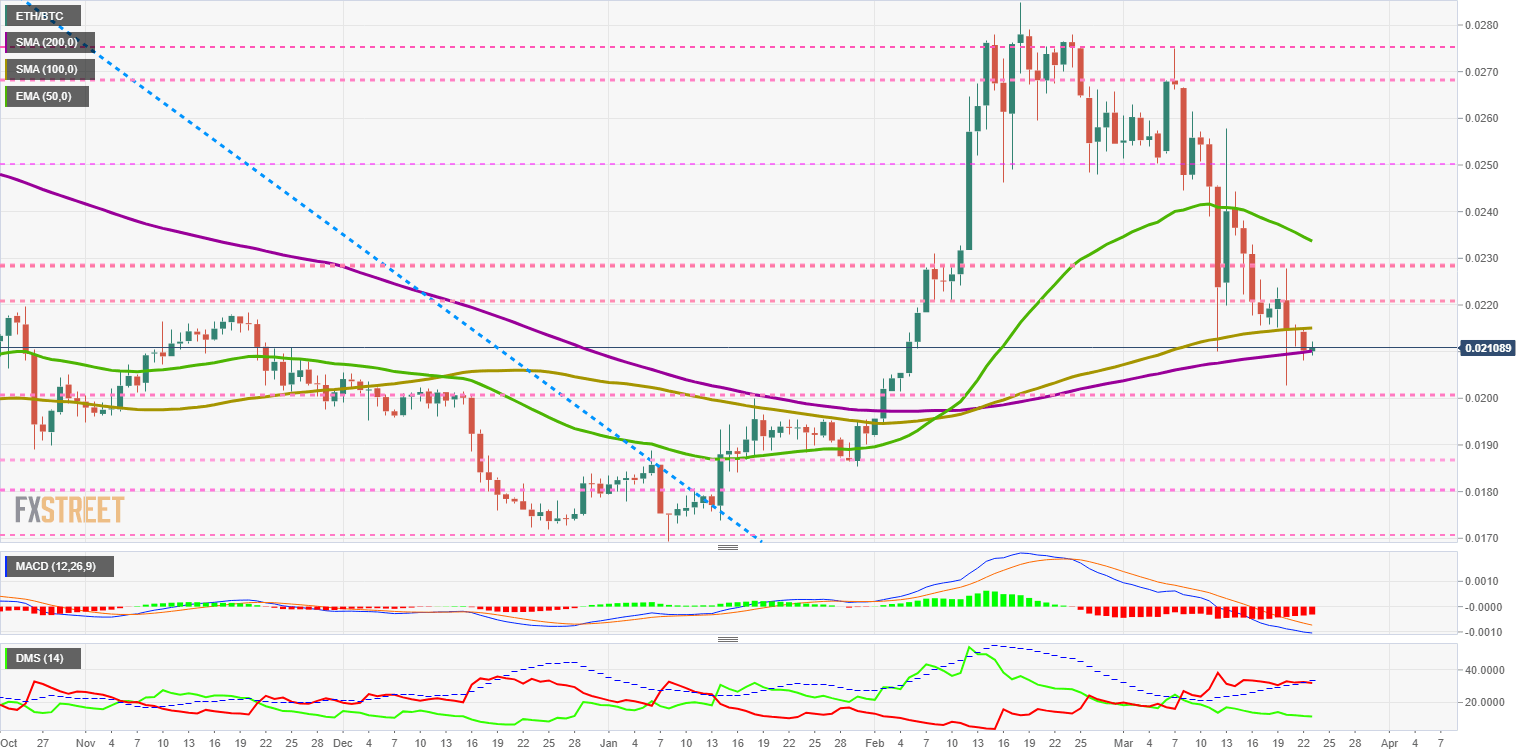
The DMI on the daily chart shows the bearish bears drilling down the ADX line, ending the previous bearish momentum. The bulls are not reacting at the moment, suggesting caution in the short term.
BTC/USD Daily Chart
The BTC/USD pair is currently trading at $5815 after touching $7000 late last week. The current structure is one of consolidation after the recent upward movement. BTC/USD is now in the middle of the ultra long-term bearish channel, equidistant between the moon and hell.
Above the current price, the first resistance level is at $5900, then the second at $6200 and the third one at $6500.
Below the current price, the first support level is at $5500, then the second at $5100 and the third one at $4900.
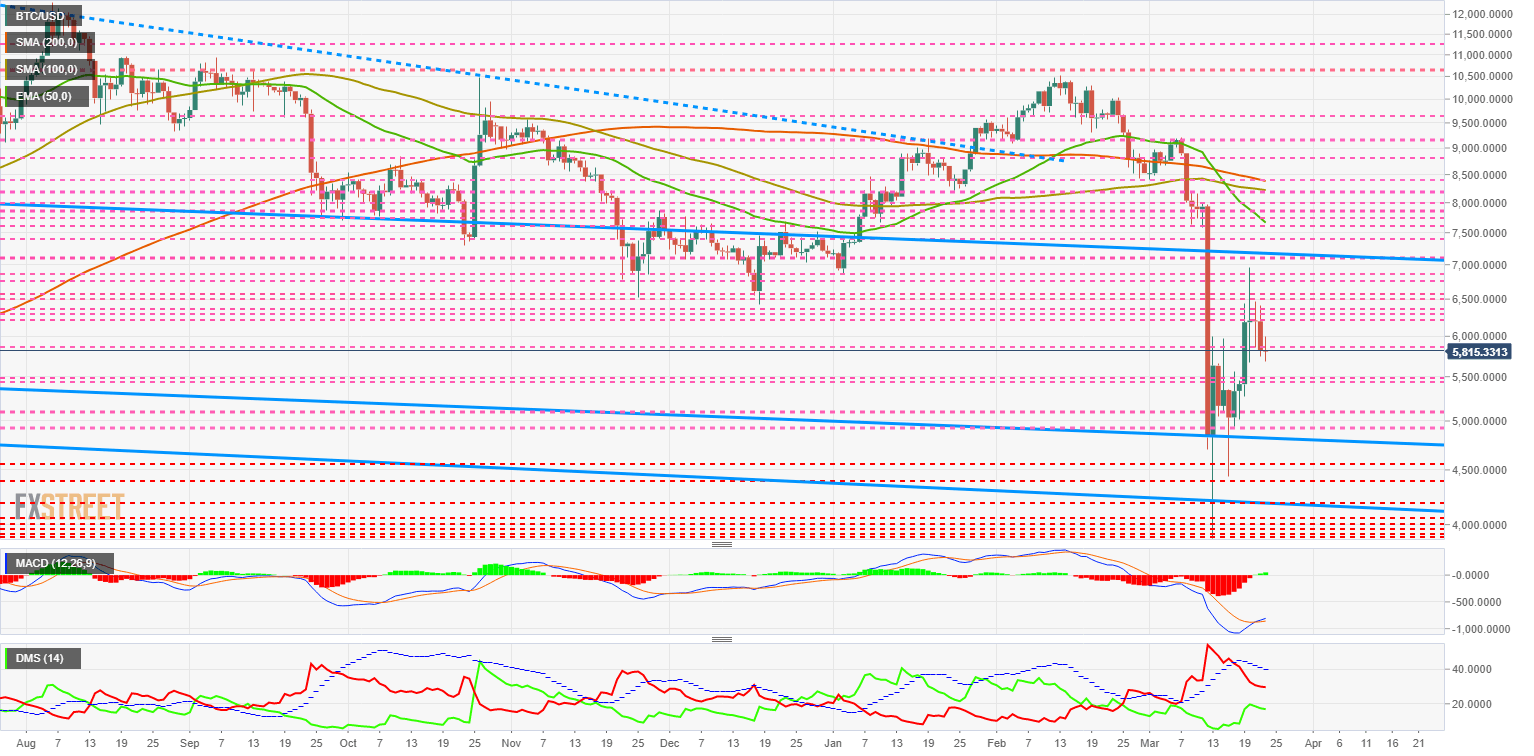
The DMI on the daily chart shows that the bears are losing strength quickly, as fast as the bulls are reacting to the upward movement. The structure proposes a progressive improvement in the price structure.
ETH/USD Daily Chart
The ETH/USD pair is currently trading at the price level of $122.5 and shows a consolidation structure following recent increases. The short-term outlook shows an attraction at the confluence of the moving averages, at the price level of $180.
Above the current price, the first resistance level is at $130, then the second at $140 and the third one at $150.
Below the current price, the first support level is at $120, then the second at $115 and the third one at $120.
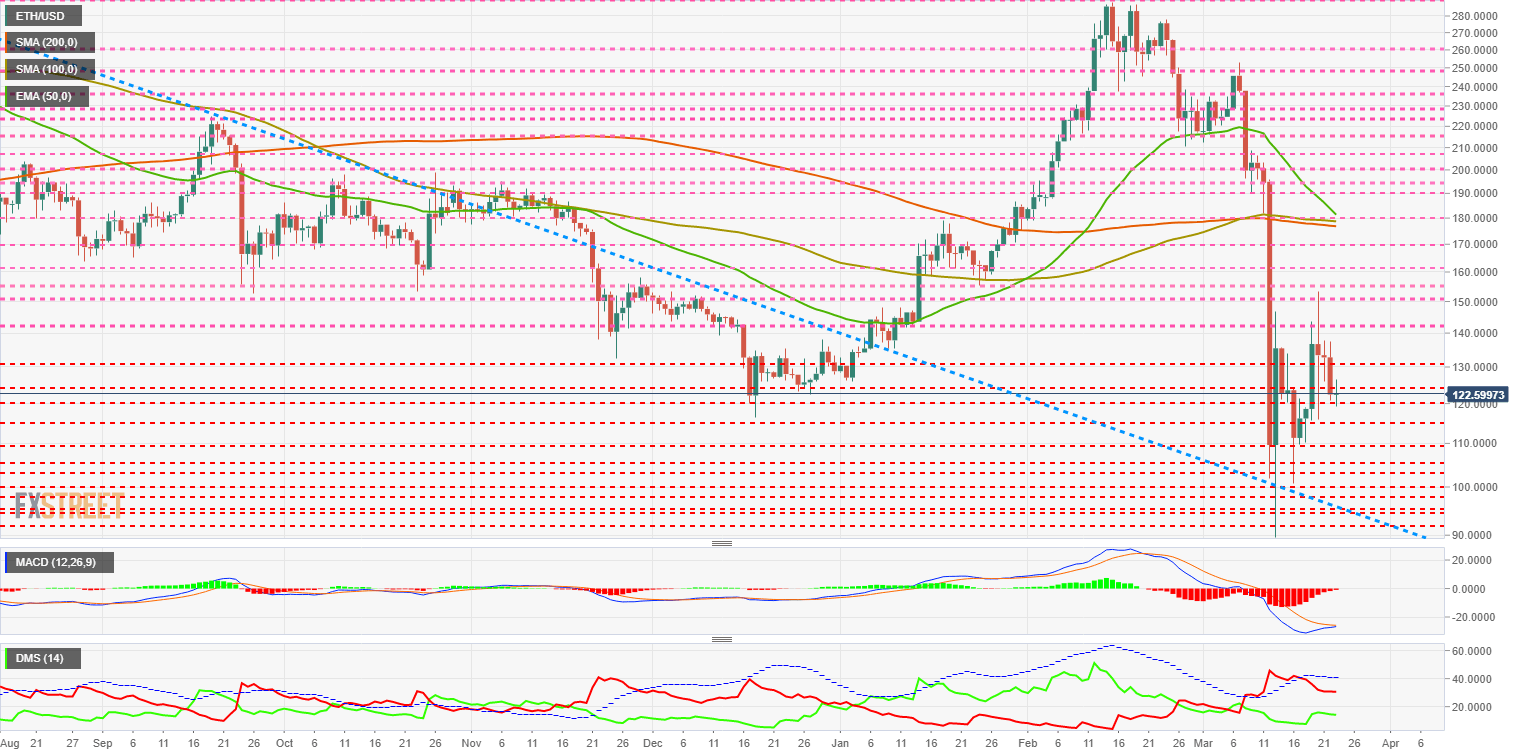
The DMI on the daily chart shows bears losing strength, although less so than in BTC/USD. The bulls are reacting bullishly, but still far from being able to challenge the bears for the lead.
XRP/USD Daily Chart
The XRP/USD pair is currently trading at a price level of $0.1487 XRP's setup is not as positive as its peers in the Top 3 cryptocurrencies, but technically it is consolidation after the upward movement.
Above the current price, the first resistance level is at $0.17, then the second at $0.19 and the third one at $0.20.
Below the current price, the first support level is at $0.14, then the second at $0.132 and the third one at $0.128.
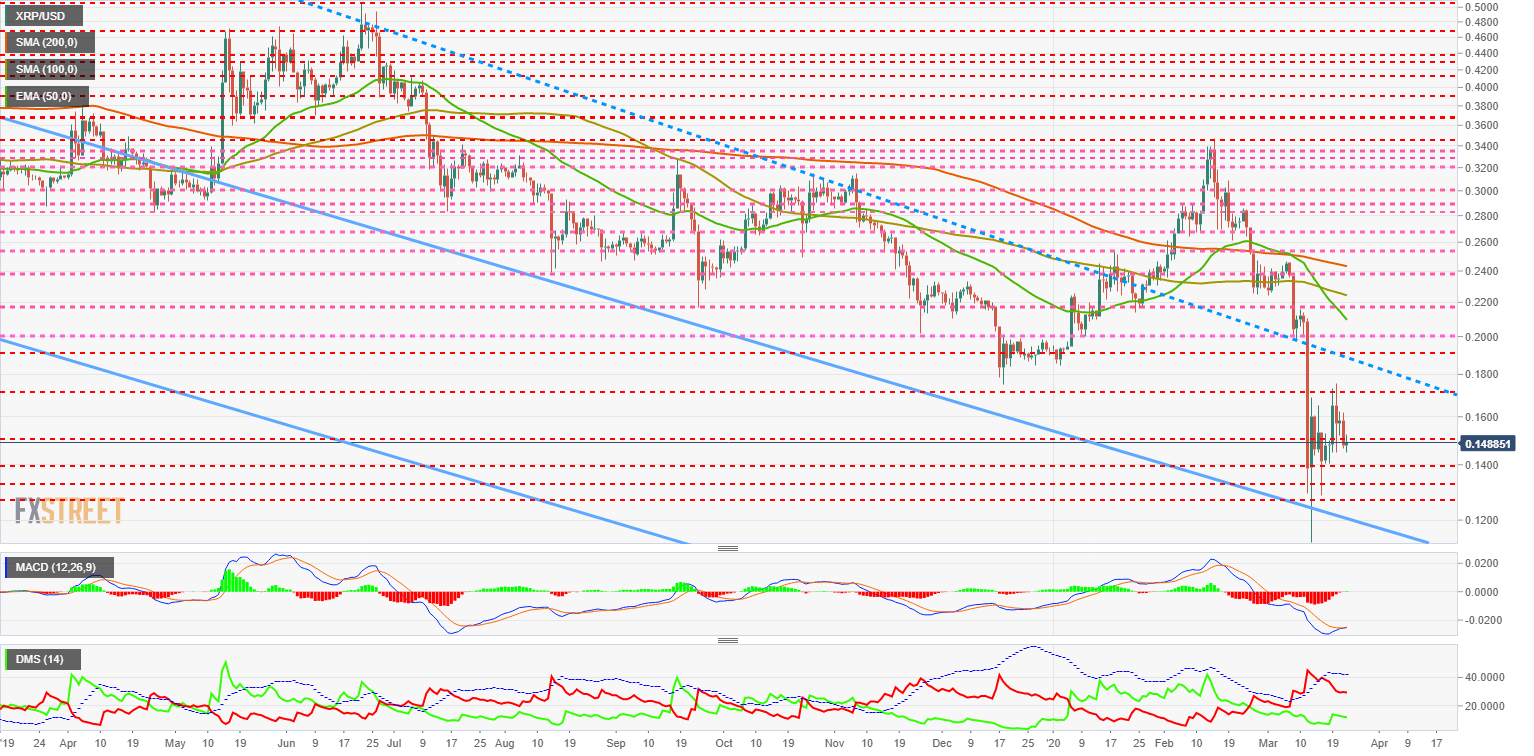
The DMI on the daily chart shows the same technical structure as the Bitcoin or Ether. The current technical pattern usually develops with a bullish crossing attempt by the bulls, although this crossing is often not achieved on the first attempt.
Author

Tomas Salles
FXStreet
Tomàs Sallés was born in Barcelona in 1972, he is a certified technical analyst after having completing specialized courses in Spain and Switzerland. He expanded his technical training following the guidance of great experts on the financial markets.


