Top 3 Gainers Of The Week Verge, Cardano, VeChain: Shrug-off the broad corrective trend
- Verge charts a golden cross, up 40% on the week.
- Cardano looks north amid a bullish technical setup.
- VeChain buyers seize control amid bullish crossover.

Crypto markets witnessed massive volatility over the past week, marked by the stellar performance in Bitcoin, closely followed by the altcoins. Among the top 50 widely-traded digital assets, Verge, Cardano and VeChain emerged as the top performers (in that order), with Verge having recorded about 40% weekly gain.
Let’s take a look into the technical charts of these three coins, as they have bucked the corrective trend seen across the crypto space.
Verge: Path of least resistance is up
The 48th most widely traded token, Verge (XVG), extends its consolidation into a third straight session following the correction from the highest levels since June 2019 reached at $0.0109 last Wednesday. Despite the retracement, the coin remains on track to book a whopping 41% weekly gain.
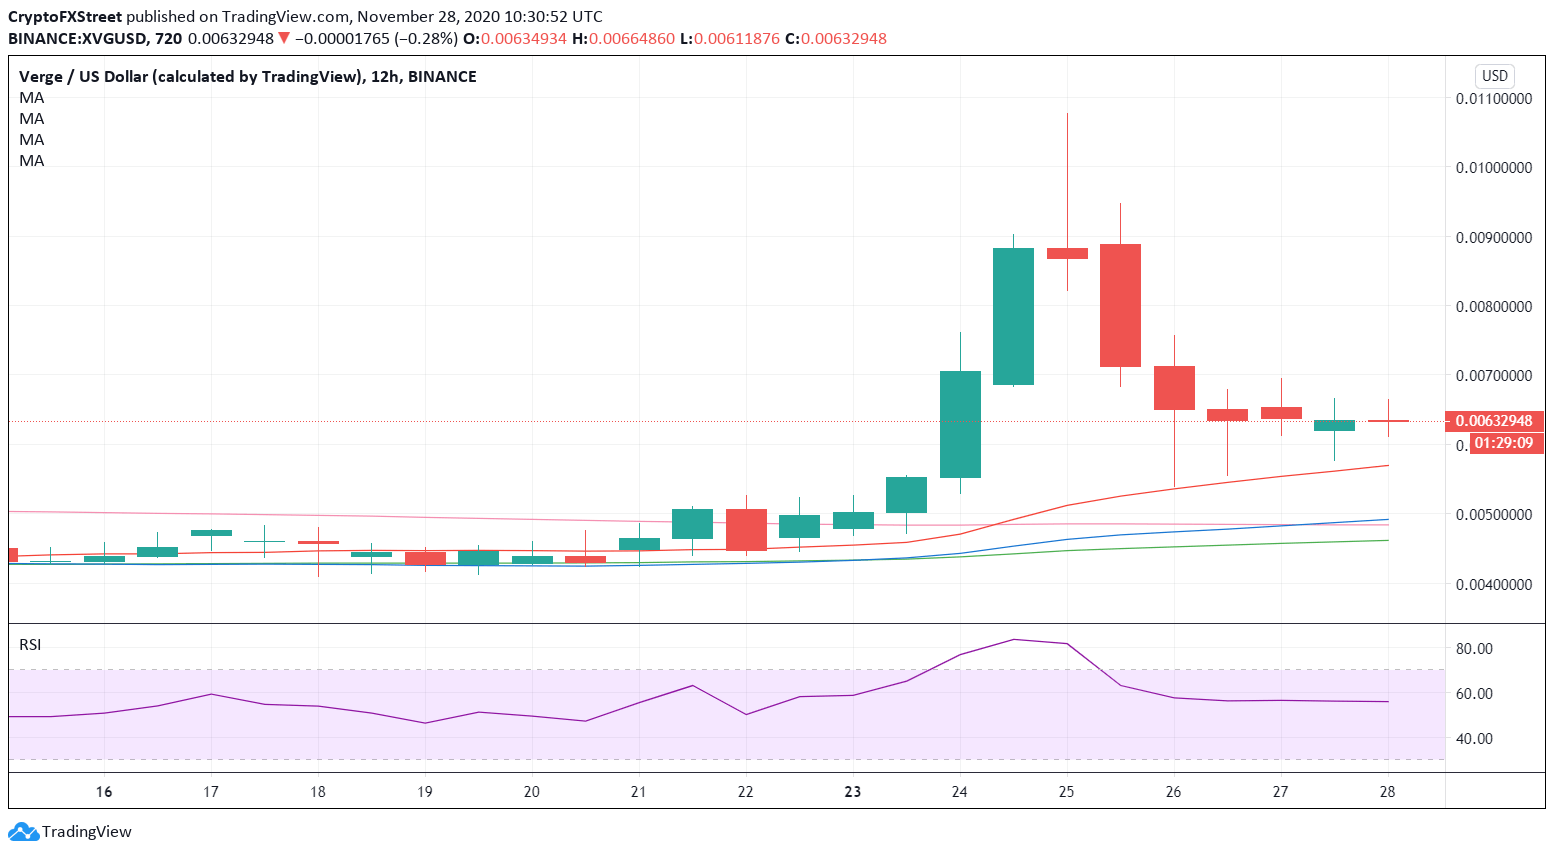
XVG/USD: 12-hour chart
The corrective decline from multi-month highs stalled at the 200-day simple moving average (SMA), keeping the buyers hopeful. Meanwhile, on the 12-hour chart, the spot has confirmed a golden cross after the 50-SMA cut the horizontal 200-SMA from below. The bullish crossover combined with the Relative Strength Index (RSI) holding above 50.00, indicate that the further upside remains likely. Therefore, a test of the $0.01 likely remains on the cards. Additionally, XVG/USD trades above all the major averages, adding credence to the upside. Alternatively, the 100-SMA support at $0.0046 is the level to beat for the bears.
Cardano: Triangle breakout calls for a fresh rally
Cardano is the sixth most favorite coin out of the top 50 and emerges as one of the top three weekly gainers, eyeing about 15% rise on the week. The coin resumes its bullish momentum, having stalled its correction from two-year highs of $0.1834 reached earlier this week.
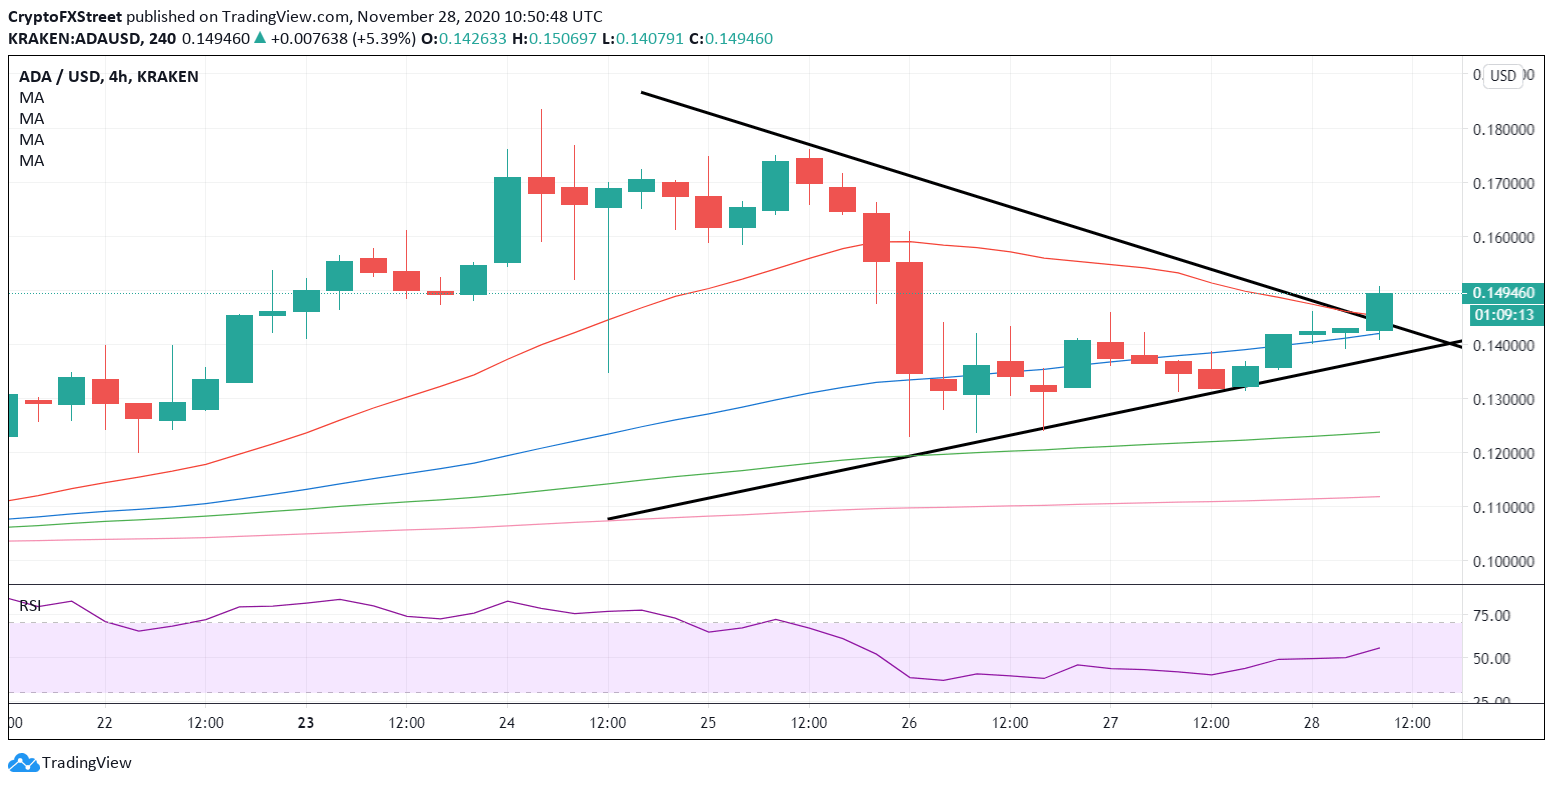
ADA/USD: Four-hour chart
As observed in the four-hour chart, the ADA/USD pair has spotted a symmetrical triangle breakout after closing the candle above the falling trendline resistance at $0.1440. The price has recaptured all major SMAs, as it heads towards the pattern target measured at $0.1960. However, the pattern will get invalidated if the price yields a four-hourly close below the rising trendline (pattern) support at $0.1377. The RSI points north, at 55.80, while the coin trades at $0.1494, as of writing.
VeChain: Further upside in the offing
VeChain (VET/USD) is looking to recover ground near $0.0145 following wild swings witnessed in the previous sessions. The No. 20 coin trades within Friday’s doji candle and remains poised to rise 12% on a weekly basis.
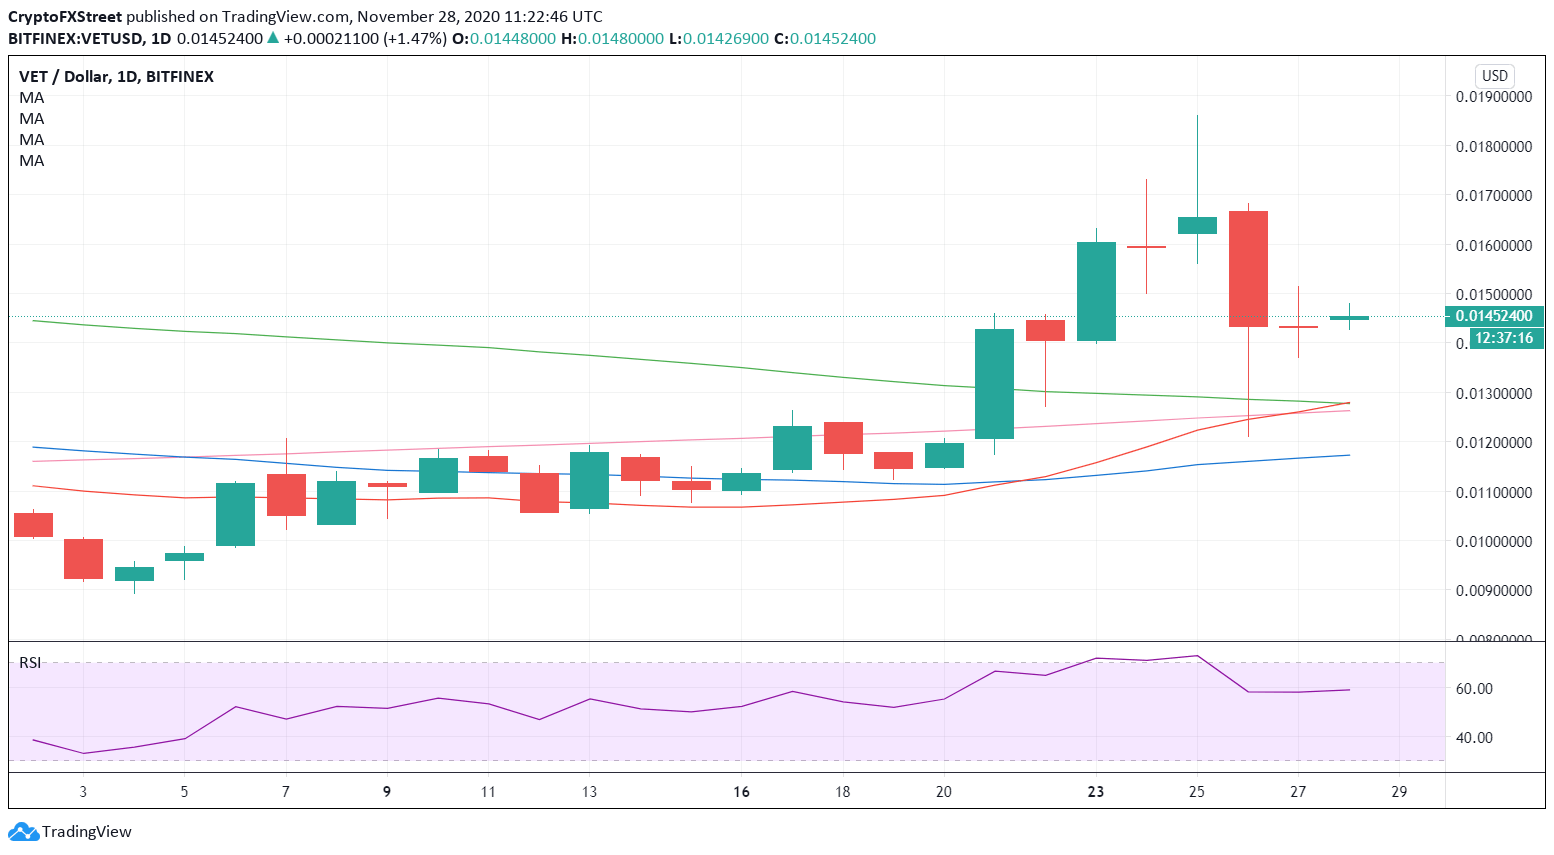
VET/USD: Daily chart
VeChain’s daily chart points to likely a bullish reversal after Friday’s doji candle, which suggested that the bears faced exhaustion after Thursday’s sharp correction to $0.0120 from three-month highs of $0.01861. Also, supporting the case for the bullish shift in the sentiment, the chart depicts a bullish crossover, with the 21-day SMA having pierced the 100-day SMA from below. Meanwhile, the RSI trades flat but holds above the 50.00 level, allowing room for more upside. Therefore, Friday’s high of $0.0151 is critical for the bulls to regain control and resume the recent uptrend. To the downside, Friday’s low of $0.0137 will be a tough nut to crack for the sellers.
Author

Dhwani Mehta
FXStreet
Residing in Mumbai (India), Dhwani is a Senior Analyst and Manager of the Asian session at FXStreet. She has over 10 years of experience in analyzing and covering the global financial markets, with specialization in Forex and commodities markets.


