Top 3 Coins Price Prediction Bitcoin, Ethereum and Ripple: BTC enters a consolidation period
- The realized correlation between Bitcoin and gold has a one-year high this Monday.
- Analysts believe that fall in DeFi prices could result in a correction in Bitcoin.
- Ethereum (ETH) balance on digital exchanges has dropped to a nine-month low.

Bitcoin
Correlation between gold and BTC reaches a one-year high
The realized correlation between Bitcoin and gold has reached a one-year high, according to Skew. The strengthening correlation between the two assets could indicate that more investors are viewing BTC as a store of value.
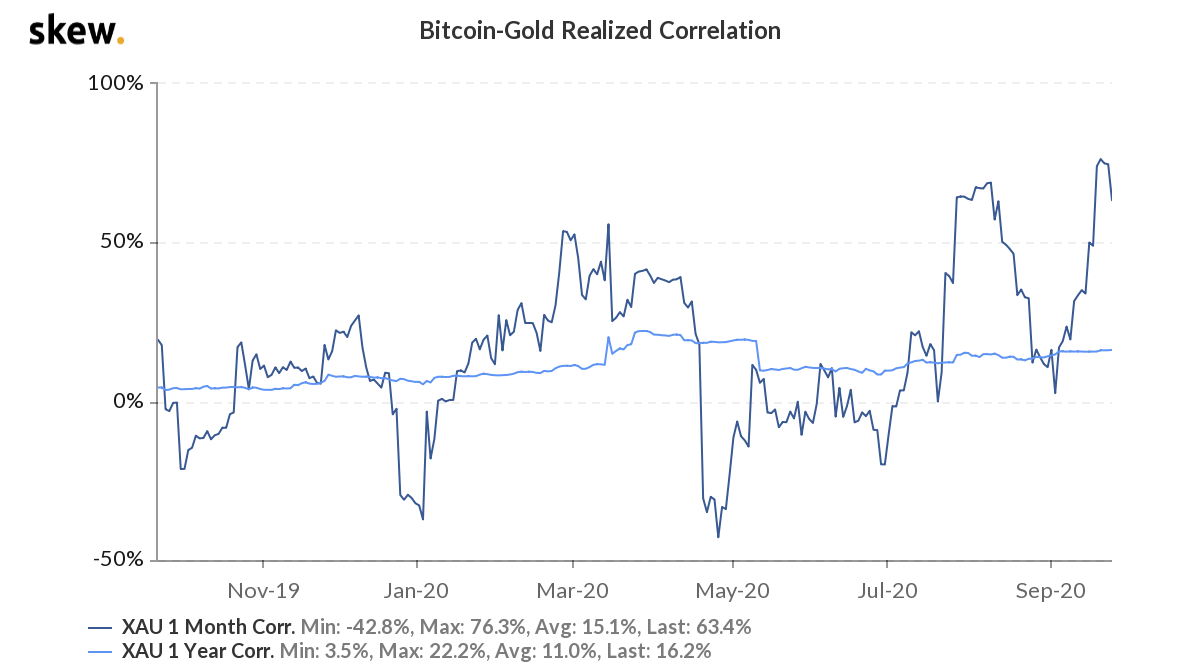
Gold has historically been perceived as a safe-haven asset and a go-to store of value in a fight against inflation. Amidst the economic fallout caused by the pandemic, the demand for safe-haven assets has continued to surge. As a result, gold’s value has consistently increased, outperforming many traditional assets this year.
The uptrend between Bitcoin and gold is a positive sign for BTC. The correlation between the coin and gold has caused an improvement in the sentiment around BTC from institutions. According to an earlier FXStreet report, business intelligence firm MicroStrategy purchased $425 million worth Bitcoin.
As per a U.Today report, Tyler Winklevoss, the co-founder of Gemini, argued that BTC could eventually outcompete gold.
It’s true that gold has a multi-millenia head start and strong foundation of trust. As a result, it may be the right short to medium-term choice for risk-averse types. After all, Bitcoin is still young and therefore carries both significant technological risks as well political risk in certain jurisdictions. Nonetheless, we believe that bitcoin will continue to cannibalize gold and that this story will play out dramatically over the next decade.
Analyst predicts corrections in DeFi tokens to impact Bitcoin
Many decentralized finance (DeFi) coins have been undergoing substantial corrections in recent times. Industry analysts believe that this could result in a correction in Bitcoin. One of the notable DeFi projects, Yearn.finance (YFI), has slid over 35% from its earlier all-time highs. Coins like Aave’s LEND and Synthetix’s SNX have also dropped in the past few days as selling pressure mounts after a parabolic rally.
Analysts seem to think that the weakness in DeFi may not reflect well for BTC and other top digital assets. According to a Bitcoinist report, a trader said:
$YFI tanking a little, used is as a proxy for DEFI in general since it’s the billion+$ cap and OG coin. Tend to think DEFI doing bad is not good for $BTC since it’s a sphere which brought big investments into $Crypto past months. Would keep an eye, on $ETH as well, get a vibe.
Many experts remain long-term bullish on DeFi. Qiao Wang, former Messari head of product and a crypto trader, recently commented:
From an investment point of view, BTC pre-2013 and ETH pre-2015 were once-in-a-lifetime asymmetric bets. DeFi pre-2021 is once-in-a-decade IMO (until proven wrong). If you’ve missed the first two don’t miss the latter.
BTC/USD daily chart
-637364164362424303.png)
BTC has bounced up from the $10,415 support line following two straight bearish days and bounced up to $10,511.30. Currently, the price has encountered resistance at the SMA 20 curve. The 20-day Bollinger band has been squeezing since 13th September. Squeezes are indicative of low volatility periods and are usually succeeded by significant price movements. The longer the squeeze, the higher the probability of a strong breakout.
So, as of now, it looks like the price will trend horizontally as BTC enters a period of consolidation. The IOMAP further corroborates this.
BTC IOMAP
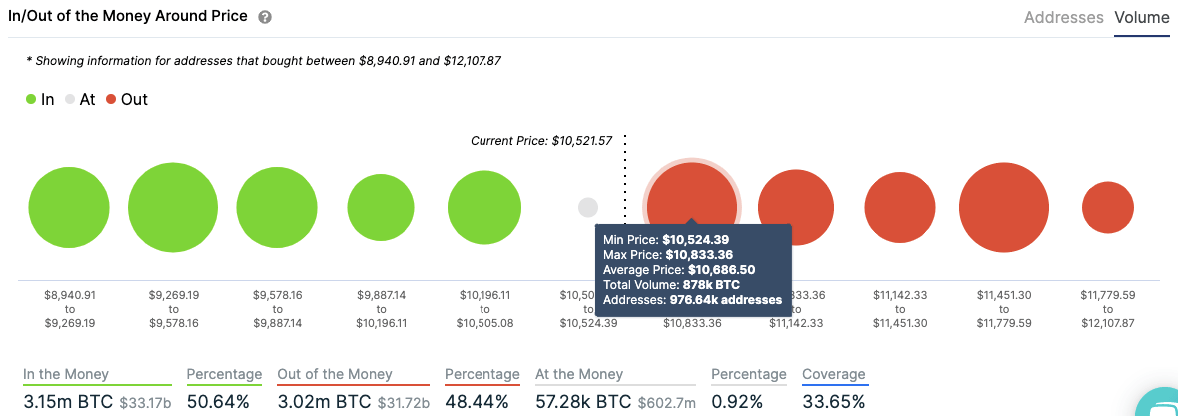
IntoTheBlock’s “In/Out of the Money Around Price” (IOMAP) model estimates that BTC is sandwiched between strong resistance and support levels. On the upside, the premier cryptocurrency faces a strong resistance wall at $10,650, where a little over 960,000 addresses had purchased around 875,000 BTC.
On the downside, BTC has a healthy support wall at $10,365, where around a million addresses had bought 556,000 BTC. As such, further price movement in any direction may be limited.
Ethereum
On-chain ETH fundamentals hit new lows
Ethereum (ETH) balance on online exchanges has recently dropped to a nine-month low, according to blockchain analytics firm Glassnode. Additionally, the number of ETH wallets and other on-chain fundamentals have also plummeted.
#Ethereum $ETH Balance on Exchanges (1d MA) just reached a 9-month low of 16,583,339.932 ETH
— glassnode alerts (@glassnodealerts) September 20, 2020
Previous 9-month low of 16,583,645.541 ETH was observed on 21 December 2019
View metric:https://t.co/1dCpD2ey8E pic.twitter.com/N5QgBVM0Vm
According to another tweet by Glassnode, the amount of ETH wallets where users store 1,000 ETH or more has seen a significant two-year drop.
#Ethereum $ETH Number of Addresses Holding 1k+ coins just reached a 2-year low of 7,218
— glassnode alerts (@glassnodealerts) September 21, 2020
Previous 2-year low of 7,219 was observed earlier today
View metric:https://t.co/iDNXAbbLRt pic.twitter.com/hmKQtttjvr
The smart contract market leader's mean transaction volume has also decreased substantially in recent times. Despite the adverse reports mentioned above, Glassnode also shared some good news about ETH. The number of non-zero ETH wallets has increased to a new all-time high of 47,185,555.
#Ethereum $ETH Number of Non-zero Addresses just reached an ATH of 47,185,555
— glassnode alerts (@glassnodealerts) September 20, 2020
Previous ATH of 47,182,473 was observed earlier today
View metric:https://t.co/beS1MtIgAZ pic.twitter.com/iROjPw50LC
Furthermore, the number of ETH wired to cryptocurrency exchanges has surged in the past few days. However, since ETH exchange balances are declining, users may be sending their ETH to DeFi and locking them in smart contracts for yield farming.
ETH/USD daily chart
-637364165633778085.png)
ETH/USD has formed a head-and-shoulders pattern, with the price going up from $340.35 to $343.15 this Tuesday. This pattern is a formation that appears as a baseline with three peaks, the outside two are close in height and the middle is highest. This usually predicts a bullish-to-bearish trend reversal.
Going by the pattern, the price will probably break below the $337 support line and drop to $320. The relative strength index (RSI) is trending around the neutral zone, so the bears have plenty of space to take control.
ETH IOMAP
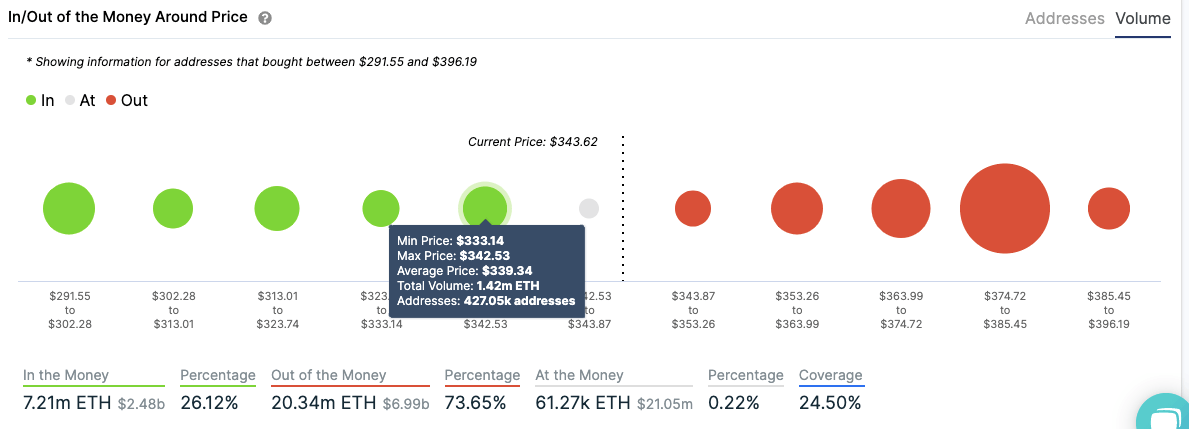
ETH is sitting on top of moderate and weak support walls. The immediate support wall is at $337.50 where 427k addresses have bought a little over 1.4 million ETH. The bears will conquer this level with ease. Following that, the drop in price could be catastrophic. The next moderate support level is all the way down at $295.
However, on the flip side, there is some upside potential if the buyers somehow take back control. The price is sitting below weak resistance at $348, which has around 225k addresses with around 690k ETH. Following that, there is a moderate resistance wall at $358.
ETH on-chain
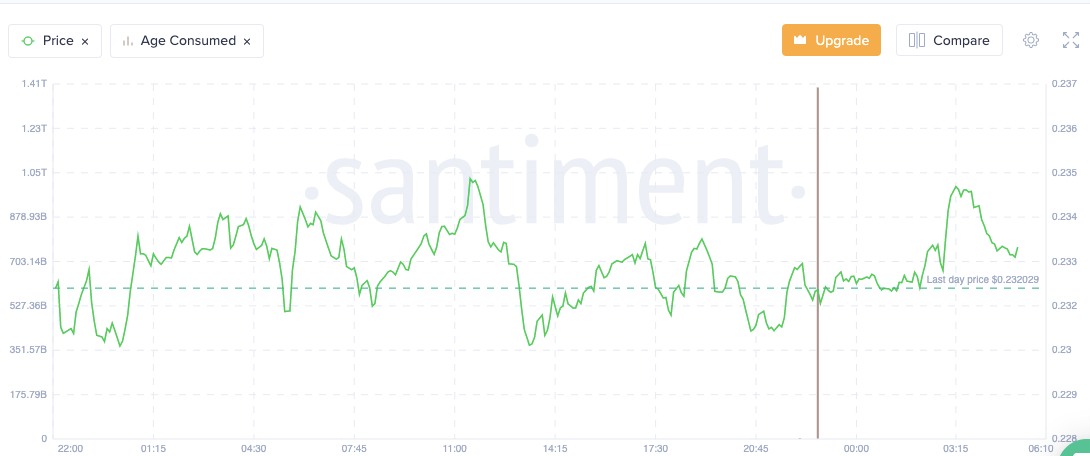
#1 Age consumed
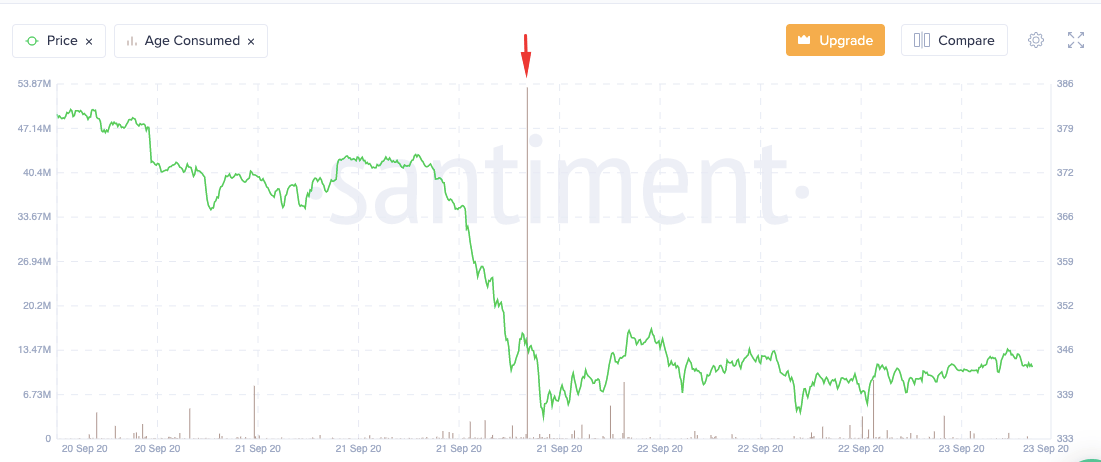
Santiment’s age consumed is a helpful metric that helps us know if the price is going to experience any sharp movement or not. The trend could be either positive or negative. Less than 48 hours ago, a sharp spike in the age consumed chart saw the price go down.
#2 Development activity
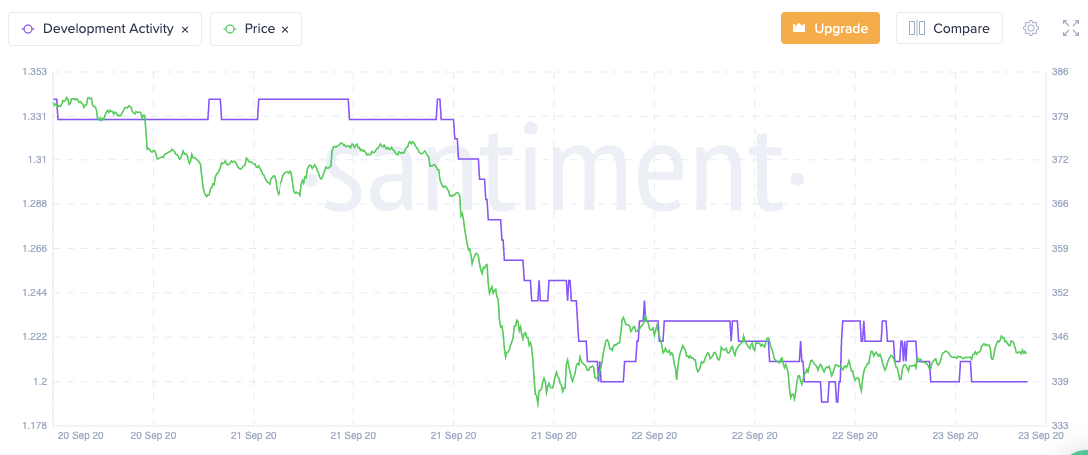
Sanbase’s on-chain metric shows that the price and development activity patterns are following each other too closely. There was a sharp decline in dev activity on 21st September, which triggered a sharp drop in price as well. Since then, both the charts have been pretty much neck and neck.
Ripple
XRP all set to enter its bull rally – Analyst
A well-known analyst who goes by the name “Credible Crypto” said that XRP is set to enter its long-awaited bull rally.
It's time. $XRP pic.twitter.com/G0WMIiKi6L
— Credible Crypto (@CredibleCrypto) September 18, 2020
While the analyst is bullish on XRP, they opine that both Ethereum (ETC) and Bitcoin (BTC) have more downside potential. Crypto Credible believes that BTC will drop below $10,000 before it breaks a critical resistance level.
Upper gap filled. Are gap fills "required"? No. Do I think we are going to fill the lower one soon? Yes. When? Before we break the local highs at 12k. $BTC https://t.co/NRD8RHuB17 pic.twitter.com/zi129uQK2N
— Credible Crypto (@CredibleCrypto) September 14, 2020
The analyst is also keeping close tabs on the ETH/BTC pair as it approaches the price target that they had predicted.
The ETH/BTC pairing is progressing beautifully to the target I outlined in my last Youtube video on $ETH. While my ultimate target for ETH/BTC is lower still, I suspect we may see some relief in the coming days. If $BTC can hold 10.5-10.6k, we may see some relief on ETH/USD also. pic.twitter.com/AX6woUHwq5
— Credible Crypto (@CredibleCrypto) September 16, 2020
XRP/USD daily chart
XRP/USD followed BTC and ETH and also had a bullish Tuesday following two straight bearish days. Since 17th August 2020, the price has been steadily decreasing, charting lower highs and lower lows.
-637364167778466902.png)
The RSI is trending right at the edge of the oversold zone. As such, the price may dip a bit more before the buyers step in to correct the price. Technical analysis shows us that the cross-border payment coin may drop further to the $0.22 support line before it experiences a reversal in fortunes.
XRP on-chain
Age consumed
As per Sanbase, there has been a sharp spike in the age consumed chart this Tuesday. This spike caused an immediate climb in price, which was followed by a quick drop. It will be interesting to see the final price trend that gets triggered by this spike. According to what we learned before, this will probably be a bearish trend, which pushes the price into the undervalued zone.
Key levels
Author

Rajarshi Mitra
Independent Analyst
Rajarshi entered the blockchain space in 2016. He is a blockchain researcher who has worked for Blockgeeks and has done research work for several ICOs. He gets regularly invited to give talks on the blockchain technology and cryptocurrencies.


