Top 10 Cryptocurrencies: Technical levels to watch after the storm

Since the COVID-19 pandemic took over the world in 2020, a lot has happened within the crypto community, and a lot is still happening, considering that there has been a heightened global interest in cryptocurrency, and even some altcoins that no one thought would get any value, have proven otherwise.
Bitcoin (BTC/USD)
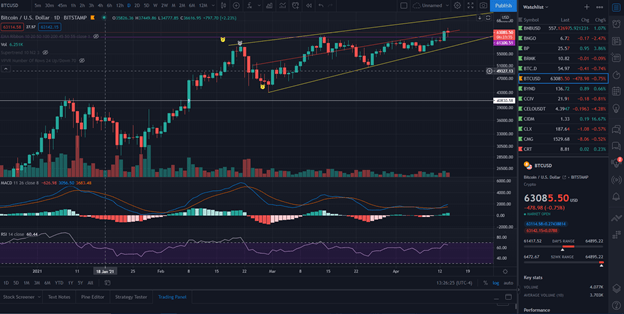
Bitcoin has had a breakout above $63,500 and is seeing some resistance at $64,000. With the MACD trading above the zero line, it is clear to see that the trend is bullish. According to the RSI oscillator that is hovering at the 70 level, it is safe to say that it is overbought. Interestingly, the RSI has continued to experience a downward trend with candles finding support at the $62,400 level.
BTC Daily Chart:
- Staying in the yellow (rising wedge pattern) and is seeing resistance at the $64,000 level which is also the smaller resistance (red line) but at the same time found support off the previous high ($61,283).
- MACD is trading above zero line so that a bullish sign.
- RSI also hovering around 70 level meaning the asset is somewhat overbought.
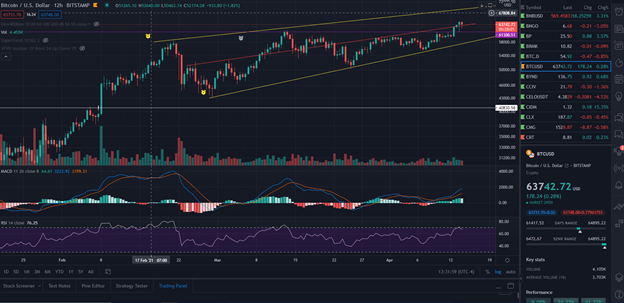
BTC 12 Hour Chart:
- Confirmed break out above Red resistance ($63,500 level) and is now using it as support.
- MACD 11day (blue line) is still above the 26 day (orange line) meaning it remains somewhat bullish, but it is not turning light green showing some selling pressure.
- RSI now heading lower showing the same selling pressure.
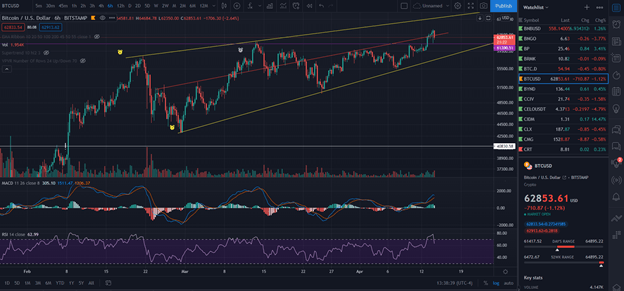
BTC 6 Hour Chart:
- Candles are fighting resistance support of $61,000-$62,000.
- MACD looks like it is about to cross for worse meaning we should be testing the $61,000-$60,000 and worst case $58,000-$59,000 level again (which is the lower yellow trend line).
- RSI coming down confirming it will be testing lower levels.
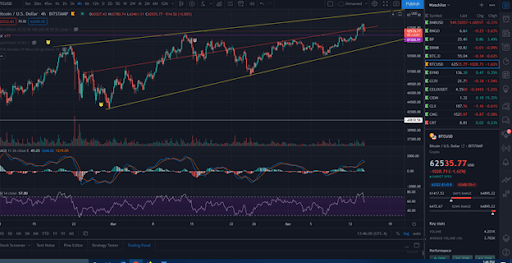
BTC 4 Hour Chart:
- Candles are finding support at the $62,400 level.
- MACD is about to cross worse though meaning lower lows should be up ahead.
- RSI still trending down.
Ethereum (ETH/USD)
Ethereum has stayed in the blue channel for a while and getting inner support resistance. A clear reversal formed when it got to the $2,000 level and was able to surmount the resistance to get support at $2,300. With the MACD performing better, thus higher highs are experienced. However, according to the RSI, it is indicative of the fact that the asset may be overbought.
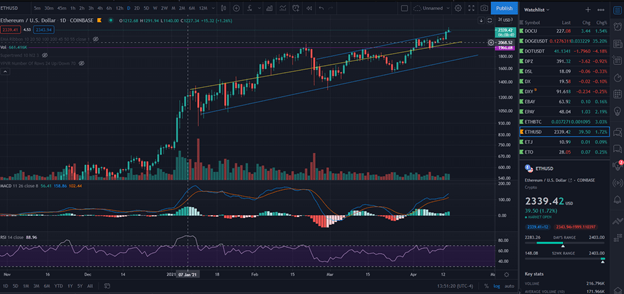
ETH Daily Chart:
- ETH was staying in Blue Channel and using the yellow line as an inner support resistance. On 4/7 and 4/8 there is a clear reversal forming at $2,000 level and pushed through resistance and is now using the Blue line as support ($2,300 level).
- MACD bounced for the better and we are making higher highs.
- RSI about to be above 70 showing the asset is about to be extremely overbought.
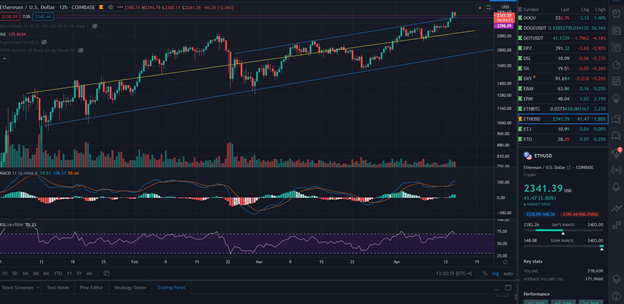
ETH 12 Hour Chart:
- Candles are confirming using $2,400 as new resistance and $2,300 as support. If broken, $2,200 would be support.
- MACD trending sideways but above zero line so the asset remains bullish.
- RSI broke 70 level and is now trending downward.
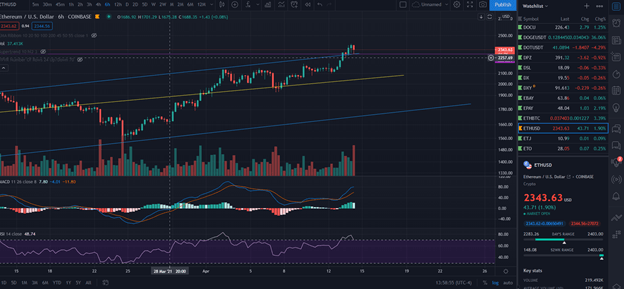
ETH 6 Hour Chart:
- Candles are showing buying pressure at the $2,300 level. The coin needs to stay above for bullish continuation.
- MACD is turning light green showing less more selling pressing coming.
- RSI still trending downward.
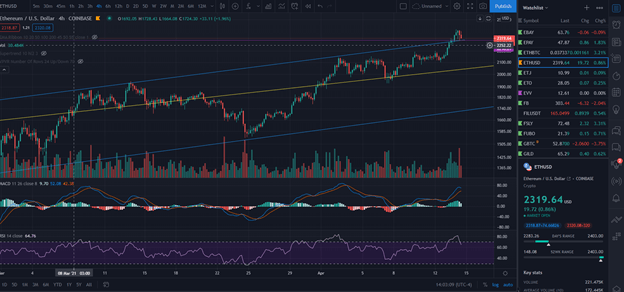
ETH 4 Hour Chart:
- Candles are forming lower lows. Seems like blue support of $2,300 will be broken.
- MACD about to cross for worse meaning lower lows will continue. (next major support is $2,100-$2,200)
- RSI still trending downward. It needs to show bottom or higher lower for a reversal.
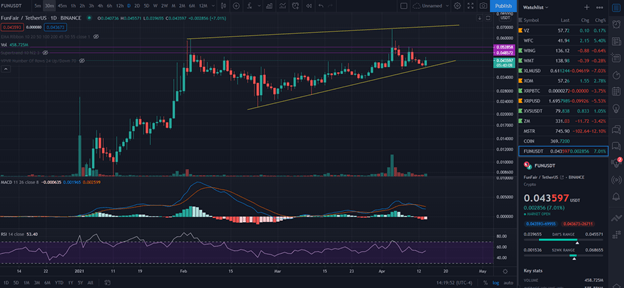
Funfair: (FUN/USDT)
FUN the candles are bouncing off the yellow support, and the altcoin needs to break resistance of $0.048 in order to hit the next target and resistance of $0,052. If the coin goes beyond that, then a new high of about $0,07 is in view. MACD is performing well and will get to higher highs in no time. The RSI is indicative of the fact that it is bullish.
FUN Daily Chart:
- Candles are bouncing off yellow support. Needs to break the resistance of $0.048 to hit the next target/resistance of $0,052 and if that is broken you are looking at a new high around the $0,07 level.
- MACD looks beautiful. Forming bottom well above zero line, meaning higher highs should be on the horizon.
- RSI looks like a double bottom and is now turning up. (bullish).
Author

Marko Vidrih
Fun Token Limited
Marko Vidrih was born in Slovenia and has always been fascinated by the worldwide economy and evolving technologies, such as Blockchain.


