Toncoin price is poised for rally if key support holds at the key level
- Toncoin price is retesting its key support zone between $4.83 and $5.19, which, if not broken, could be followed by a bullish move.
- Supply Distribution data shows that one cohort of whales bought TON during the recent price dip.
- A daily candlestick close below $4.83 would invalidate the bullish thesis.

Toncoin (TON) price is retesting on Monday a crucial support zone, trading broadly stable at around $5.20 in the European early session. Recent moves from large-wallet investors suggest that if Toncoin is able to hold above this key technical level, a rally for the Telegram-related token could be on the horizon.
Toncoin shows potential for a rally
Toncoin price is retesting a key support zone between $5.18 and $4.83. This zone roughly coincides with three major support levels:
- The ascending trendline, drawn by joining multiple low levels since the end of February.
- The 61.8% Fibonacci retracement level at $5.21, drawn from a swing low of $3.32 on March 17 to a swing high of $8.28 on June 15.
- The lower band of the volume profile (the total volume traded at a given price level during a certain period into up volume) at $5.25.
All the above levels form a key reversal zone. On Monday, TON trades broadly stable, hovering around $5.20. If the $4.83 level holds, Toncoin price could rally 30% to retest its daily resistance level at $6.23.
The Relative Strength Index (RSI) and Awesome Oscillator (AO) on the daily chart have slipped below their neutral levels of 50 and zero, respectively, suggesting that momentum remains weak. If bulls are indeed returning, then both momentum indicators must cross above their respective neutral levels. Such a development would add a tailwind to the recovery rally.
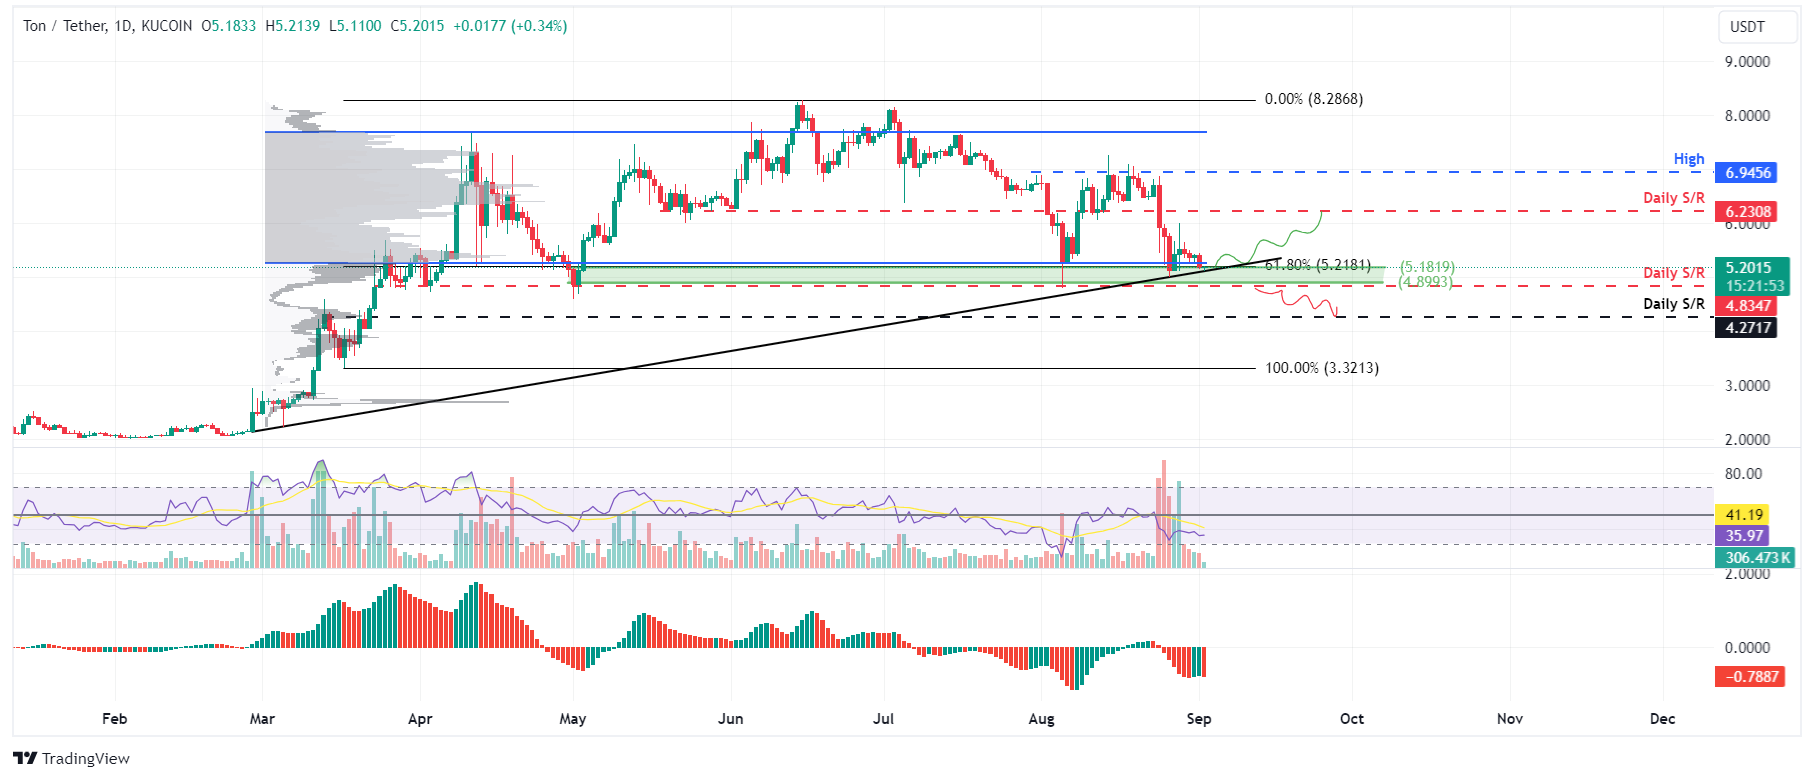
TON/USDT daily chart
Santiment’s Supply Distribution metric shows that the number of whales holding between 100,000 to 1 million TON tokens has dropped from 4.01 million on August 26 to 3.2 million currently. Meanwhile, wallets holding 1 million to 10 million TON surged from 0 to 1.11 million in the same period.
This development shows that the first cohort of whales could have fallen prey to the capitulation event. In contrast, the second set of wallets seized the opportunity and accumulated Toncoin at a discount during the recent price dip, which was triggered by the arrest of Telegram’s founder Pavel Durov in France.
%20[12.45.52,%2002%20Sep,%202024]-638608664518145805.png)
Toncoin Supply Distribution metric chart
Even though on-chain metrics and technical analysis support the bullish outlook, if Toncoin makes a daily candlestick close below $4.83, the bullish thesis would be invalidated by creating a lower low on the daily chart. This development could see Toncoin’s price decline by an additional 11% to retest its next daily support at $4.27.
Author

Manish Chhetri
FXStreet
Manish Chhetri is a crypto specialist with over four years of experience in the cryptocurrency industry.


