Tron price is set for a decline as technical indicators show bearish momentum
- Tron's RSI indicator forms a bearish divergence, signaling a trend reversal.
- On-chain data paints a bearish picture, as TRX's long-to-short ratio is below one, and the OI-Weighted Funding rate is negative.
- A daily candlestick close above $0.170 would invalidate the bearish thesis.

Tron (TRX) retested its resistance barrier and declined 6.1% last week. In the Asian session on Monday, it trades at $0.1557. Tron's price action suggests a decline ahead, as the bearish divergence in technical indicators shows. Furthermore, the on-chain data support the bearish thesis as TRX's long-to-short ratio is below one, and the Oi-Weighted Funding rate is negative.
Tron price is poised for a decline after retesting the resistance barrier
Tron price retested its March 7, 2021, high of $0.170 on August 25 and declined 6.1% last week. On Monday, it trades slightly higher by 0.06% at $0.1557.
Additionally, the formation of a higher high on the daily chart on August 25 contrasts with the Relative Strength Index (RSI) indicator's lower high during the same period. This development is termed a bearish divergence and often leads to the reversal of the trend or a short-term decline.
If the $0.170 level resistance holds, Tron could decline roughly 7% from the current trading level of $0.1557 to retest $0.1425, the previous weekly support.
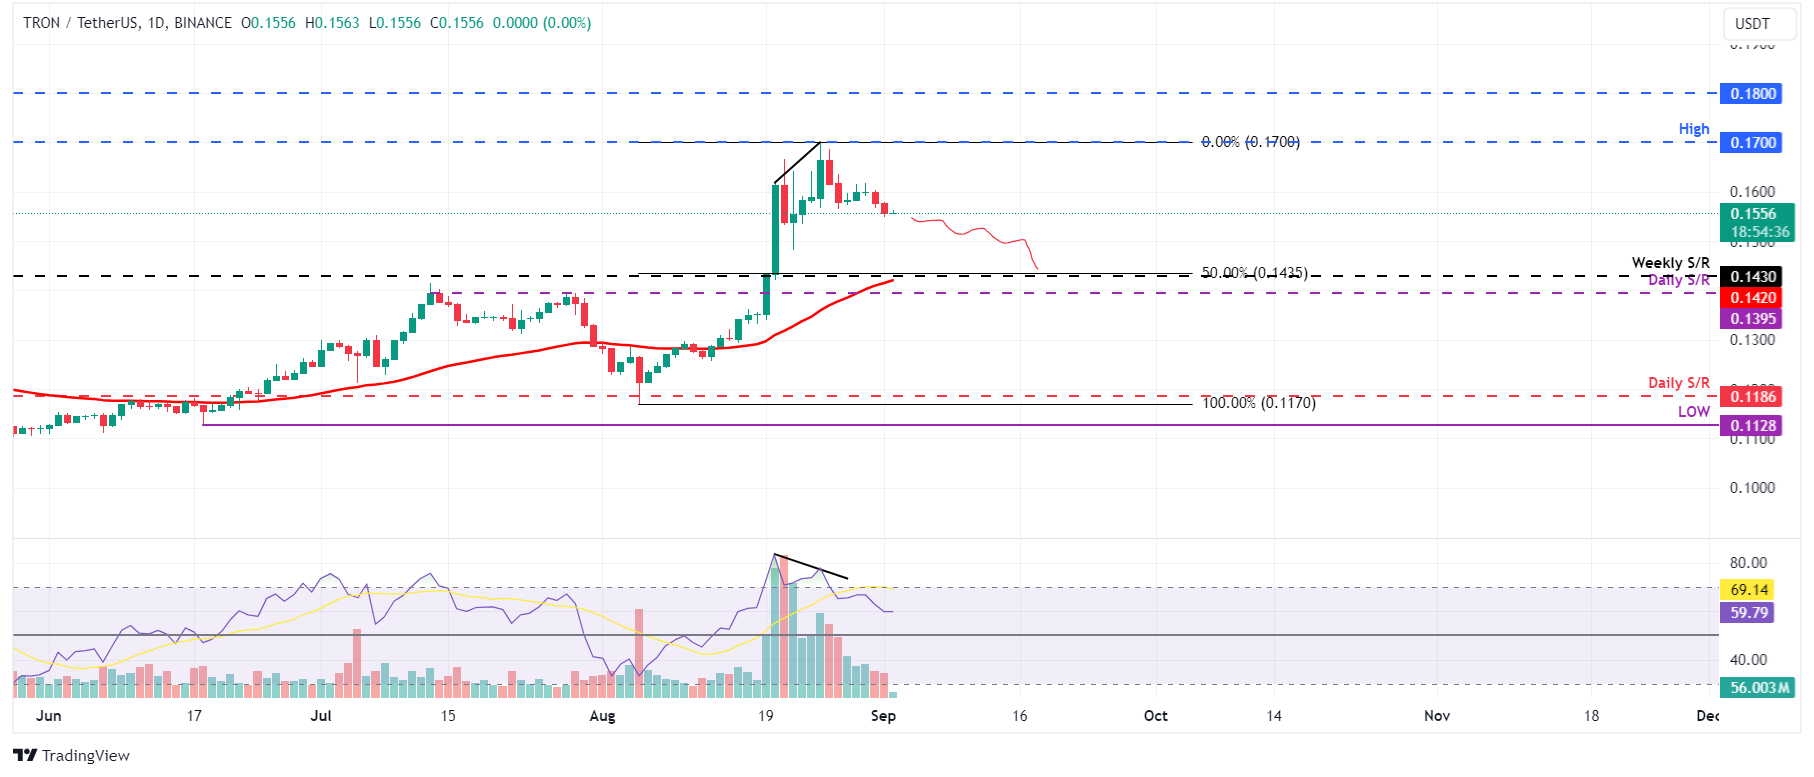
TRX/USDT daily chart
According to Coinglass's OI-Weighted Funding Rate data, it is an important metric for traders and analysts to gauge market sentiment and predict future price movements. This index is based on the yields of futures contracts, which are weighted by their open interest rates. Generally, a positive rate (longs pay shorts) indicates bullish sentiment when long positions pay for shorts. Conversely, negative numbers (shorts pay longs) indicate bearishness, and shorts pay at the expense of longs.
In the case of Tron, this metric stands at -0.033%, reflecting a negative rate and indicating that shorts are paying longs. This scenario often signifies bearish sentiment in the market, suggesting potential downward pressure on Tron's price.
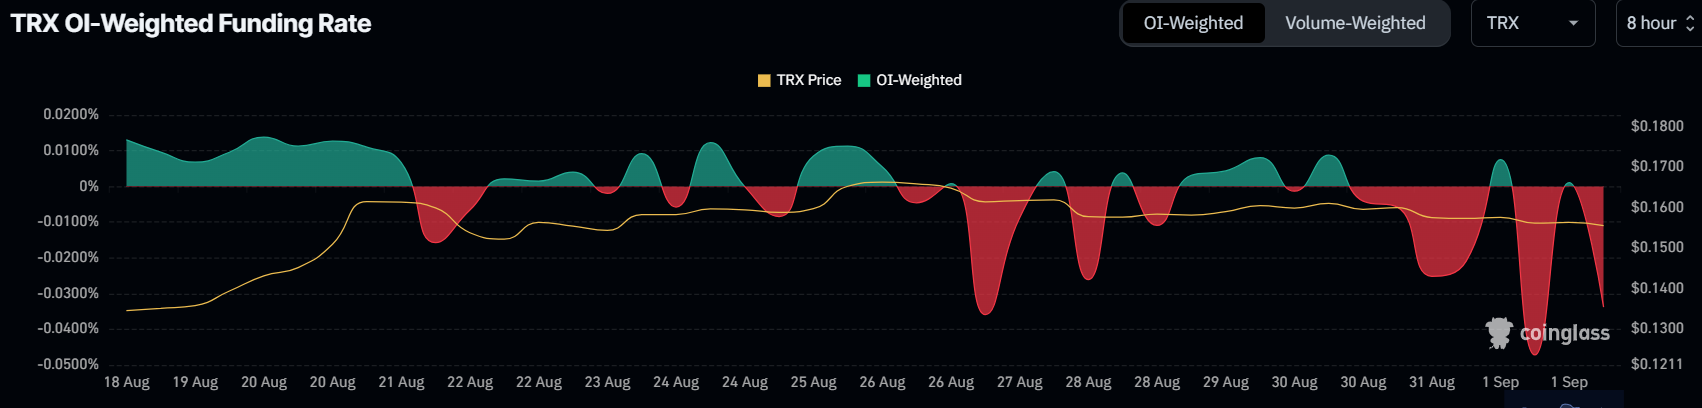
TRX OI-Weighted Funding Rate chart
Additionally, according to Coinglass's data, Binance TRX's long-to-short ratio stands at 0.43. This ratio reflects bearish sentiment in the market, as the number below one suggests that more traders anticipate the price of the asset to fall, bolstering Tron's bearish outlook.
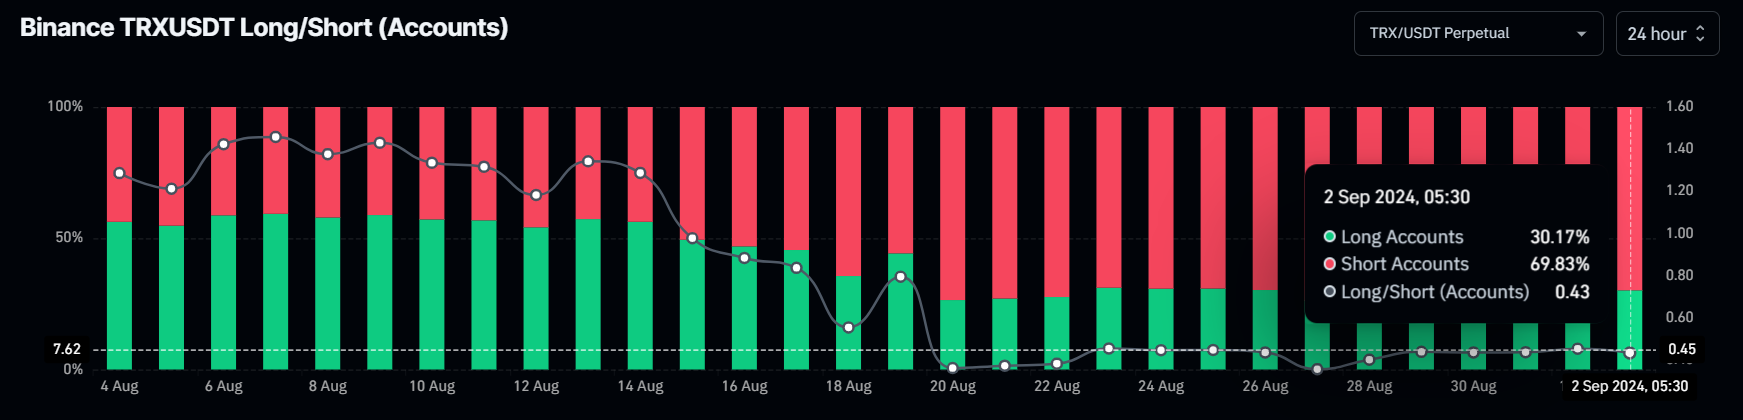
Tron long-to-short ratio chart
However, if TRX's daily candlestick closes above $0.170 and establishes a higher high on the daily timeframe, it may signal a shift in market dynamics that favors bullish sentiment. Such a change could nullify the bearish outlook, leading to a 6% rise in Tron's price to retest the April 17, 2021, high at $0.180.
Author

Manish Chhetri
FXStreet
Manish Chhetri is a crypto specialist with over four years of experience in the cryptocurrency industry.


