Three reasons why Bitcoin price is about to crash
- Bitcoin price is hovering around the psychological barrier of $19,000.
- Three different technical indicators imply that the coin is on the verge of a massive sell-off.
- Only a sustainable move above $19,600 may help invalidate the bearish scenario.

Bitcoin is changing hands around $19,000. The pioneer digital currency lost over 1% in the past 24 hours; however, it is still in the green zone on a week-to-week basis. BTC celebrated the beginning of the first winter month with a new all-time high at $19,915 and retreated to $18,335 on December 2 amid massive leveraged longs liquidation. Since that time, the coin managed to regain some ground but the bullish momentum is not strong enough to take the price to $20,000 and beyond.
Bitcoin price screams sell across the board
From a technical point of view, there are at least three clear signals that promise more pain ahead.
First, the TD Sequential indicator sent a sell signal on BTC's monthly chart. The bearish formation developed as a red nine candlestick, indicating that Bitcoin price is poised to drop further, for one to four monthly candlesticks. But If the selling pressure is strong enough, the pioneer cryptocurrency might even start a new downside countdown.
-637426844476943730.png)
BTC's Monthly Chart
Second, the Relative Strenght Index (RSI) hit overbought territory on the weekly chart. A popular technical analyst within the cryptocurrency community known as Dave the Wave noted that the RSI exceeded 80, which is usually a precursor for a retreat.
Dave estimates that a sell-off around the current price levels could see Bitcoin crash to $10,000. Such a pessimistic target was determined by a long-term upside trendline that was created since BTC's inception.
FXStreet previously reported that 20-30% corrections are common during Bitcoin's bull runs. A retracement of this magnitude could see prices drop to $13,000-$14,000 instead.
— dave the wave (@davthewave) December 4, 2020
Finally, Glassnode's Percent of Transfer Volume in Profit metric implies that BTC is ready for the correction. This indicator is calculated as a "percentage of transferred coins whose price at the time of their previous movement was lower than the current price." In other words, it tracks the number of Bitcoin moved within its blockchain that sits in a profitable position.
Currently, the on-chain metric shows that the flagship cryptocurrency has reached a potential market top. Read more details on how this indicator works.
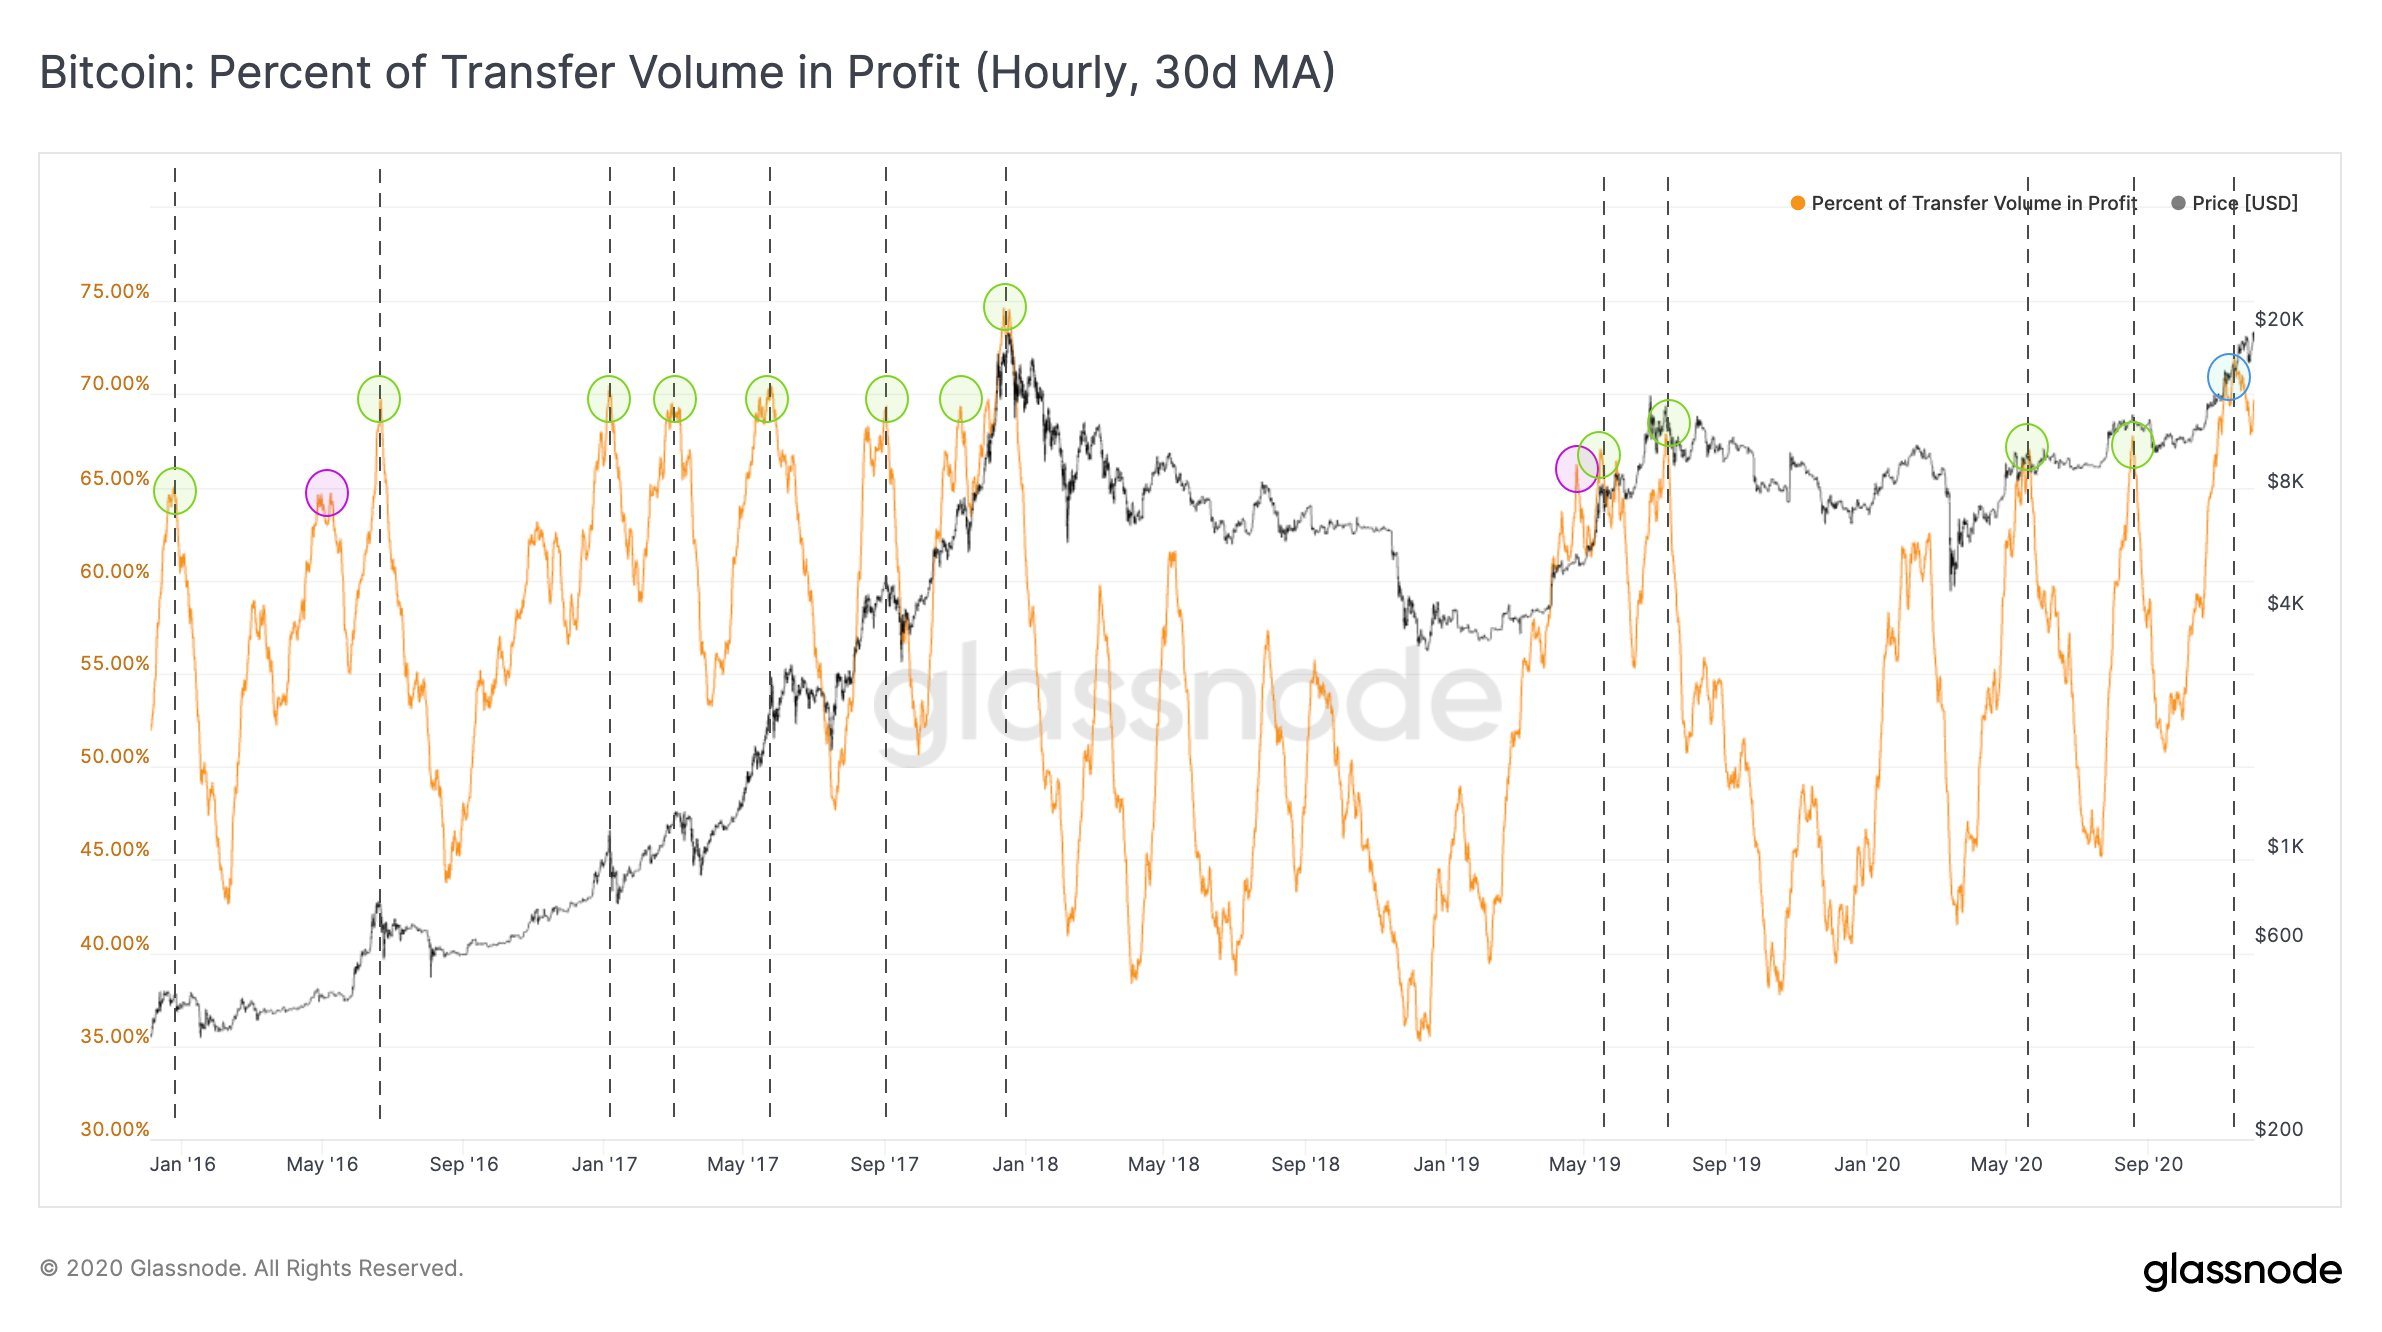
Bitcoin Percent of Transfer Volume in Profit
Key levels to watch
Bitcoin is vulnerable to a steep decline with the first local barrier around $18,000. If this one is cleared, sell orders may skyrocket creating a ripple effect across the entire market. Losing $18,000 as support will likely see BTC plummet to $13,500 or even $10,000.
On the other hand, if Bitcoin price manages to settle above $19,600, the bearish forecast will be invalidated. Trading veteran Peter Brandt believes that moving past this resistance hurdle will ignite FOMO among investors, pushing BTC to $50,000.
Author

Tanya Abrosimova
Independent Analyst