These two DeFi coins are on the verge of explosive rallies
- Aave price building an inverse head-and-shoulders pattern after triple-digit gain from the 50-week simple moving average (SMA).
- Compound price plotting a powerful high tight flag pattern after logging a 180% gain in two weeks.
- Bitcoin price continues to relay a message of indecision and disinterest from the cryptocurrency fan club.

Aave price is plotting a constructive bottoming pattern amidst a cryptocurrency market defined by weakness and general insecurity. In contrast, Compound price has distinguished itself through notable outperformance since the June 22 low. In each case, the resulting bullish outlook is contagious and may become the source of FOMO in the DeFi space.
Aave price prepares new buying opportunity for DeFi enthusiasts
Aave price rallied over 110% from the June 22 low after briefly breaking down below the strategically important 50-week SMA. The rally was halted around the Anchored VWAP from January 4 at $341.73, and AAVE shifted into a corrective phase to release the price compression generated by the intensity of the rally.
Currently, Aave price illustrates the right shoulder of an inverse head-and-shoulders pattern along the 50-day SMA, currently at $290.27. The measured move of the bottoming formation is 109%, placing the price target at $756.00 and lifting AAVE beyond the all-time high of $707.67 printed on May 18.
The underlying AAVE volume profile shows rising demand during the upswing from the June 22 low and lower volume during the ongoing construction of the right shoulder. It is a profile consistent with a bullish resolution moving forward.
Despite the sizable rally, the AAVE daily Relative Strength Index (RSI) did not reach an overbought condition and has settled into the mid-range of the indicator, providing Aave price the momentum runway to tag the all-time high at $707.67 and potentially, the measured move target of $756.00.
Aave price will encounter one challenge before triggering the neckline of the inverse head-and-shoulders pattern, and that is the merger of the 200-day SMA at $339.50 with the Anchored VWAP at $340.04. The Anchored VWAP was vital support during the February, March and April pullbacks and will now be recognizable AAVE resistance.
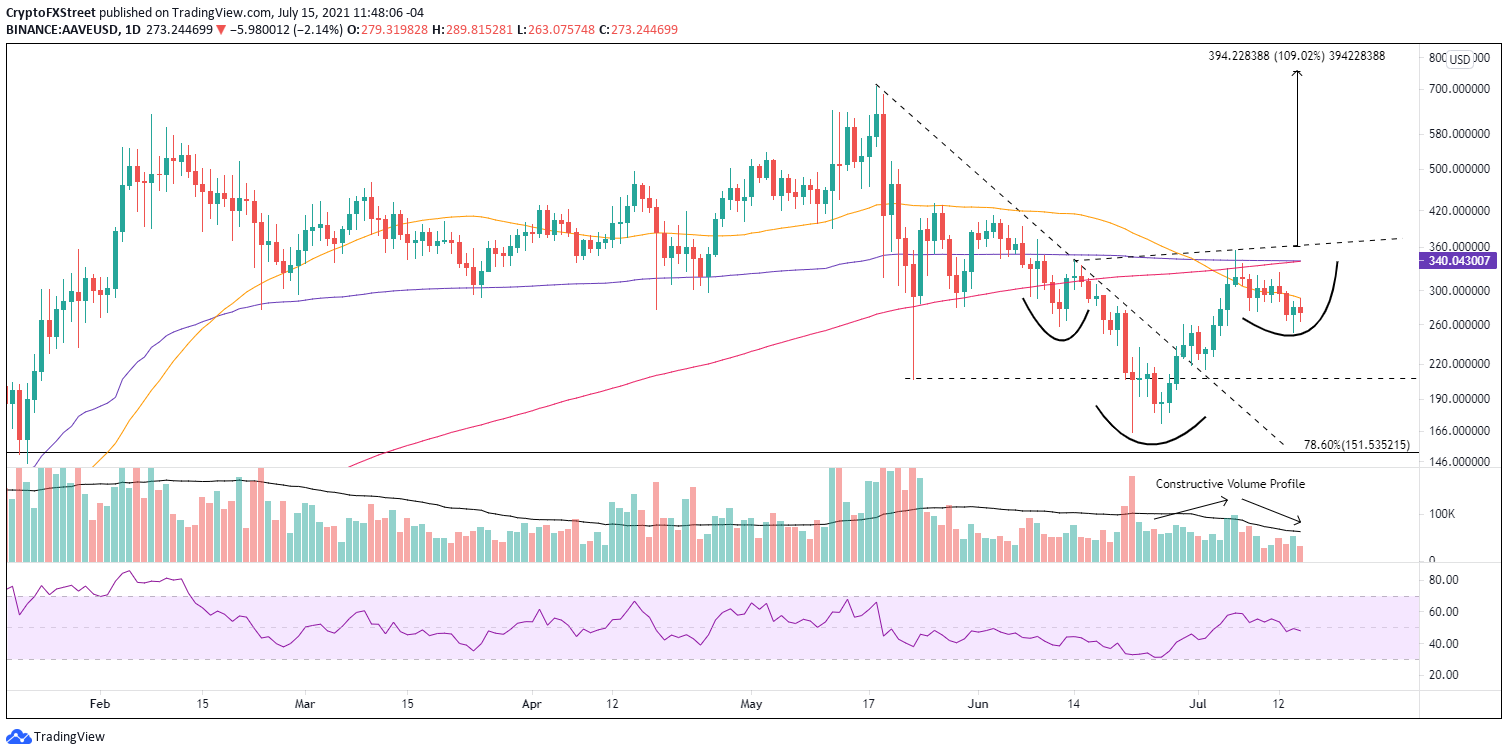
AAVE/USD daily chart
A glance of the AAVE/BTC pair shows the notable relative strength from June 27 and the mildness of the current Aave price consolidation versus the broader market. Moreover, the volume compression during this consolidation only boosts the legitimacy of the AAVE pattern and the attractiveness of the DeFi leader in a period of weakness in the cryptocurrency complex.
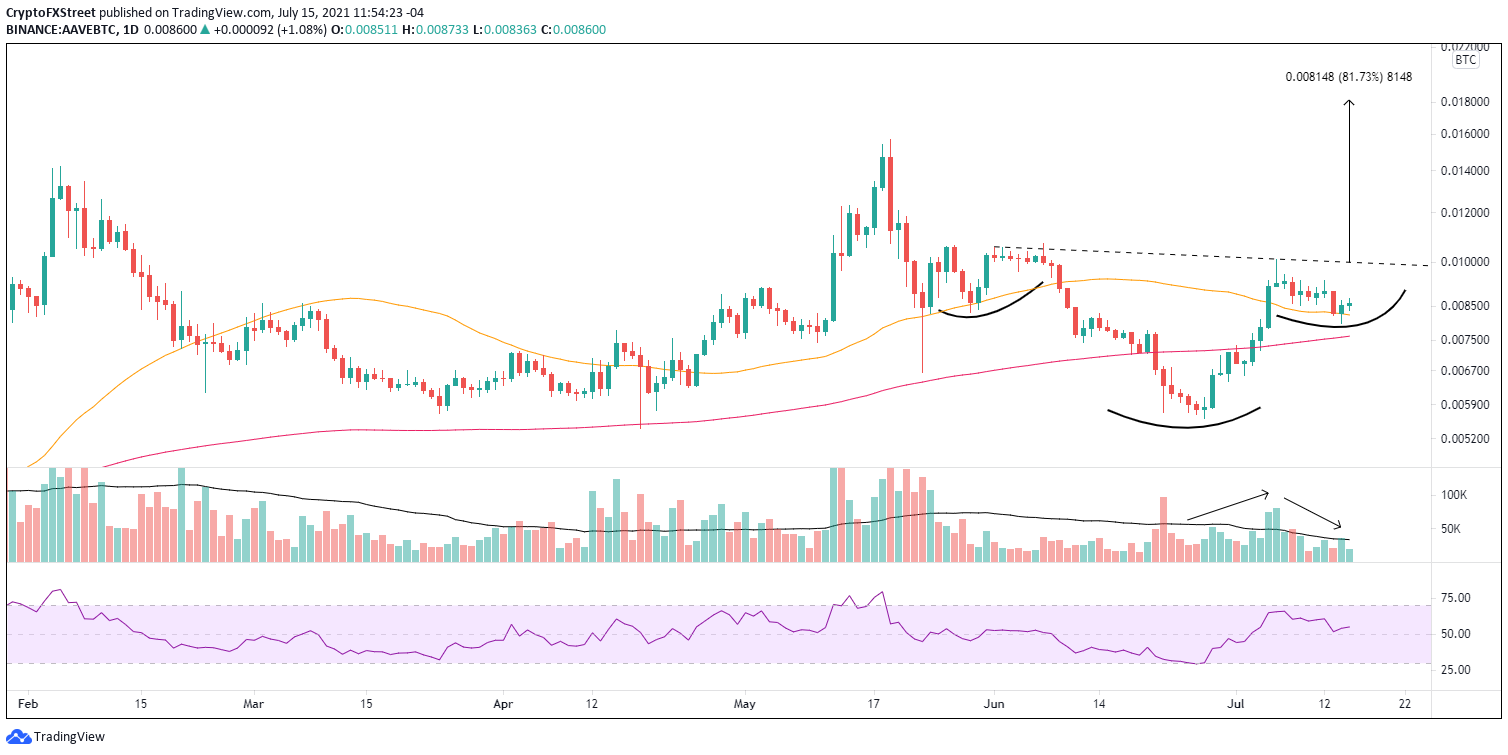
AAVE/BTC daily chart
Suppose Aave price logs a daily close below yesterday’s low of $251.87. In that case, the inverse head-and-shoulders pattern will be voided and raise the probability that AAVE is pursuing a more complex bottoming process.
Compound price pauses in a larger trend towards new highs
Compound price was a revelation following the June 22 low, climbing 180% and shattering the resistance associated with the 200-day SMA. The sharp rally followed a temporary decline below the 2020 high and the 50-week SMA, demonstrating a commitment from prominent investors to seize on the COMP opportunity.
Since the rally high on July 6, Compound price has been clarifying an inverse head-and-shoulders pattern with the right shoulder establishing support between the 50-day SMA at $356.06 and the 200-day SMA at $418.81. As a result of the minor setback, COMP has released the overbought condition on the daily RSI, putting the defi token in a stronger position to commence a sustainable, second leg higher for the advance.
The bottoming formation’s measured move is 160%, projecting a price target of $1,458.00. An advance of that magnitude would place COMP well above the all-time high of $928.17 printed on May 12.
A more realistic profit target for Compound price is the all-time high, representing a 67% gain from the current position of the COMP neckline.
Interestingly, the current Compound price structure of the right shoulder has presented a cheat opportunity. The simple double bottom pattern arising from the COMP right shoulder provides an early entry price of $467.57, allowing COMP investors to initiate pilot buys before the neckline trigger price of $560.00, thereby lowering their overall buy price.
The only obstacle for Compound price is disentangling from the magnet effect of the 200-day SMA at $418.80.
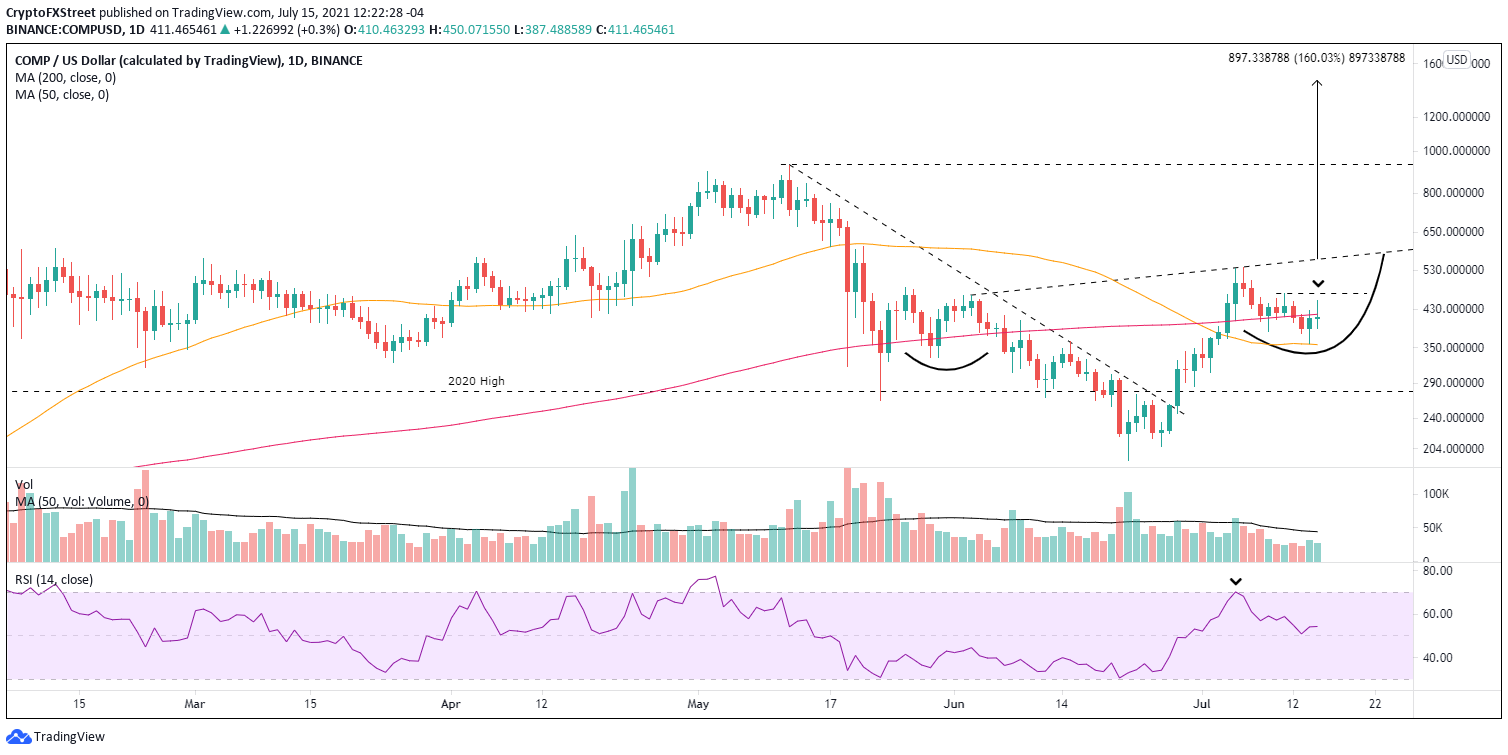
COMP/USD daily chart
The compelling opportunity for Compound price is reinforced by the high tight flag pattern on the COMP/BTC chart. The pair rallied 130% from the June 22 low to the July 6 high of $0.015 before correcting 26%. The corrective process should not exceed three weeks.
It is a powerful pattern that can yield returns of 100% to 200% in a relatively brief period.
It is clear that Compound price has broken away and is carving out its path, regardless of the trivial price swings that have characterized Bitcoin for several weeks.
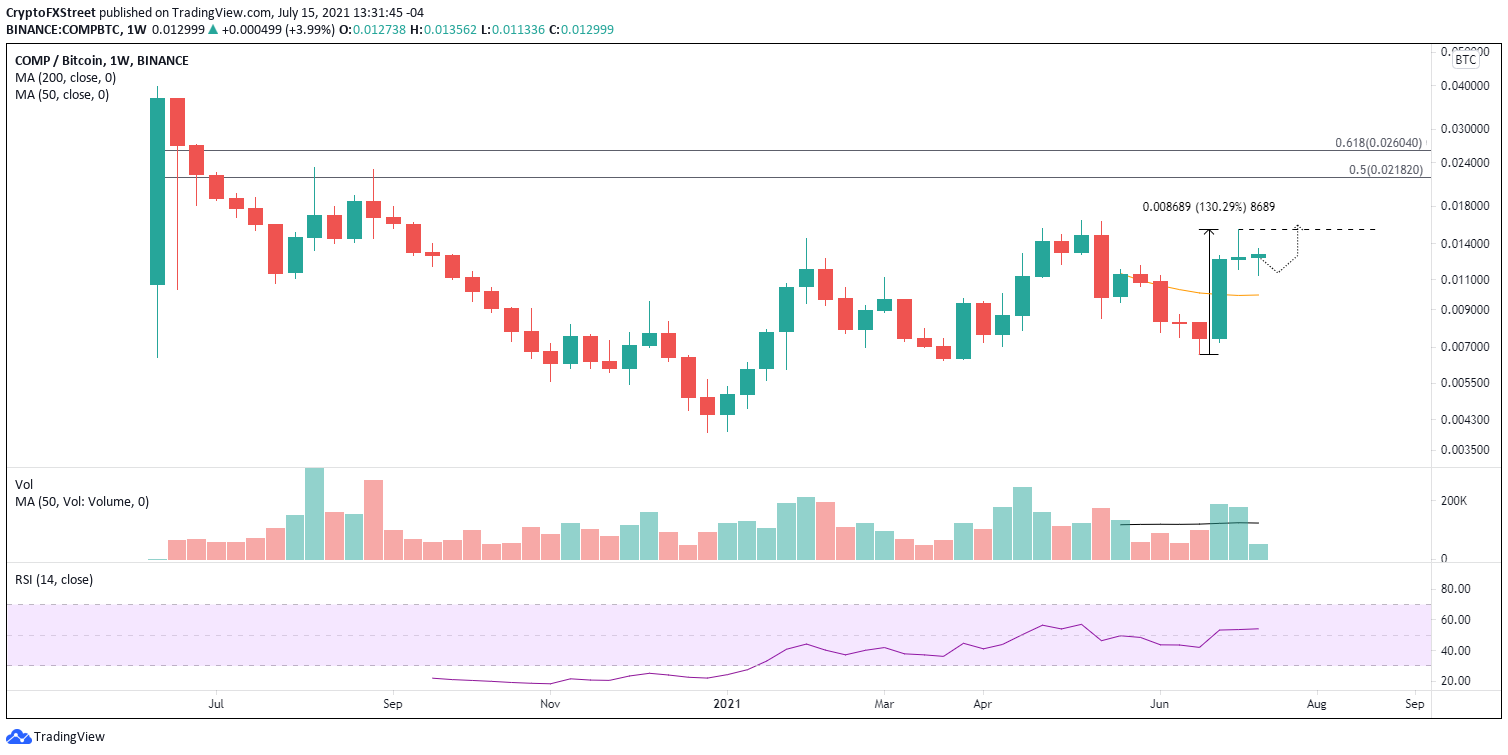
COMP/BTC weekly chart
Overall, the heightened interest in the decentralized finance (DeFi) space has unlocked Aave price and Compound price from the oscillations of the broader cryptocurrency market and positioned them both in constructive patterns with significant profit outcomes if successfully triggered. Moreover, it only helps that many cryptocurrencies in the space are participating, creating the source of future FOMO (fear of missing out).
Author

Sheldon McIntyre, CMT
Independent Analyst
Sheldon has 24 years of investment experience holding various positions in companies based in the United States and Chile. His core competencies include BRIC and G-10 equity markets, swing and position trading and technical analysis.


