These three DeFi tokens prepare to make a resurgence
- Aave price jumps almost 60% from the June lows, shattering the May declining trend line.
- Compound price catapults 90%, reinstating various support levels as the DeFi token pursues higher prices.
- Maker price recovers the strategically important 200-day simple moving average (SMA), yielding the second-best week since April.

Aave price declined 34% in the second quarter after six consecutive positive quarters that generated gains of over 200,000% for early investors. Compound price fell 15% in the second quarter after an explosive first-quarter gain of 130%. Maker price gained 27% in the second quarter, marking four consecutive positive quarters since trading began.
Aave price displays relative strength in a period of crypto market uncertainty
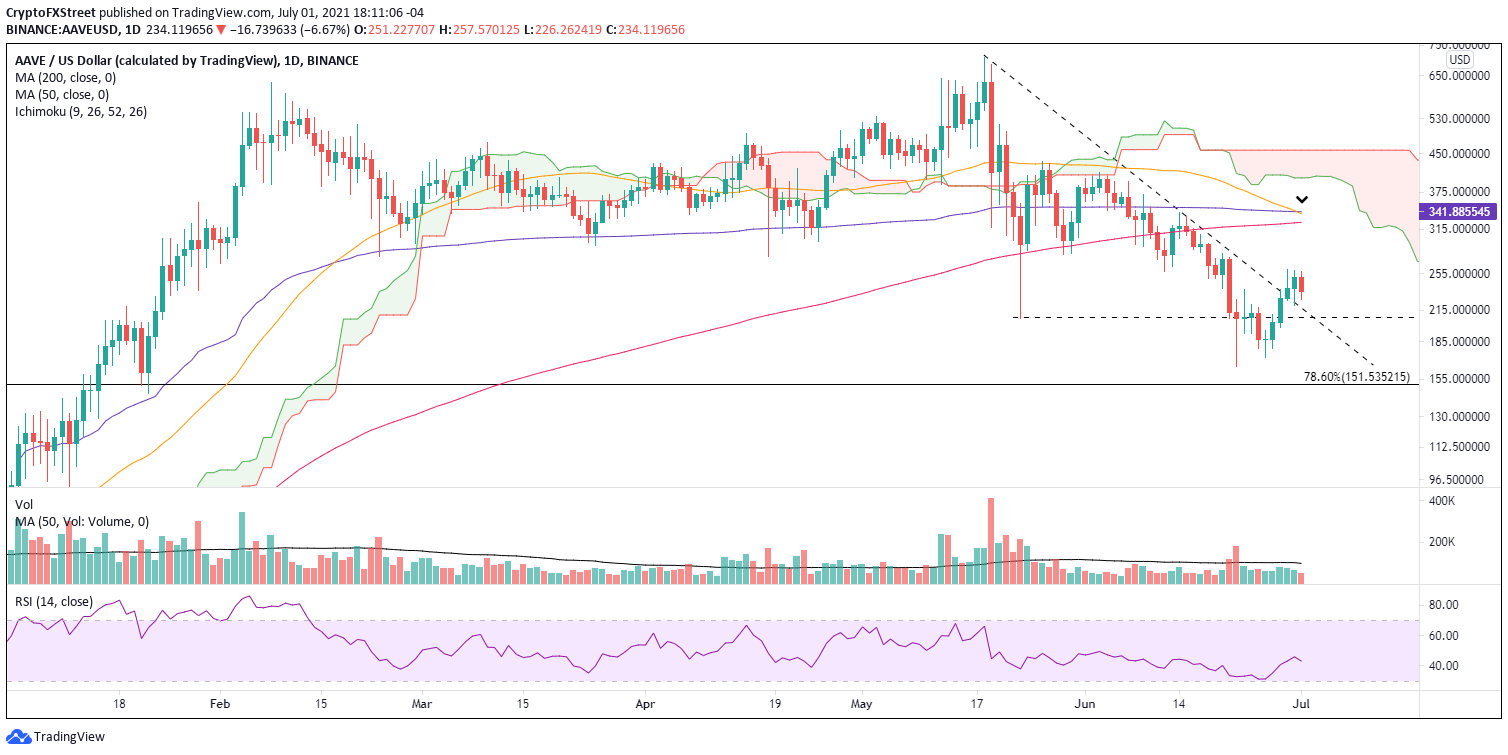
During the bounce from the new correction low printed in June, Aave price recaptured the May low of $206.81, the strategically important 50-week SMA at $210.74 and May’s declining trend line around $225.00. It has been a technical breakthrough, reinstating critical support levels that can now provide AAVE with the capacity to absorb the oscillations in the cryptocurrency market that have been persistent since the early part of May.
After a 60% bounce from the June low of $165.05, Aave price is not near an overbought reading on the daily chart, presenting plenty of upside potential for the short and medium-term. Adding to the bullish AAVE outlook is the relatively strong volume behind the price advance, which has not been recognizable in other cryptocurrencies that have enjoyed superior returns off the lows.
Some consolidation is warranted at this stage, but Aave price needs to hold the 50-week SMA currently at $210.74. It would only be around a 10% pullback from the current price, releasing some of the price compression and freeing AAVE to rally to the next formidable resistance, the 200-day SMA at $325.00, delivering a 30% return from the current price.
Aave price may extend the rally to the intersection of the 50-day SMA at $338.39 with the Anchored VWAP from January 4 at $341.89, representing a 32% gain from the current AAVE price. The VWAP served as support in February, March and April, suggesting it will be a resistance level of importance.
AAVE/USD daily chart
If a pullback materializes now and Aave price fails to hold the 50-week SMA and the May low of $206.81, the bullish outlook would be voided, and consideration would have to be given to a retest of the June low of $165.05. The 78.6% Fibonacci retracement of the 2019-2021 rally at $151.53 should also factor into any trading plan.
Additionally, AAVE will trigger a Death Cross in the coming days as the 50-day SMA inches closer to crossing below the 200-day SMA, projecting some downward pressure on Aave price.
Compound price nears critical resistance, displays some potential upside
Compound price performance since the June low has been a revelation for the newer cryptocurrency after diving approximately 80% from the May high. The COMP rebound has been impressive and constructive in overcoming resistance and establishing a foundation for higher prices in the months ahead.
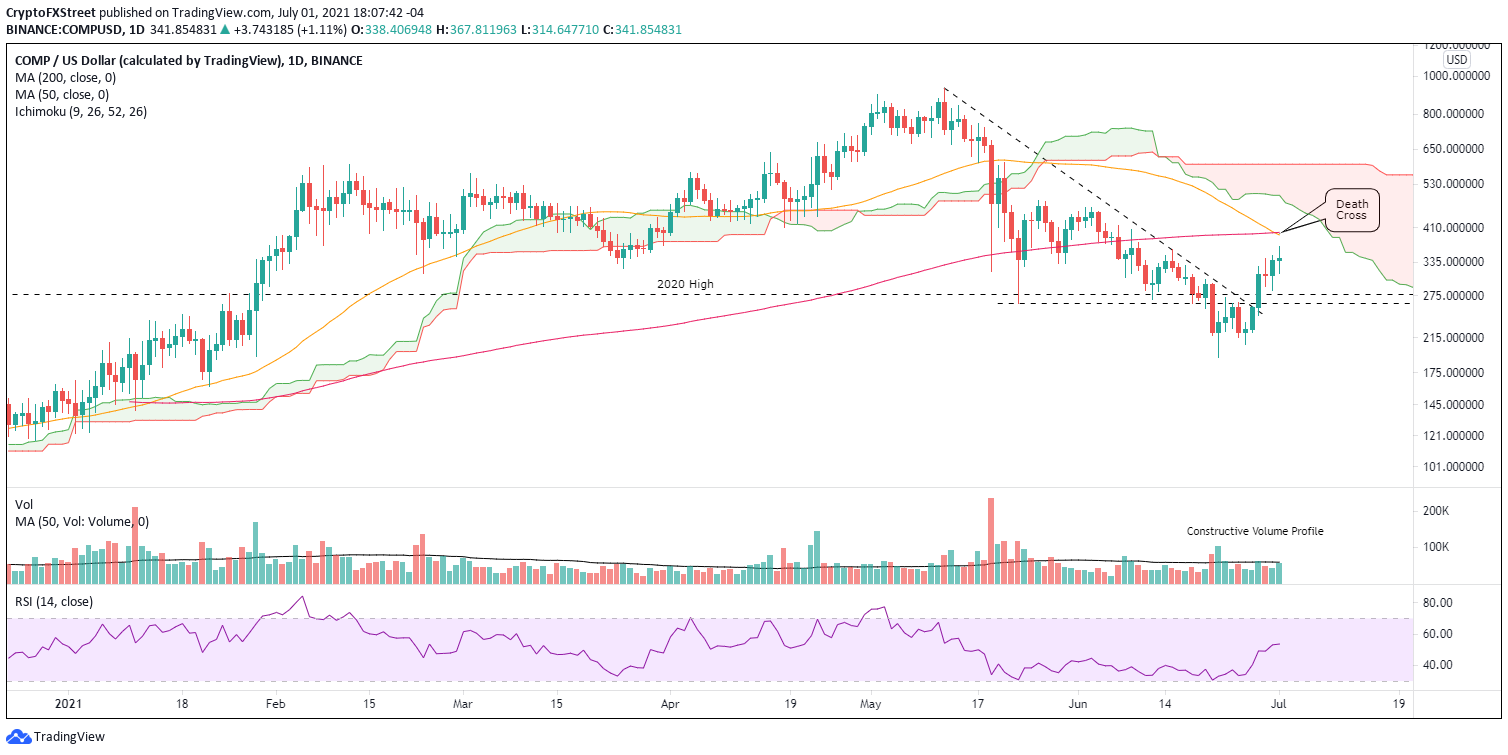
This week Compound price has already rallied 30%, but more importantly, COMP has reclaimed the May low of $263.63, the 2020 high of $277.66, the 50-week SMA at $290 and May’s declining trend line. The DeFi token has solidified a range of support that will be quintessential if selling spreads during the week.
The immediate upside potential is limited to 15% as COMP is triggering the Death Cross pattern today, making the 50-day SMA at $393.27 and 200-day SMA at $399.44 firm resistance for the Compound price rebound.
A more probable outcome is for Compound price to begin a pullback, liberating some of the price compression facilitated by the 90% rally off the June low. As long as COMP holds the critical support levels mentioned above, a corrective process will only fortify the ability for Compound price to rally to at least the daily Ichimoku Cloud.
COMP/USD daily chart
If the pullback exceeds $263.63 on a daily closing basis, Compound price could encounter new selling pressure that would put the COMP June low of $191.76 at risk.
Maker price exudes confidence as reluctance plagues the cryptocurrency market
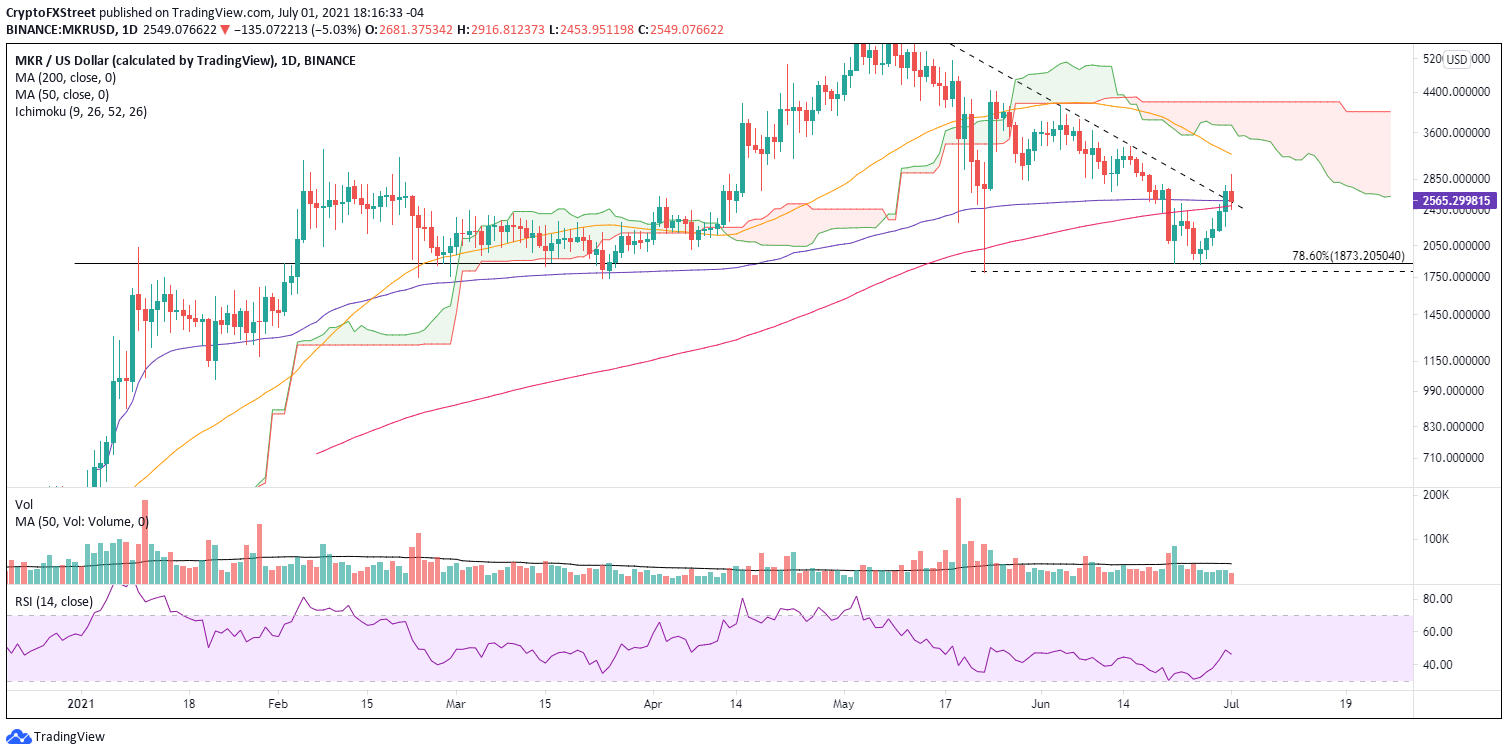
As one of the largest DeFi protocols behind AAVE, MKR has displayed impressive relative strength, striking an advance that has defeated the resistance formalized by the union of May’s declining trend line at $2,587 with the 200-day SMA at $2,490 and the Anchored VWAP at $2,565. It is a bullish development in a cryptocurrency market overwhelmed by indecision, particularly against essential resistance levels.
In contrast to the major digital assets, Maker price did not test or undercut the May low of $1,796, suggesting that the weak holders have completely been evacuated from MKR.
Maker price is in a comfortable position at this point of the recovery cycle. It now has three critical support levels below it that include 200-day SMA, the Anchored VWAP and May’s declining trend line. Combined, those MKR levels should minimize the downside should selling accelerate in the cryptocurrency market.
At the current price level, Maker price only faces resistance at the 50-day SMA at $3,231, representing a 30% gain for MKR investors buying against the support mentioned above. An extension of the rally will be preempted by the daily Ichimoku Cloud and the weight of the declining 50-day SMA.
MKR/USD daily chart
However, suppose Maker price fails to hold the bold support already outlined. In that case, MKR will be readily exposed to a new decline that will not only test the 78.6% retracement level of the 2021 advance at $1,873 but sweep the June low of $1,861 and potentially the May low of $1,796, yielding a 30% loss from the current price.
Overall, the increased buying pressure in DeFi tokens is supported by sizeable gains in the daily active addresses metrics. A rise in address activity is generally an early signal of improving network confidence and a possible resurgence of the hot crypto space of 2021.
Author

Sheldon McIntyre, CMT
Independent Analyst
Sheldon has 24 years of investment experience holding various positions in companies based in the United States and Chile. His core competencies include BRIC and G-10 equity markets, swing and position trading and technical analysis.



