XRP steadies above support with inflows driving bullish outlook
- XRP steadies above $1.90 support but holds below the $2.00 key resistance.
- XRP continued to attract fund inflows, drawing nearly $63 million last week.
- Mild but steady XRP ETF inflows and rising retail demand signal a potential bullish outlook.

Ripple (XRP) is stable above support at $1.90 at the time of writing on Monday, after several attempts to break above the $2.00 hurdle failed to materialize last week.
Meanwhile, institutional interest in the cross-border remittance token has remained steady, with inflows into related investment products increasing. If retail demand increases in the days leading up to the New Year, it may shape XRP’s outlook and its recovery potential above $2.00.
XRP draws fund inflows as retail demand shows signs of a comeback
Digital asset investment products saw $952 million in outflows, led by Ethereum (ETH) with $555 million and Bitcoin (BTC) with $460 million. However, XRP maintained a bullish outlook, attracting nearly $63 million in inflows, according to a report by CoinShares. XRP investment products have a total of $2.95 billion in assets under management.
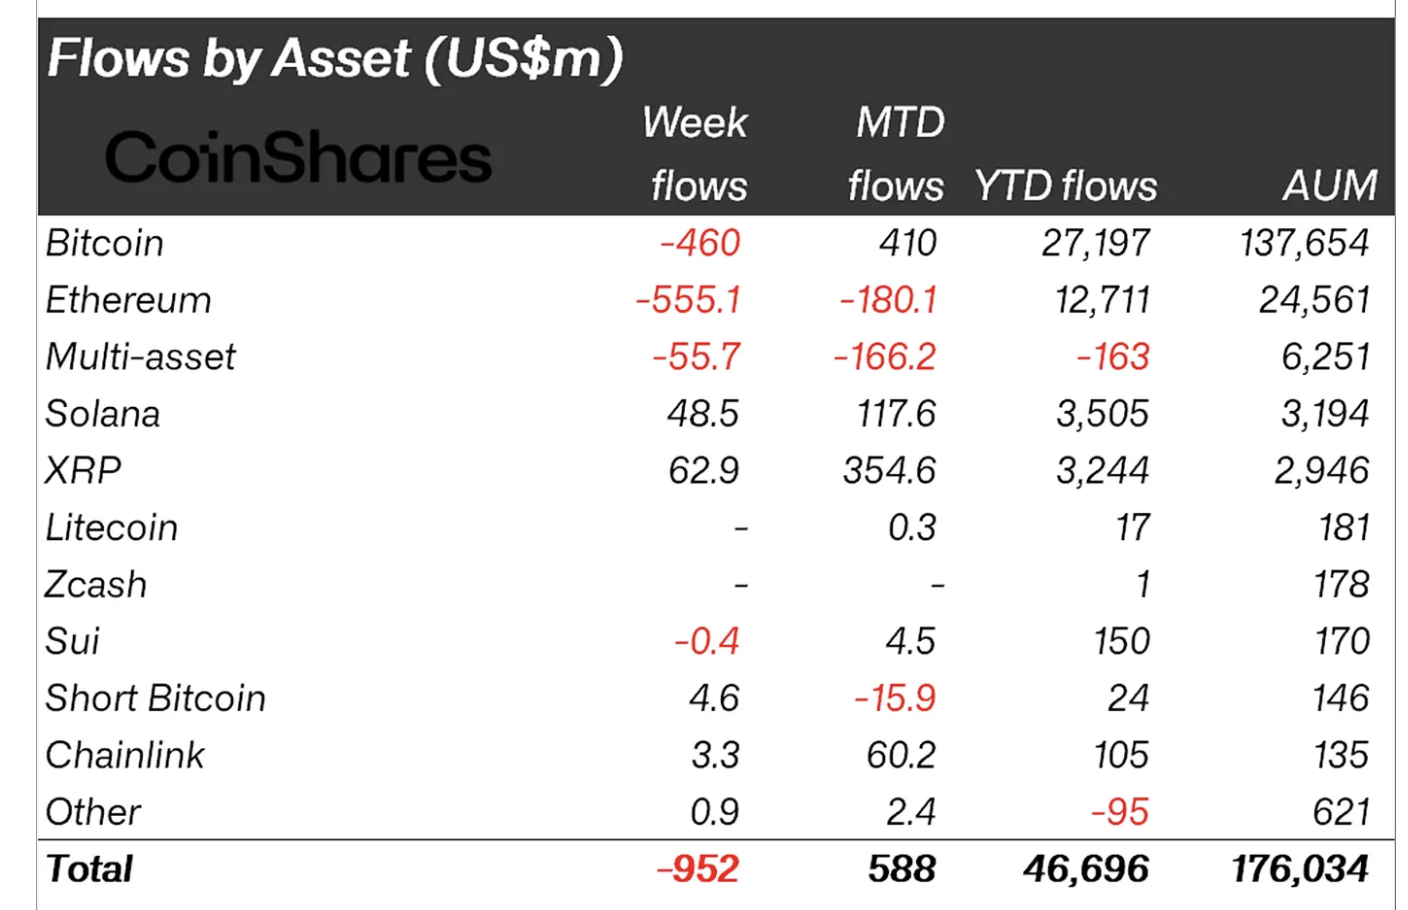
CoinShares stated that the outflows “reflected a negative market reaction to delays in passing the United States (US) Clarity Act, which has prolonged regulatory uncertainty for the asset class, alongside concerns over continued selling by whale investors.”
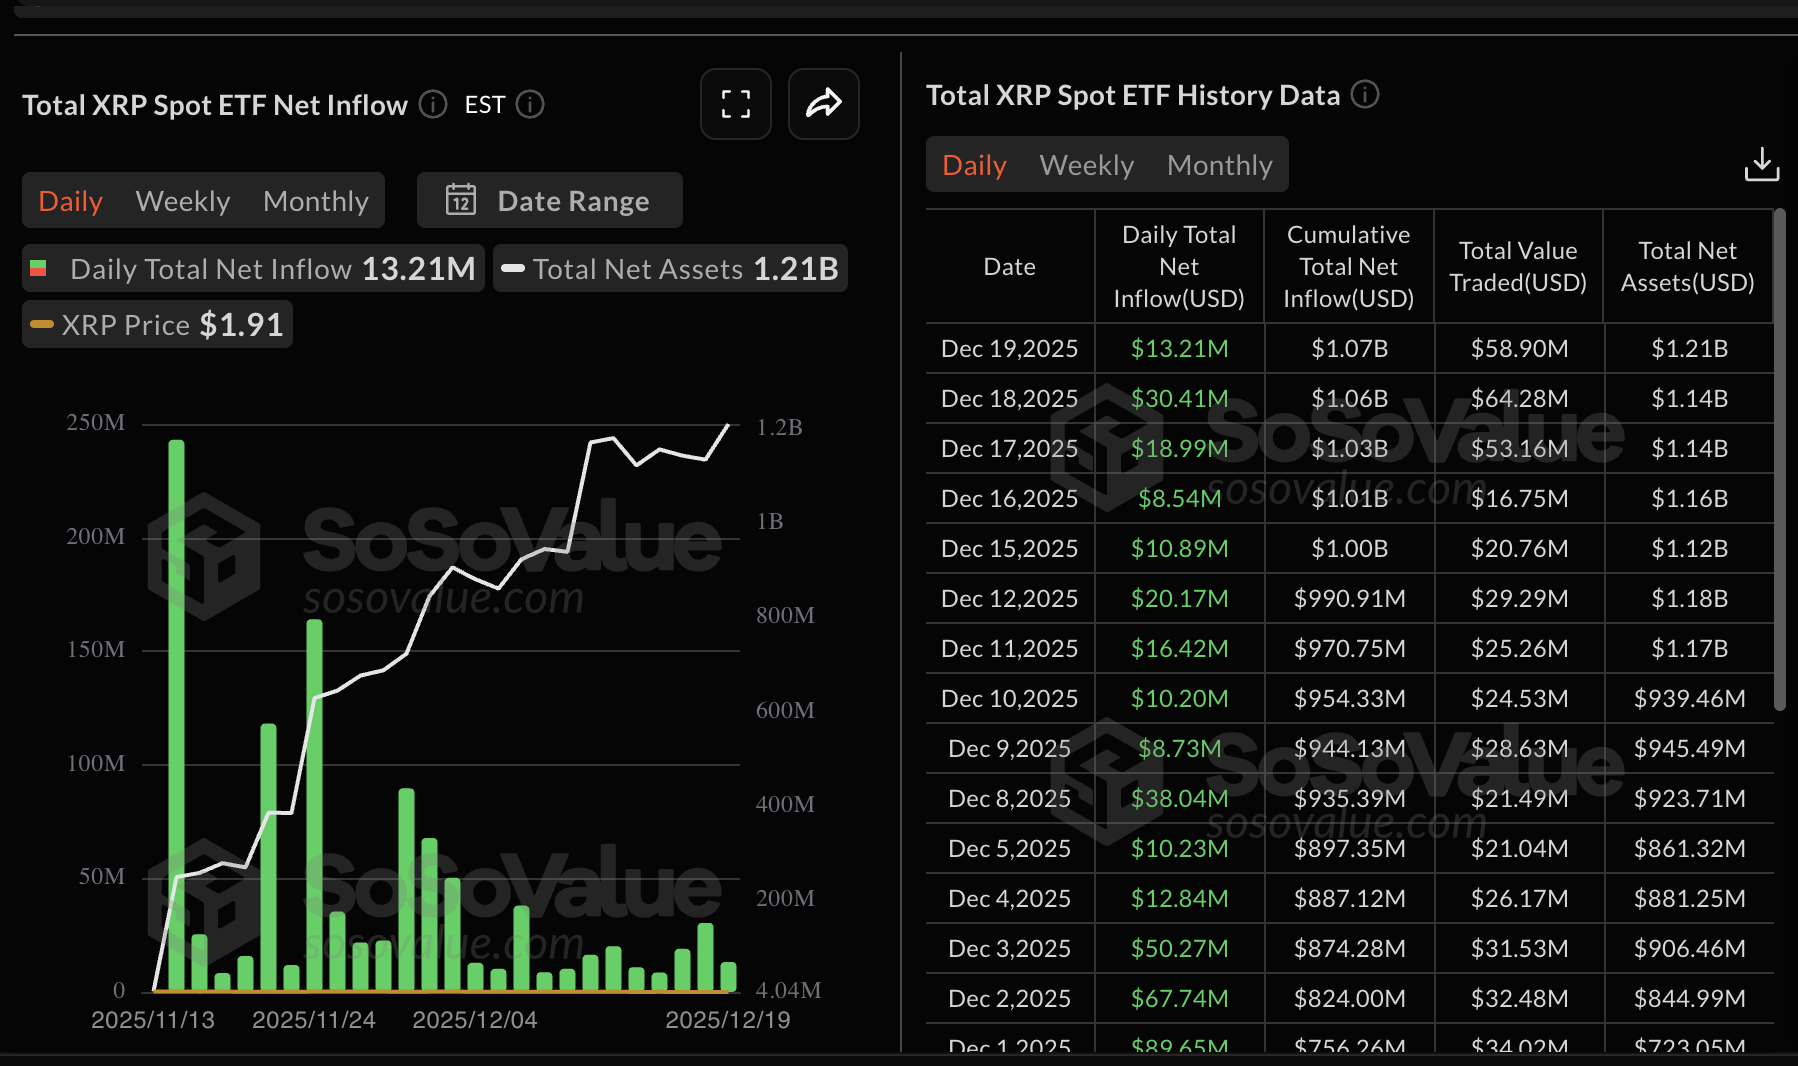
XRP spot Exchange Traded Funds (ETFs) extended their inflow streak, with approximately $13 million deposited last week. XRP ETFs’ cumulative inflow volume stands at $1.07 billion, with net assets averaging $1.21 billion.
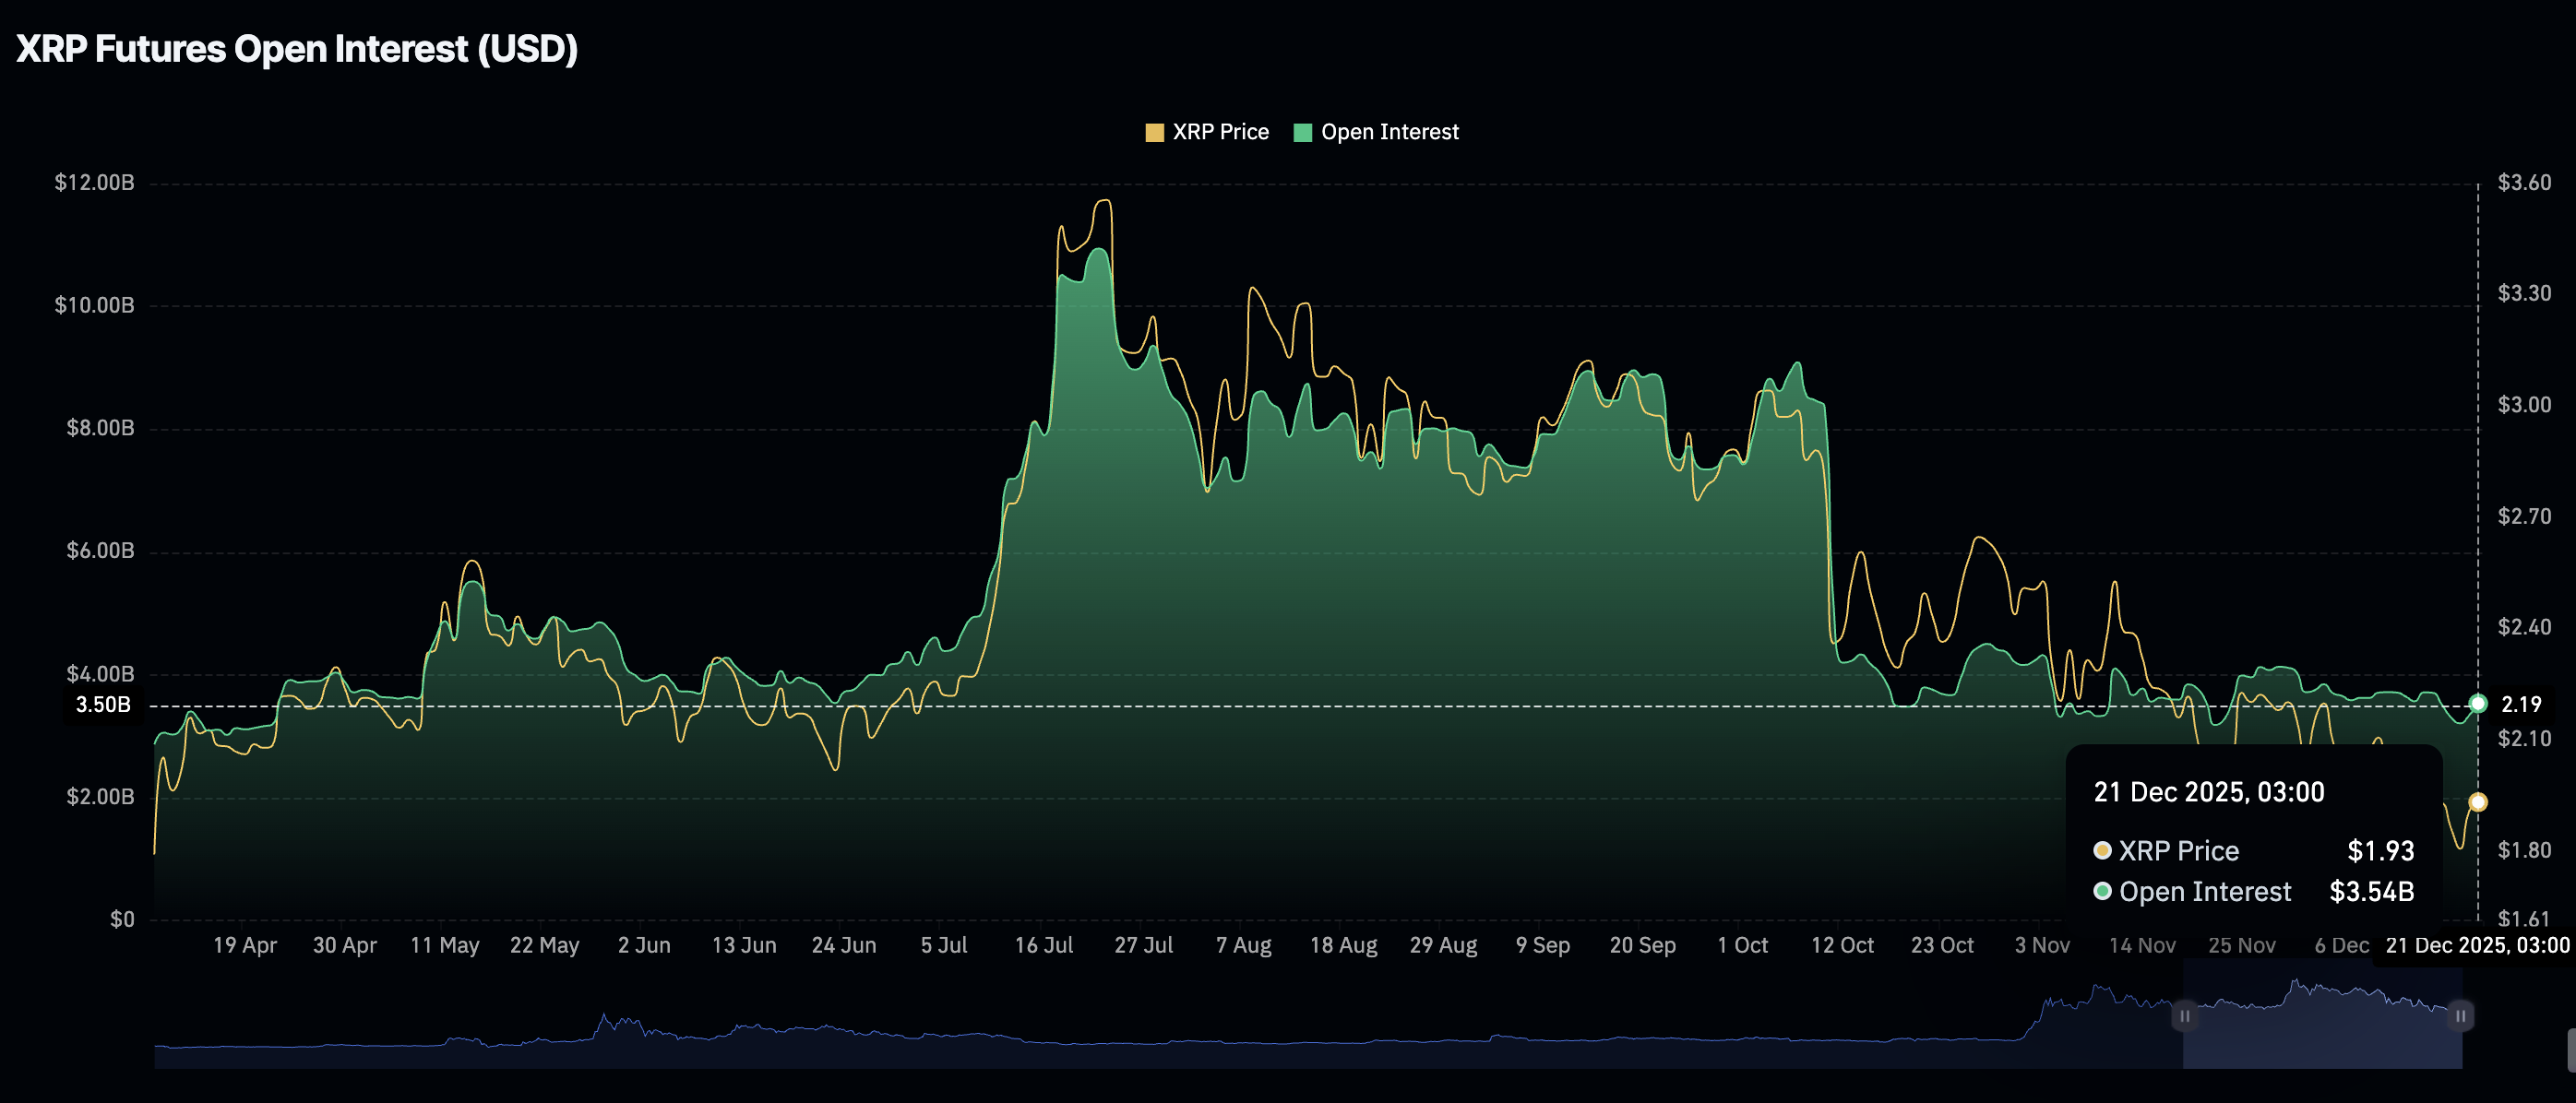
The XRP derivatives market, on the other hand, has experienced a mild resurgence in retail demand, as evidenced by futures Open Interest (OI) rising to $3.54 billion as of Sunday from $3.34 billion recorded on Saturday. The OI had dropped to $3.21 billion on Friday as volatility spiked across the cryptocurrency market, pushing retail investors to the sidelines.
Technical outlook: XRP consolidates ahead of potential breakout
XRP is trading above short-term support at $1.90 at the time of writing on Monday. The Relative Strength Index (RSI) has stabilized at 42 on the daily chart, suggesting that sideways trading may extend.
However, the token also sits below the 50-day Exponential Moving Average (EMA) at $2.13, the 100-day EMA at $2.31 and the 200-day EMA at $2.41, which highlights a bearish outlook.
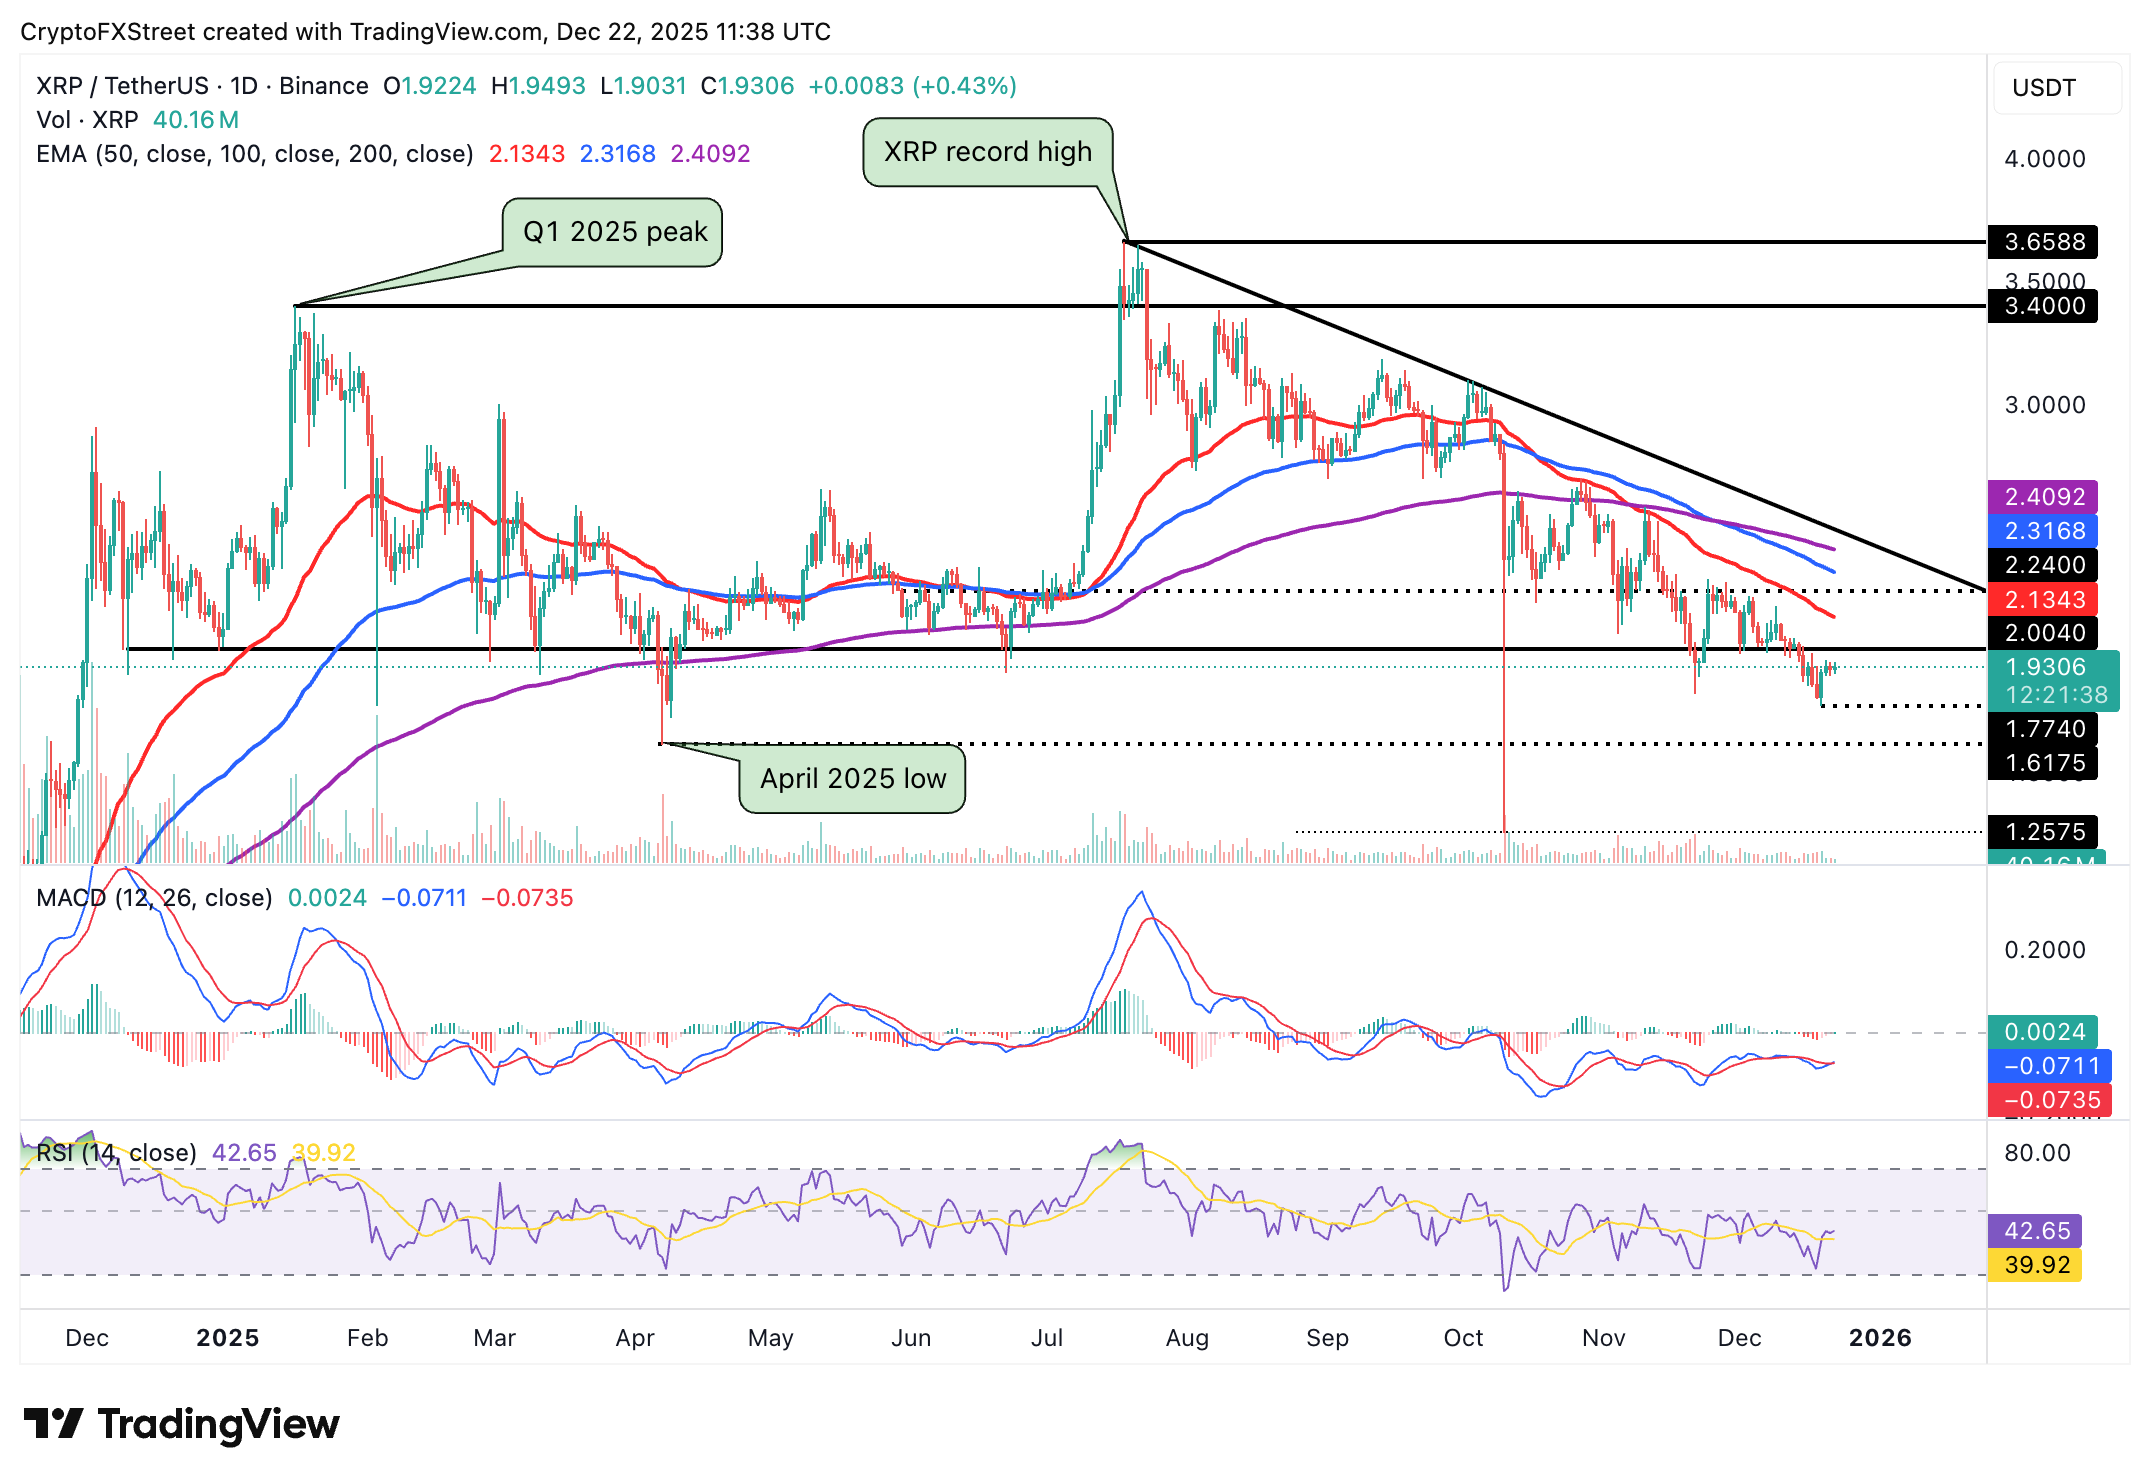
Still, the Moving Average Convergence Divergence (MACD) indicator has confirmed a buy signal on the same chart, characterised by the blue MACD line crossing above the red signal line.
Traders will consider increasing exposure if green histogram bars grow above the mean line while the indicator generally rises into the bullish region. However, failure to break above $2.00 and the 50-day EMA may keep rebounds limited and possibly increase the odds of a reversal toward support at $1.77, tested on Friday, and April’s low of $1.61.
Cryptocurrency metrics FAQs
The developer or creator of each cryptocurrency decides on the total number of tokens that can be minted or issued. Only a certain number of these assets can be minted by mining, staking or other mechanisms. This is defined by the algorithm of the underlying blockchain technology. On the other hand, circulating supply can also be decreased via actions such as burning tokens, or mistakenly sending assets to addresses of other incompatible blockchains.
Market capitalization is the result of multiplying the circulating supply of a certain asset by the asset’s current market value.
Trading volume refers to the total number of tokens for a specific asset that has been transacted or exchanged between buyers and sellers within set trading hours, for example, 24 hours. It is used to gauge market sentiment, this metric combines all volumes on centralized exchanges and decentralized exchanges. Increasing trading volume often denotes the demand for a certain asset as more people are buying and selling the cryptocurrency.
Funding rates are a concept designed to encourage traders to take positions and ensure perpetual contract prices match spot markets. It defines a mechanism by exchanges to ensure that future prices and index prices periodic payments regularly converge. When the funding rate is positive, the price of the perpetual contract is higher than the mark price. This means traders who are bullish and have opened long positions pay traders who are in short positions. On the other hand, a negative funding rate means perpetual prices are below the mark price, and hence traders with short positions pay traders who have opened long positions.
Author

John Isige
FXStreet
John Isige is a seasoned cryptocurrency journalist and markets analyst committed to delivering high-quality, actionable insights tailored to traders, investors, and crypto enthusiasts. He enjoys deep dives into emerging Web3 tren




